
Metabolic Signatures of Adiposity in Young Adults: Mendelian Randomization Analysis and Effects of Weight Change
Background:
Increased adiposity is linked with higher risk for cardiometabolic diseases. We aimed to determine to what extent elevated body mass index (BMI) within the normal weight range has causal effects on the detailed systemic metabolite profile in early adulthood.
Methods and Findings:
We used Mendelian randomization to estimate causal effects of BMI on 82 metabolic measures in 12,664 adolescents and young adults from four population-based cohorts in Finland (mean age 26 y, range 16–39 y; 51% women; mean ± standard deviation BMI 24±4 kg/m2). Circulating metabolites were quantified by high-throughput nuclear magnetic resonance metabolomics and biochemical assays. In cross-sectional analyses, elevated BMI was adversely associated with cardiometabolic risk markers throughout the systemic metabolite profile, including lipoprotein subclasses, fatty acid composition, amino acids, inflammatory markers, and various hormones (p<0.0005 for 68 measures). Metabolite associations with BMI were generally stronger for men than for women (median 136%, interquartile range 125%–183%). A gene score for predisposition to elevated BMI, composed of 32 established genetic correlates, was used as the instrument to assess causality. Causal effects of elevated BMI closely matched observational estimates (correspondence 87%±3%; R2 = 0.89), suggesting causative influences of adiposity on the levels of numerous metabolites (p<0.0005 for 24 measures), including lipoprotein lipid subclasses and particle size, branched-chain and aromatic amino acids, and inflammation-related glycoprotein acetyls. Causal analyses of certain metabolites and potential sex differences warrant stronger statistical power. Metabolite changes associated with change in BMI during 6 y of follow-up were examined for 1,488 individuals. Change in BMI was accompanied by widespread metabolite changes, which had an association pattern similar to that of the cross-sectional observations, yet with greater metabolic effects (correspondence 160%±2%; R2 = 0.92).
Conclusions:
Mendelian randomization indicates causal adverse effects of increased adiposity with multiple cardiometabolic risk markers across the metabolite profile in adolescents and young adults within the non-obese weight range. Consistent with the causal influences of adiposity, weight changes were paralleled by extensive metabolic changes, suggesting a broadly modifiable systemic metabolite profile in early adulthood.
Please see later in the article for the Editors' Summary
Published in the journal:
. PLoS Med 11(12): e32767. doi:10.1371/journal.pmed.1001765
Category:
Research Article
doi:
https://doi.org/10.1371/journal.pmed.1001765
Summary
Background:
Increased adiposity is linked with higher risk for cardiometabolic diseases. We aimed to determine to what extent elevated body mass index (BMI) within the normal weight range has causal effects on the detailed systemic metabolite profile in early adulthood.
Methods and Findings:
We used Mendelian randomization to estimate causal effects of BMI on 82 metabolic measures in 12,664 adolescents and young adults from four population-based cohorts in Finland (mean age 26 y, range 16–39 y; 51% women; mean ± standard deviation BMI 24±4 kg/m2). Circulating metabolites were quantified by high-throughput nuclear magnetic resonance metabolomics and biochemical assays. In cross-sectional analyses, elevated BMI was adversely associated with cardiometabolic risk markers throughout the systemic metabolite profile, including lipoprotein subclasses, fatty acid composition, amino acids, inflammatory markers, and various hormones (p<0.0005 for 68 measures). Metabolite associations with BMI were generally stronger for men than for women (median 136%, interquartile range 125%–183%). A gene score for predisposition to elevated BMI, composed of 32 established genetic correlates, was used as the instrument to assess causality. Causal effects of elevated BMI closely matched observational estimates (correspondence 87%±3%; R2 = 0.89), suggesting causative influences of adiposity on the levels of numerous metabolites (p<0.0005 for 24 measures), including lipoprotein lipid subclasses and particle size, branched-chain and aromatic amino acids, and inflammation-related glycoprotein acetyls. Causal analyses of certain metabolites and potential sex differences warrant stronger statistical power. Metabolite changes associated with change in BMI during 6 y of follow-up were examined for 1,488 individuals. Change in BMI was accompanied by widespread metabolite changes, which had an association pattern similar to that of the cross-sectional observations, yet with greater metabolic effects (correspondence 160%±2%; R2 = 0.92).
Conclusions:
Mendelian randomization indicates causal adverse effects of increased adiposity with multiple cardiometabolic risk markers across the metabolite profile in adolescents and young adults within the non-obese weight range. Consistent with the causal influences of adiposity, weight changes were paralleled by extensive metabolic changes, suggesting a broadly modifiable systemic metabolite profile in early adulthood.
Please see later in the article for the Editors' Summary
Introduction
The prevalence of overweight and obesity has reached epidemic proportions and represents a major threat to public health worldwide [1],[2]. Excess body weight, as assessed by body mass index (BMI), increases the risk for cardiovascular disease, type 2 diabetes, certain cancers, and premature death [2]–[6]. The increased morbidity and mortality linked with adiposity are partly attributed to abnormalities in glucose and lipid metabolism as well as hypertension [2],[3],[7]. Detailed metabolite profiling studies have further demonstrated global deviations in the molecular signatures of obesity when comparing small groups with large differences in body composition [8]–[10]. Yet it is unclear to what extent metabolic signatures of adiposity are observed in the systemic metabolism of adolescents and young adults within the non-obese range (BMI<30 kg/m2).
The causal influence of adiposity on levels of metabolic risk markers can be examined within the framework of Mendelian randomization, an instrumental variable approach that uses genetic variation as an instrument to infer causality (Figure 1; Box 1) [11]–[13]. By analogy with the randomized controlled trial, the variation in adiposity caused by genotype assigns study participants to slightly different levels of BMI. The use of genetic variation as an instrument circumvents issues of confounding and reverse causation, which can otherwise distort observational study findings. The causal effects of elevated BMI on the metabolite profile can be quantified and compared to the correlations observed in traditional study designs [7],[14],[15]. Mendelian randomization studies have previously indicated causative influences of adiposity on dyslipidemia, hypertension, and insulin resistance by using common BMI-related genetic variants including the FTO (fat mass and obesity associated) gene as the instrumental variable [7],[14]–[17]. The cause-and-effect relationship between modestly elevated BMI and the detailed systemic metabolite profile in early adulthood, however, remains incompletely understood [7],[15].

Box 1. Mendelian Randomization Framework for Estimating Causal Effects of BMI on the Systemic Metabolite Profile
Mendelian randomization is an instrumental variable approach to infer causality in observational studies in the presence of potential confounding and reverse causation [11]–[13]. The modifiable exposure in this study is adiposity, as assessed by BMI. A gene score for predisposition to elevated BMI, composed of 32 allelic variants, is used as the instrument [34]. Causal effects of adiposity on metabolite levels are estimated by examining the gene score for association with observed BMI, as well as with each metabolic measure separately using a triangulation approach:
(1)The association between BMI and metabolite concentration is examined in a traditional cross-sectional study design (indicated schematically by the bi-directional black arrows in Figure 1; association magnitudes βBMI-Metabolite). The observational associations can arise from both directions: the metabolites could affect BMI, and BMI could affect the metabolite levels. These observational associations could also be generated, enhanced, or diminished because of confounding.
(2)The gene score is confirmed to be associated with BMI (dark red arrow in Figure 1; association magnitude βGS-BMI). All study participants carry some BMI-raising alleles, but those in the upper end of the distribution on average have a few units' higher BMI than those in the lower end. Association magnitudes for each cohort are listed in Table 1.
(3)The association between the gene score and each metabolite is tested (orange arrows in Figure 1; association magnitudes βGS-Metabolite). The genetic effect on the metabolites is assumed to be mediated entirely through the effect on BMI. Since genetic variants are assigned randomly at conception, transmission of the effects is independent of confounding factors. Further, genetic variation is not modified by phenotype (BMI or metabolite), so metabolite associations with the gene score are not affected by reverse causation. The gene score hereby serves to circumvent the limitations of the observational associations noted above. The instrumental variable (causal effect) estimate, βIV, is the gene score association with metabolite divided by the gene score association with BMI.
If adiposity exerts causal, non-confounded effects on a metabolite level, then the causal estimate is expected to be of a magnitude similar to that observed in the cross-sectional analysis. The causal estimate βIV and the cross-sectional association βBMI-Metabolite are compared using a Z-test for statistical difference.
The overall correspondence between the causal effects and observational associations are summarized in Figure 5 by the slope of the fit between the causal estimates and cross-sectional associations for the 82 metabolic measures analyzed. The cross-sectional associations and causal effect estimates in absolute concentration units and exact p-values are listed in Table S3.
The core assumptions for the instrument to be valid for estimating causal effects by Mendelian randomization are as follows:
-
The gene score is robustly associated with observed BMI (Table 1).
-
The gene score is independent of confounding factors. Associations of the gene score with age, sex, smoking, alcohol intake, physical activity, and socio-economic status are shown in Table S2.
-
The gene score is related to the metabolite levels only through the effect on adiposity. Potential pleiotropy is assessed in Table 2, and association between the gene score and metabolites when adjusted for observed BMI are shown in Figure S3.
-
All of the associations examined are linear and not affected by interactions. The linearity of the BMI–metabolite associations is illustrated in Figure S2. Whilst some sex differences were observed in cross-sectional analyses, the gene score had insufficient power to resolve such small potential differences in the causal estimates. Suggestive sex differences in the causal effect estimates are listed in Table S4.


Intervention trials have shown favorable effects of weight reduction on cardiovascular risk factors [5],[18],[19]. Nevertheless, these trials have been conducted predominantly among clinically obese individuals [4],[5],[20]. The detailed metabolic effects of spontaneous weight change in healthy young adults remain incompletely investigated. Examining the responsiveness of the systemic metabolite profile to weight change could provide observational evidence on the anticipated effects of weight loss. To characterize the metabolic signatures of adiposity, we conducted comprehensive profiling of 12,664 adolescents and young adults from four population-based cohorts in Finland. The objectives were (1) to quantify cross-sectional associations of BMI with systemic metabolite levels, (2) to estimate causal effects of BMI on metabolite concentrations using Mendelian randomization, and (3) to assess the response of the metabolite profile to weight change during a 6-y follow-up. The pattern of metabolic aberrations observed cross-sectionally was compared to the causal effect estimates and longitudinal associations in order to summarize the influence of adiposity on the metabolic risk profile, and to clarify the metabolic consequences of weight change in early adulthood.
Methods
Study Populations
The study comprised four population-based cohorts (Table 1): the Northern Finland Birth Cohort of 1986 (NFBC86, n = 3,976 adolescents aged 16 y) [21], the Northern Finland Birth Cohort of 1966 (NFBC66, n = 4,671 individuals aged 31 y) [22], the Cardiovascular Risk in Young Finns Study (YFS, n = 2,171 individuals aged 24–39 y) [23], and FINRISK 1997 (n = 1,846 individuals aged 24–39 y) [24]. The study protocols were approved by the ethics committees of Northern Ostrobothnia Hospital District, Finland; the five universities with medical schools in Finland; and the National Public Health Institute, Helsinki, Finland. All participants gave written informed consent. Individuals aged 40 y or above were omitted from the present study (19% of eligible study population); this age cutoff was applied to focus on adolescent and young adults in order to minimize the influences of age and disease on metabolites and BMI [25]. Pregnant women (n = 208) and persons with diabetes or on anti-hypertensive or lipid treatment (n = 305) were also excluded from analyses. In total, 12,664 adolescents and young adults with measured comprehensive metabolite profiles and gene scores for predisposition to elevated BMI were included in the study. A subset of 1,488 persons from YFS further attended a 6-y follow-up survey, with the metabolite profile measured again. BMI was calculated as weight in kilograms divided by height in meters squared. Waist circumference, blood pressure, and standard biochemical assays were measured as part of the clinical examination. Smoking status, usage of alcohol, and physical activity index were assessed by questionnaires [26]. Secondary analyses were conducted for 2,850 older individuals from FINRISK as well as for the Pieksämäki Study (n = 628 individuals aged 40–57 y) [27]. Further details of the study populations are described in Text S1.
Metabolite Quantification
A high-throughput serum nuclear magnetic resonance (NMR) spectroscopy platform [28] was utilized to quantify 67 metabolic measures that represent a broad molecular signature of the systemic metabolite profile. The metabolite set covers multiple metabolic pathways, and includes lipoprotein lipids, fatty acids, amino acids, and glycolysis precursors (Table S1). Fourteen lipoprotein subclasses were analyzed as part of the metabolite profile, with the subclass sizes defined as follows: extremely large very-low-density lipoproteins (VLDLs) (particle diameter from 75 nm upwards), five VLDL subclasses (average particle diameters of 64.0 nm, 53.6 nm, 44.5 nm, 36.8 nm, and 31.3 nm), intermediate-density lipoproteins (28.6 nm), three low-density lipoprotein (LDL) subclasses (25.5 nm, 23.0 nm, and 18.7 nm), and four high-density lipoprotein (HDL) subclasses (14.3 nm, 12.1 nm, 10.9 nm, and 8.7 nm). The NMR-based metabolite profiling employed in this study has previously been used in various epidemiological studies [25]–[31], and details of the experimentation have been described [28],[32],[33]. Furthermore, 15 additional measures, including various inflammatory markers, liver function surrogates, hormones, and blood pressure, were analyzed (Text S1). These additional metabolic measures, assayed in at least two of the cohorts, were selected to complement the comprehensive characterization of cardiometabolic effects of adiposity across multiple pathways and to enhance comparability with prior Mendelian randomization studies [7],[14]–[16].
Genotyping
A gene score for predisposition to elevated BMI, composed of 32 single nucleotide polymorphisms firmly associated with BMI in prior genome-wide association studies, was used as the instrument to assess causality [34]. The genetic variants constituting the gene score are listed in Table 2. Genotyping of the 32 variants was conducted on Illumina HumanHap 370 k and 670 k platforms for NFBC66 and YFS, respectively. Variants not directly genotyped were imputed based on HapMap 2. Genotyping in NFBC86 was done using the Illumina Cardio-Metabochip [35]. For FINRISK, 28 out of the 32 variants were genotyped by iPLEX Sequenom MassARRAY. Genetic variants in high linkage disequilibrium were used in case of missing variants in the gene score, as listed in Table 2. For the instrumental variable analyses, the genotypes were combined into a gene score for elevated BMI by summing the allele count for each individual variant weighted by the effect size determined in large-scale genome-wide association meta-analyses [34].
Statistical Analyses
Metabolites with skewed distributions were log-transformed prior to analyses. All metabolite concentrations were scaled to standard deviation (SD) units separately in each cohort. This scaling enabled comparison of association magnitudes across the metabolic measures. We calculated that 33 principal components explain>95% of the variance in each cohort [30], because of the correlation of the metabolic measures (Figure S1). With cross-sectional instrumental variable and longitudinal analyses performed, we used multiple testing correction for 100 independent tests according to the Bonferroni method. Statistical significance was therefore inferred at p<0.0005.
For cross-sectional analyses, linear regression models were fitted for each metabolite, with BMI as the explanatory variable and the metabolite concentration as outcome. The regression coefficients βBMI–Metabolite were calculated in units of 1-SD metabolite concentration per 1-kg/m2 increment in BMI. Associations were adjusted for sex and age, if applicable. Results were analyzed separately for the four cohorts and combined using random effect inverse-variance-weighted meta-analysis [7]. The continuous shapes of the cross-sectional associations were illustrated by fitting quadratic curves of median and interquartile metabolite concentrations for each percentile of BMI for women and men (Figure S2). Significant sex interactions were observed for numerous metabolites in cross-sectional analyses; however, the absolute differences were mostly small. The sex differences were generally not resolved in the Mendelian randomization analyses, and the causal effects were therefore estimated for women and men combined.
For Mendelian randomization analyses, we used a gene score for predisposition to higher BMI as the instrumental variable. The individual genetic variants and their weights in the gene score are listed in Table S2. The Mendelian randomization framework for estimating causal effects and the core conditions for the gene score to serve as a valid instrument are described in Figure 1 and Box 1 [11]–[13]. Causal effect estimates and corresponding standard errors of BMI on the metabolic measures were calculated using the two-stage least squares method with adjustment for sex and age. The instrumental variable (causal effect) estimates are hereby equal to βIV = βGS-Metabolite/βGS-BMI, where βGS-Metabolite is the association of the gene score with the metabolic measure, and βGS-BMI is the association of the gene score with observed BMI [12]. The causal estimates were computed separately for each cohort and subsequently meta-analyzed. The magnitudes of the causal effects were then compared to the corresponding cross-sectional observations: for each metabolite, we tested for statistical difference between the cross-sectional and instrumental association magnitudes using a classical Z-statistic [7],[14]. The overall correspondence between the association patterns was quantified by a linear fit of causal effect estimates versus cross-sectional associations. For the metabolites with suggestive sex interaction in association with the gene score, the Mendelian randomization analyses were further tested separately for women and men.
Changes in metabolite levels with changes in BMI over time were examined for 1,488 individuals for whom metabolite data were also available at 6-y follow-up. Longitudinal associations were assessed for each metabolite using a linear regression model with the 6-y change in BMI as predictor and the 6-y change in metabolite concentration as the outcome. The models were adjusted for age and sex. No robust sex interactions were observed in longitudinal analyses. To enable comparison with the cross-sectional associations, longitudinal association magnitudes are reported as the change in metabolite concentration (in units of baseline SD) per unit change in BMI during follow-up. Longitudinal association magnitudes were then tested for statistical difference from the corresponding cross-sectional associations in the full study population. The overall correspondence between the association patterns was quantified by a linear fit of longitudinal versus cross-sectional associations. The longitudinal analyses were additionally replicated for 1,372 individuals at 10-y follow-up in YFS, as well as in the Pieksämäki Study, consisting of 456 middle-aged persons with 6-y follow-up (Text S1) [27]. To further illustrate the metabolic changes paralleled by weight change, the median changes in metabolite concentrations were calculated for subgroups of people who displayed 3%–6% and 6%–10% weight loss or weight gain during the 6-y follow-up period in YFS. For these analyses, weight and metabolite concentrations were mean-centered for both baseline and follow-up to account for potential batch effects. The confidence intervals of the medians were estimated by 10,000 bootstrap replicates.
Results
The study comprised 12,664 adolescents and young adults from four general population cohorts who all had detailed metabolite profiles measured and information on gene score for predisposition to elevated BMI. In addition, 1,488 individuals also had metabolite profiling data at 6-y follow-up. Clinical characteristics of the four cohorts are shown in Table 1. The mean BMI of 24.7 kg/m2 in the three cohorts of young adults reflects the population average in Finland [24]. Twenty-three percent were overweight, and 7% were obese. Mean concentrations of the assayed metabolites are listed in Table S1. The correlations between the metabolites are shown in Figure S1.
BMI and the Systemic Metabolite Profile
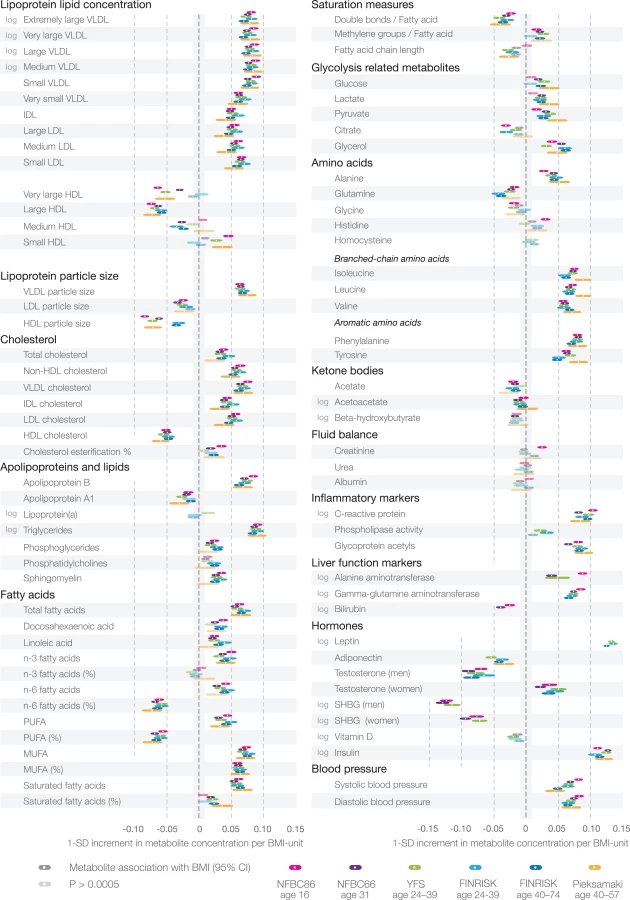
Cross-sectional associations of BMI with 82 metabolic measures are illustrated in Figure 2 for women (red) and men (blue). For both sexes, the majority of the metabolites were associated with BMI (66 measures for men and 61 for women at p<0.0005 in meta-analyses). Metabolite associations tended to be stronger for men than for women (median 136%, interquartile range 125%–183%); however, the association patterns were generally in the same direction, towards a more risk-prone systemic metabolite profile for those with higher BMI. Lipoprotein lipids displayed a characteristic association pattern with BMI: the most pronounced associations were observed for VLDL lipids, whereas associations with LDL lipids were weaker, albeit increased for small LDL lipid concentration. HDL lipids displayed heterogeneous associations, with strong inverse associations for large HDL lipid concentration and HDL particle size. Prominent direct associations with BMI were observed for monounsaturated and saturated fatty acids. The ratio of polyunsaturated fatty acids to total fatty acids was inversely associated with BMI. Fatty acid associations were about twice as strong for men as for women. Only weak associations were observed for glycolysis-related metabolites for both sexes in this young study population. In contrast, branched-chain and aromatic amino acids were strongly positively associated with BMI, with magnitudes comparable to those of total cholesterol and triglycerides. Further, sizeable associations were observed between BMI and metabolic risk factors such as markers of inflammation and liver function, as well as between BMI and adiposity-related hormones.

Most metabolite associations followed approximately linear shapes across the range of BMI, with increases observed already within the normal weight range (BMI<25 kg/m2), as illustrated in Figure S2. Cross-sectional association magnitudes in absolute concentration units (e.g., mmol/l per kg/m2) are also indicated in Figure S2. The cross-sectional metabolite associations with BMI were coherent across all four study populations, as well as for middle-aged persons from the FINRISK study (n = 3,676, aged 40–74 y) and the Pieksämäki Study (n = 628, aged 40–57 y), and were similar when adjusting for smoking status, alcohol intake, and physical activity index (Figure 3).
Causal Effects of Adiposity on the Metabolic Profile
The causal effects of BMI on the systemic metabolite profile were analyzed using Mendelian randomization. The principles of this instrumental variable framework are detailed in Box 1 [11]–[13]. A weighted gene score, composed of 32 established genetic variants for predisposition to elevated BMI (Table 2), served as the instrument to estimate causal metabolic effects per 1-kg/m2 increment in BMI [34]. The gene score was robustly correlated with observed BMI (Pearson's correlation r = 0.15; p = 2×10−62, F-statistic = 194) and explained 1.3%–2.6% of the variation in BMI in the study populations (Table 1). Further, the gene score was not associated with potential confounders including sex, age, smoking, alcohol usage, or physical activity, as assessed by questionnaires (Table S2). The Mendelian randomization analyses were combined for women and men, since there was limited evidence for sex interactions resolved by the genetic instrument.
Causal effect estimates of BMI on the 82 metabolic measures are shown by the orange bars in Figure 4. The corresponding cross-sectional associations are indicated by white bars in Figure 4. The causal estimates based on Mendelian randomization gave rise to a metabolite association pattern highly concordant with that observed cross-sectionally: the effects of a 1-kg/m2 increment in BMI due to genetic predisposition closely matched the metabolic aberrations observed per 1-unit increment in observed BMI. The overall correspondence between the causal effect estimates and cross-sectional associations followed a straight line (R2 = 0.89 [95% CI 0.84–0.93]; Figure 5), with a slope 0.87±0.03, consistent with causal effects of adiposity across the systemic metabolite profile. Cross-sectional association magnitudes and causal effect estimates did not significantly differ (p>0.0005) for any of the metabolic measures analyzed. The cross-sectional associations and causal effect estimates of each metabolite in absolute concentration units and with exact p-values are listed in Table S3.


In terms of individual metabolic risk factors, the causal estimates were significant for 24 of the metabolic measures at p<0.0005 (multiple testing corrected), and for a further 19 metabolic measures at p<0.05 (nominal significance). The strongest causal effect estimates were observed for VLDL and LDL lipids, branched-chain and aromatic amino acids, inflammatory markers, leptin, insulin, and blood pressure. Prominent inverse causal effects were found for large HDL lipid concentration, HDL particle size, and sex hormone–binding globulin.
Causal effect estimates were similar when using an unweighted gene score as the instrument for Mendelian randomization analyses (slope 0.82±0.04; R2 = 0.85 [95% CI 0.79–0.91]), as well as when omitting the widely studied FTO locus (slope 0.79±0.04; R2 = 0.82 [95% CI 0.75–0.89]) or any other individual variant from the gene score (Table 2). The causal effect estimates were also unaltered when adiposity was assessed by waist circumference utilizing the same genetic instrument (slope 0.87±0.04; R2 = 0.86 [95% CI 0.81–0.91]). None of the metabolites were associated with the gene score when the model was adjusted for observed BMI (Figure S3), thus further arguing against pleiotropic effects of the genetic instrument. Associations for the small number of metabolites that displayed suggestive interaction by sex (p<0.05 for interaction) for the causal estimates are listed in Table S4.
Weight Change and Metabolic Response
To study the response of the metabolite profile to weight change, we examined associations between change in BMI and change in metabolite levels among 1,488 young adults at 6-y follow-up. These longitudinal associations are illustrated in Figure 4 by green bars. The concentration changes in 57 out of 76 metabolic measures were associated with 6-y change in BMI at p<0.0005. The metabolite changes followed an association pattern similar to the one observed in the cross-sectional analyses: those metabolites most strongly associated with BMI at one time point also displayed the highest responsiveness to changes in BMI over the follow-up period. However, the magnitudes of longitudinal associations were generally larger than the corresponding cross-sectional associations. The overall correspondence between longitudinal and cross-sectional associations followed a straight line (R2 = 0.92 [95% CI 0.89–0.95]) with a slope of 1.60±0.05 (Figure 6).

Larger metabolic changes than expected based on the cross-sectional associations were observed for numerous lipoprotein lipid and cholesterol measures, fatty acids, and branched-chain amino acids, as well as inflammatory markers, adiponectin, and insulin. The magnitudes of the longitudinal associations in absolute concentration units are listed in Table S3. Similar results were obtained when the longitudinal analyses were further adjusted for baseline metabolite concentration, change in smoking status, change in alcohol intake, and change in physical activity (Figure S4). Similar results were also obtained when the longitudinal associations were examined at 10-y follow-up for the same study population (Figure S4; slope 1.60±0.06; R2 = 0.91 [95% CI 0.87–0.95]). The longitudinal associations further replicated in the Pieksämäki cohort of 456 middle-aged adults with 6-y follow-up (Figure S4; slope 1.58±0.11; R2 = 0.79 [95% CI 0.71–0.87]).
Changes in the metabolite profile with weight loss and weight gain at 6-y follow-up are illustrated in Figure 7. The metabolite changes are shown in SD units to ease comparison across metabolites; the corresponding metabolite changes in absolute concentration units are listed in Table S5. Widespread changes across the systemic metabolite profile were observed for both weight loss and weight gain in a graded manner. The metabolic changes paralleled by weight loss essentially mirrored the effects of weight gain: a weight loss of 6%–10% (mean 5.5 kg) was accompanied by lower levels of multiple cardiometabolic risk factors, including the lipoprotein subclass profile and diabetes-predictive amino acids, whereas a weight gain of 6%–10% (mean 5.9 kg) was associated with substantial metabolic changes in multiple pathways linked with higher cardiometabolic risk [31],[36]–[38]. Although HDL cholesterol was essentially unaltered for all weight change categories, substantial changes were observed within the HDL subclasses. Weight loss was also paralleled by decreased concentrations of monounsaturated fatty acids, improved ratio of polyunsaturated fatty acids to total fatty acids, and lower levels of chronic inflammation markers.

Discussion
In this study of 12,664 healthy adolescents and young adults, elevated BMI was associated with adverse effects on numerous known and novel risk markers for cardiovascular disease and type 2 diabetes throughout the systemic metabolite profile [28],[31],[36]–[38]. Causal effect estimates obtained using Mendelian randomization followed a strikingly similar signature of metabolic aberrations. This strongly supports causative effects of adiposity across multiple cardiometabolic risk factors, even in young adults within the non-obese weight range. Causal metabolic effects of excess body weight included an unfavorable lipoprotein subclass profile and increased concentrations of branched-chain amino acids and inflammatory markers, as well as perturbed hormone levels and elevated blood pressure. These aberrations illustrate the diverse impact of adiposity on systemic metabolism, and demonstrate causal underpinnings for the clustering of metabolic risk factors commonly observed alongside obesity [39]. Consistent with the causative effect of adiposity on the metabolite profile, pronounced metabolic changes accompanied weight change at 6-y follow-up. Thus, despite genetic influences on both adiposity and the metabolite profile [29],[34], the results suggest that the metabolite profile is broadly modifiable in young adults through lifestyle changes.
The causal effects of adiposity across multiple metabolic measures corroborate prior Mendelian randomization studies, which have examined the role of the FTO locus on standard metabolic risk factors and cardiovascular disease [7],[14],[16],[40],[41]. The causal relationships are here extended to include lipoprotein subclass profiles and detailed lipid measures, branched-chain and aromatic amino acids, inflammation-linked glycoprotein acetyls [31], leptin, and sex hormone–binding globulin (Figure 4). The high consistency between the patterns of cross-sectional associations and casual effect estimates indicates that only little residual confounding contributes to the metabolic signatures of adiposity in early adulthood (Figure 5). The perturbed lipoprotein subclass pattern substantiates the causal role of adiposity in raising triglyceride-rich VLDL lipids and lowering HDL cholesterol [7],[14],[15], and further highlights the heterogeneity of HDL particles. Although high LDL cholesterol is conventionally not considered part of the dyslipidemic pattern of obesity [39], our results also indicate causative effects of elevated BMI on medium-sized and small LDL lipids. Branched-chain and aromatic amino acids are associated with the risk for cardiovascular disease and type 2 diabetes [37],[38]; their elevation due to higher adiposity could at least partly explain how these amino acids reflect the risk for future cardiometabolic disease. Causal effects on higher glycoprotein acetyl levels, which have recently been linked with the risk for both vascular and nonvascular mortality [31], suggest that increased adiposity contributes to this marker of chronic inflammation. The causality of these novel biomarkers in relation to disease outcomes still remains unknown; however, the causal role of adiposity across numerous metabolic risk markers could potentially contribute to the excess cardiovascular risk mediated by high BMI beyond the effects on raised blood pressure, cholesterol, and glucose [3].
Despite the heritable component of adiposity, BMI is a modifiable risk factor. Changes in BMI were paralleled by changes throughout the metabolite profile (Figures 4 and 7), which is consistent with the causal metabolic effects of adiposity. A systemic metabolite profile linked with high cardiometabolic risk in early adulthood is therefore not fixed once established, but can be reversed. These observational results are in line with weight loss interventions showing improved metabolic risk factors among overweight and obese individuals [15]–[20],[42]; the detailed metabolic profiling applied in this study extends the results to a more fine-grained molecular signature. The metabolite concentration changes were greater than anticipated—on average 60%—if effects were mediated directly through change in BMI rather than via more particular aspects of adiposity (Figure 6). This unexpectedly large metabolic response could possibly arise from concurrent lifestyle changes contributing to the obtained weight change, such as changes in diet or physical activity that are known to affect the metabolite profile [17],[26],[30]. The metabolic changes with weight loss and weight gain followed a graded trend, with adverse metabolic effects accompanying even a modest weight increase in this study population of largely non-obese individuals (Figure 7). These results are consistent with the continuous character of the metabolite associations with BMI observed cross-sectionally (Figure S2) and with the causal effects of adiposity across the comprehensive metabolite profile. The present study thus suggests unfavorable metabolic effects for any increase in BMI, without evidence of a threshold below which an increase in BMI would not affect the metabolite profile. Even though the individual metabolite deviations caused by a 1-kg/m2 increment in BMI were modest, the combined effects across the metabolite profile may have considerable implications. With the increasing trends in BMI worldwide, the adverse metabolic effects of adiposity observed in adolescents and young adults starting within the lean range of BMI may translate into direct consequences for cardiometabolic risk in the general population [1]–[3],[6],[36]–[38].
Our study has both strengths and limitations. BMI is a heterogeneous marker of adiposity; however, it predicts the risk of related complications and is relevant for large population studies [1]–[3],[6]. Pleiotropy is a concern in Mendelian randomization; the use of a multigenic instrument is helpful in this regard as it dilutes the effects of single genetic variant pleiotropy [11]–[13],[41]. Results were consistent when each individual variant was omitted in turn from the gene score (Table 2), suggesting that the metabolic effects are not attributable to a specific genetic variant. As far as we are aware, the multigenic score is a valid instrument; however, we acknowledge that the causal inference conducted depends on this assumption. Although observational associations and causal effect estimates matched across the metabolic measures analyzed, the inference of causality for certain metabolites and potential sex differences warrant stronger statistical power. The molecular coverage afforded by other metabolomics methods complementary to NMR may provide additional insights into the comprehensive metabolic effects of adiposity [36],[43]. Strengths of the study include detailed profiling across multiple metabolic pathways in large cohorts of healthy young adults and adolescents to quantify causal estimates and effects of weight change beyond established risk factors [28],[31],[36],[37].
The ideal body weight that healthy adults should strive to attain remains controversial [6],[44],[45]. The present study suggests widespread adverse metabolic effects with any increase in BMI among young adults within the non-obese weight range. However, modest weight loss was accompanied by multiple favorable changes in the systemic metabolite profile. The causative effect of adiposity on multiple cardiometabolic risk markers across the metabolite profile highlights the importance of population-level weight reduction as a key target for comprehensive risk factor control among young adults.
Supporting Information
Zdroje
1. NgM, FlemingT, RobinsonM, ThomsonB, GraetzN, et al. (2014) Global, regional, and national prevalence of overweight and obesity in children and adults during 1980–2013: a systematic analysis for the Global Burden of Disease Study 2013. Lancet 384 : 766–781.
2. Prospective Studies Collaboration (2009) WhitlockG, LewingtonS, SherlikerP, ClarkeR, et al. (2009) Body-mass index and cause-specific mortality in 900 000 adults: collaborative analyses of 57 prospective studies. Lancet 373 : 1083–1096.
3. Global Burden of Metabolic Risk Factors for Chronic Diseases Collaboration (BMI Mediated Effects) (2014) LuY, HajifathalianK, EzzatiM, WoodwardM, et al. (2014) Metabolic mediators of the effects of body-mass index, overweight, and obesity on coronary heart disease and stroke: a pooled analysis of 97 prospective cohorts with 1.8 million participants. Lancet 383 : 970–983.
4. LewisCE, McTigueKM, BurkeLE, PoirierP, EckelRH, et al. (2009) Mortality, health outcomes, and body mass index in the overweight range. Circulation 119 : 3263–3271.
5. JensenMD, RyanDH, ApovianCM, ArdJD, ComuzzieAG, et al. (2014) 2013 AHA/ACC/TOS guideline for the management of overweight and obesity in adults: a report of the American College of Cardiology/American Heart Association Task Force on Practice Guidelines and the Obesity Society. Circulation 129(25 Suppl 2): S102–S138.
6. Berrington de GonzalezA, HartgeP, CerhanJR, FlintAJ, HannanL, et al. (2010) Body-mass index and mortality among 1.46 million white adults. N Engl J Med 363 : 2211–2219.
7. FallT, HäggS, MägiR, PlonerA, FischerK, et al. (2013) The role of adiposity in cardiometabolic traits: a Mendelian randomization analysis. PLoS Med 10: e1001474.
8. NewgardCB, AnJ, BainJR, MuehlbauerMJ, StevensRD, et al. (2009) A branched-chain amino acid-related metabolic signature that differentiates obese and lean humans and contributes to insulin resistance. Cell Metab 9 : 311–326.
9. PietiläinenKH, RógT, Seppänen-LaaksoT, VirtueS, GopalacharyuluP, et al. (2011) Association of lipidome remodeling in the adipocyte membrane with acquired obesity in humans. PLoS Biol 9: e1000623.
10. LaferrèreB, ReillyD, AriasS, SwerdlowN, GorroochurnP, et al. (2011) Differential metabolic impact of gastric bypass surgery versus dietary intervention in obese diabetic subjects despite identical weight loss. Sci Transl Med 3 : 80re2.
11. Davey SmithG, EbrahimS (2003) Mendelian randomization: can genetic epidemiology contribute to understanding environmental determinants of disease? Int J Epidemiol 32 : 1–22.
12. LawlorDA, HarbordRM, SterneJAC, TimpsonN, Davey SmithG (2008) Mendelian randomization: using genes as instruments for making causal inferences in epidemiology. Stat Med 27 : 1133–1163.
13. Davey SmithG, HemaniG (2014) Mendelian randomization: genetic anchors for causal inference in epidemiological studies. Hum Mol Gen 23: R89–R98.
14. FreathyRM, TimpsonNJ, LawlorDA, PoutaA, Ben-ShlomoY, et al. (2008) Common variation in the FTO gene alters diabetes-related metabolic traits to the extent expected given its effect on BMI. Diabetes 57 : 1419–1426.
15. HolmesMV, LangeLA, PalmerT, LanktreeMB, NorthKE, et al. (2014) Causal effects of body mass index on cardiometabolic traits and events: a Mendelian randomization analysis. Am J Hum Genet 94 : 198–208.
16. TimpsonN, HarbordR, Davey SmithG, ZachoJ, Tybaerg-HansenA, et al. (2009) Does greater adiposity increase blood pressure and hypertension risk? Mendelian Randomization using FTO/MC4R genotype. Hypertension 54 : 84–90.
17. RichmondRC, Davey SmithG, NessAR, den HoedM, McMahonG, et al. (2014) Assessing causality in the association between child adiposity and physical activity levels: a Mendelian randomization analysis. PLoS Med 11: e1001618.
18. TuomilehtoJ, LindströmJ, ErikssonJG, ValleTT, HämäläinenH, et al. (2001) Prevention of type 2 diabetes mellitus by changes in lifestyle among subjects with impaired glucose tolerance. N Engl J Med 344 : 1343–1350.
19. PoirierP, GilesTD, BrayGA, HongY, SternJS, et al. (2006) Obesity and cardiovascular disease: pathophysiology, evaluation, and effect of weight loss: an update of the 1997 American Heart Association scientific statement on obesity and heart disease from the obesity committee of the council on nutrition, physical activity, and metabolism. Circulation 113 : 898–918.
20. MoyerVA (2012) US Preventive Services Task Force (2012) Screening for and management of obesity in adults: U.S. Preventive Services Task Force recommendation statement. Ann Intern Med 157 : 373–378.
21. KantomaaMT, StamatakisE, KankaanpääA, KaakinenM, RodriguezA, et al. (2013) Physical activity and obesity mediate the association between childhood motor function and adolescents' academic achievement. Proc Natl Acad Sci U S A 110 : 1917–1922.
22. SabattiC, ServiceSK, HartikainenA, PoutaA, RipattiS, et al. (2009) Genome-wide association analysis of metabolic traits in a birth cohort from a founder population. Nat Genet 41 : 35–46.
23. RaitakariOT, JuonalaM, RönnemaaT, Keltikangas-JärvinenL, RäsänenL, et al. (2008) Cohort profile: the Cardiovascular Risk in Young Finns Study. Int J Epidemiol 37 : 1220–1226.
24. VartiainenE, LaatikainenT, PeltonenM, JuoleviA, MännistöS, et al. (2010) Thirty-five-year trends in cardiovascular risk factors in Finland. Int J Epidemiol 39 : 504–518.
25. AuroK, JoensuuA, FischerK, KettunenJ, SaloP, et al. (2014) A metabolic view on menopause and ageing. Nat Commun 5 : 4708.
26. WürtzP, MäkinenVP, SoininenP, KangasAJ, TukiainenT, et al. (2012) Metabolic signatures of insulin resistance in 7,098 young adults. Diabetes 61 : 1372–1380.
27. WürtzP, TiainenM, MäkinenVP, KangasAJ, SoininenP, et al. (2012) Circulating metabolite predictors of glycemia in middle-aged men and women. Diabetes Care 35 : 1749–1756.
28. SoininenP, KangasAJ, WürtzP, SunaT, Ala-KorpelaM (2014) Quantitative serum nuclear magnetic resonance metabolomics in cardiovascular epidemiology and genetics. Circ Cardiovasc Genet In press.
29. KettunenJ, TukiainenT, SarinAP, Ortega-AlonsoA, TikkanenE, et al. (2012) Genome-wide association study identifies multiple loci influencing human serum metabolite levels. Nat Genet 44 : 269–276.
30. KujalaUM, MäkinenVP, HeinonenI, SoininenP, KangasAJ, et al. (2013) Long-term leisure-time physical activity and serum metabolome. Circulation 127 : 340–348.
31. FischerK, KettunenJ, WürtzP, HallerT, HavulinnaAS, et al. (2014) Biomarker profiling by nuclear magnetic resonance spectroscopy for the prediction of all-cause mortality: an observational study of 17,345 persons. PLoS Med 1: e1001606.
32. SoininenP, KangasAJ, WürtzP, TukiainenT, TynkkynenT, et al. (2009) High-throughput serum NMR metabonomics for cost-effective holistic studies on systemic metabolism. Analyst 134 : 1781–1785.
33. InouyeM, KettunenJ, SoininenP, SilanderK, RipattiS, et al. (2010) Metabonomic, transcriptomic, and genomic variation of a population cohort. Mol Syst Biol 6 : 441.
34. SpeliotesEK, WillerCJ, BerndtSI, MondaKL, ThorleifssonG, et al. (2010) Association analyses of 249,796 individuals reveal 18 new loci associated with body mass index. Nat Genet 42 : 937–948.
35. VoightBF, KangHM, DingJ, PalmerCD, SidoreC, et al. (2012) The metabochip, a custom genotyping array for genetic studies of metabolic, cardiovascular, and anthropometric traits. PLoS Genet 8: e1002793.
36. RobertsLD, GersztenRE (2013) Towards novel biomarkers of cardiometabolic diseases. Cell Metab 18 : 43–50.
37. WangTJ, LarsonMG, VasanRS, ChengS, RheeEP, et al. (2011) Metabolite profiles and the risk of developing diabetes. Nat Med 17 : 448–453.
38. MagnussonM, LewisGD, EricsonU, Orho-MelanderM, HedbladB, et al. (2013) A diabetes-predictive amino acid score and future cardiovascular disease. Eur Heart J 34 : 1982–1989.
39. DesprésJP, LemieuxI (2006) Abdominal obesity and metabolic syndrome. Nature 444 : 881–887.
40. TimpsonNJ, NordestgaardBG, HarbordRM, ZachoJ, FraylingTM, et al. (2011) C-reactive protein levels and body mass index: elucidating direction of causation through reciprocal Mendelian randomization. Int J Obes (Lond) 35 : 300–308.
41. NordestgaardBG, PalmerTM, BennM, ZachoJ, Tybjaerg-HansenA, et al. (2012) The effect of elevated body mass index on ischemic heart disease risk: causal estimates from a Mendelian randomisation approach. PLoS Med 9: e1001212.
42. WilliamsPT, KraussRM, VranizanKM, WoodPD (1990) Changes in lipoprotein subfractions during diet-induced and exercise-induced weight loss in moderately overweight men. Circulation 81 : 1293–1304.
43. WeirJM, WongG, BarlowCK, GreeveMA, KowalczykA, et al. (2013) Plasma lipid profiling in a large population-based cohort. J Lipid Res 54 : 2898–2908.
44. FlegalKM, KitBK, OrpanaH, GraubardBI (2013) Association of all-cause mortality with overweight and obesity using standard body mass index categories: a systematic review and meta-analysis. JAMA 309 : 71–82.
45. Davey SmithG, SterneJA, FraserA, TyneliusP, LawlorDA, et al. (2009) The association between BMI and mortality using offspring BMI as an indicator of own BMI: large intergenerational mortality study. BMJ 339: b5043.
Štítky
Interní lékařstvíČlánek vyšel v časopise
PLOS Medicine
2014 Číslo 12
- Alternativní léčebné možnosti u hypercholesterolemie při intoleranci statinů
- Vliv kombinace nutraceutik na remodelaci levé komory srdeční u osob s metabolickým syndromem
- Nutraceutika a jejich ovlivnění mírného kardiometabolického rizika
- Princip účinku medu v léčbě chronických i infikovaných ran
- Superoxidovaný roztok a jeho využití v léčbě ran
Nejčtenější v tomto čísle
- Artemisinin-Naphthoquine versus Artemether-Lumefantrine for Uncomplicated Malaria in Papua New Guinean Children: An Open-Label Randomized Trial
- Home-Based Versus Mobile Clinic HIV Testing and Counseling in Rural Lesotho: A Cluster-Randomized Trial
- A Stronger Post-Publication Culture Is Needed for Better Science
- Metabolic Signatures of Adiposity in Young Adults: Mendelian Randomization Analysis and Effects of Weight Change