
Preformulation design of PLGA particulate system for multi-day drug delivery of the antidepressant mirtazapine
Preformulační design PLGA částicového systému pro vícedenní uvolňování antidepresiva mirtazapinu
V rámci této experimentální studie byly připraveny biodegradovatelné mikročástice (MČ) na bázi kopolymeru kyseliny mléčné a glykolové (PLGA) metodou odpaření rozpouštědla z jednoduché emulze o/v. Mikročástice obsahovaly nerozpustné antidepresivum mirtazapin. Příprava mikročástic zahrnovala formulační proměnné, a to obsah polymeru (700, 900 nebo 1200 mg), dichlormethanu (5 nebo 10 ml), a/nebo léčiva (200 nebo 400 nebo 600 mg) a objem vodné fáze emulze (400, 600 nebo 800 ml). U sledovaných parametrů byl pozorován vliv na velikost mikročástic a jejich morfologii, enkapsulační účinnost a disoluční chování. Všechny mikročástice byly úspěšně připraveny a jejich velikost se pohybovala v intervalu 165,34 ± 42,88 až 360,17 ± 121,59 μm. Mikročástice vykazovaly prodloužené uvolňování léčiva (v rámci dní), přičemž u některých z nich byl pozorován vícefázový charakter. Bylo zjištěno, že při použití vyššího počátečního množstvím PLGA byly připraveny větší MČ s delším lag time, a to až 34,3 hodin. Na druhé straně vyšší množství použitého léčiva vedlo ke zkrácení lag time. Snížení objemu vnější fáze a násobně vyšší množství dichlormethanu zpomalilo uvolňování mirtazapinu a snížilo enkapsulační účinnost. Výsledky byly dále potvrzeny vícerozměrnou analýzou dat.
Klíčová slova:
mirtazapin – mikročástice – PLGA – metoda odpaření rozpouštědla – vícerozměrná analýza dat
Authors:
Martina Holická; Jan Muselík; Martina Kejdušová; Miroslava Pavelková; Kateřina Kubová; Petr Doležel; David Vetchý; Vratislav Košťál; Jakub Vysloužil; Josef Mašek
Published in the journal:
Čes. slov. Farm., 2021; 70, 210-219
Category:
Původní práce
doi:
https://doi.org/https://doi.org/10.5817/CSF2021-6-210
Summary
In this experimental study, the biodegradable polylactide-co-glycolide (PLGA) microparticles (MP) loaded with the insoluble antidepressant mirtazapine were prepared by the simple o/w solvent evaporation method. The formation involved intrinsic variables, such as the content of polymer (700, 900 or 1200 mg), dichloromethane (5 or 10 ml) and/or drug (200 or 400 or 600 mg), and the volume of the aqueous emulsion phase (400, 600 or 800 ml). The influence of these parameters on the size and morphology of microparticles, encapsulation efficiency, and drug release behavior was observed. All MP were successfully prepared, and their size ranged between 165.34 ± 42.88 and 360.17 ± 121.59 μm. MP exhibited prolonged drug release (days), and some profiles had multiphasic character. It was found that the samples prepared with a higher initial amount of PLGA were bigger with prolonged lag time up to 34.3 hours. On the other hand, higher drug concentrations reduced the lag time. The external phase volume reduction and multiplication of dichloromethane amount prolonged the mirtazapine release and decreased the encapsulation efficiency. These observations were further confirmed by multivariate data analysis.
Keywords:
microparticles – mirtazapine – PLGA – solvent evaporation method – multivariate data analysis
Introduction
Mirtazapine (MZ) is the first clinically available representative of the noradrenergic and specific serotonergic antidepressant (NaSSA) group, which has predominantly been evaluated in the treatment of major depression and other psychiatric disorders1). It is also used as an anxiolytic, hypnotic, antiemetic, and appetite stimulant. It is classified as a tetracyclic antidepressant and has a dual-mode action2). The antidepressant properties of MZ are linked to the drug antagonist action at the α2 -adrenoceptor, 5-HT2 and 5-HT3 serotonergic receptors, and histamine (H1) receptor. Its affinity for H1 and 5-HT2 receptors likely explains its sedative effects and usefulness in depressive patients who also suffer from sleep problems. MZ possesses several beneficial pharmacokinetics, such as good absorption, linear pharmacokinetics over the recommended dosage range (15 to 80 mg/day), and an elimination half-life of 20 to 40 hours, thereby allowing administration once a day3). MZ is usually prescribed in dosages ranging from 15 mg to 45 mg and administered orally at bedtime4). The bioavailability of this drug is only 50%, mainly because of the intestinal wall and hepatic first-pass metabolism, which can be improved by altering the pharmacokinetic profile by controlling the drug release via a drug delivery system5). This approach can also reduce the antihistaminic side effects, like dry mouth, sedation, increases in appetite and body weight, by decreasing the dose used for the treatment2).
Biodegradable polymers are becoming more important for the development of sustained-release drug delivery systems and implantable biomaterials, such as poly(lactic acid), poly(glycolic acid), and their copolymers (PLGA), polycaprolactone, chitosan, gelatin, and albumin6). The approval history of PLGAbased drug products by worldwide regulatory agencies is a major reason for the preferential use of these biodegradable polymers over others7). PLGA is a well-known biocompatible aliphatic polyester. It is preferred for microsphere preparation partly because of its slow, reproducible degradation rate due to its versatility in the availability of different molar weights, lactic/glycolic acid ratio, and character of the end groups.
PLGA microspheres are usually prepared by a solvent evaporation method. Microencapsulation by this technique is widely used in pharmaceutical industries. It facilitates controlled drug release, which has many clinical benefits. However, formulation aspects of this technique remain poorly reported. To succeed in the controlled manufacturing of microspheres, it is essential to investigate the latter8). The aim of the study was to extend the previous article by Vysloužil et al.9) that examined the influence of formulation parameters on the characteristics of microparticles. Different formulation parameters were investigated in this work to develop and evaluate stable biodegradable PLGA microspheres, which can deliver MZ at a controlled rate for a sustained time. The results were also evaluated with factorial design analysis.
Experimental part
Materials
Mirtazapine – (Zentiva, Prague, Czech Republic) was used as the drug for encapsulation, PLGA Resomer® RG 504 H (Mw 38 000–54 000; Boehringer Ingelheim, Pharma GmbH & Co, Ingelheim am Rhein, Germany) was used as the polymer carrier. Dichloromethane (DM, Penta, Prague, Czech Republic) was used as the organic solvent, and polyvinyl alcohol – PVA (Mw 31 000–50 000; 98–99% hydrolyzed; Sigma Aldrich, St. Louis, MO) as the emulsifier. A buffer solution of pH 7.2 (sodium chloride, potassium chloride, calcium chloride, magnesium chloride, sodium hydrogen phosphate dodecahydrate, and potassium dihydrogen phosphate – all by Merck KGaA, Darmstadt, Germany) was used as the dissolution medium. All the materials were of Ph. Eur. Quality.
Methods
Microparticle preparation
MZ-loaded PLGA microparticles were prepared by the o/w solvent evaporation method. The emulsion’s oil (organic) phase was formed by adding 200 mg of the drug and 700 mg of the polymer in 5 ml of dichloromethane and left to stand for 10 minutes. The mixture was then homogenized (WiseTis® HG-1SD, Witeg Labortechnik GmbH, Germany) at 10 000 rpm for one minute to provide a complete dissolution of solid components, which tend to remain in the bottom layer. The resulting oil phase was then emulsified into 800 ml of 0.1% (w/w) PVA aqueous continuous phase. Afterwards, the emulsion was stirred with a mechanical stirrer (Heidolph RZR 2021, Sigma Aldrich, St. Louis, MO) at 600 rpm for one hour to evaporate most of the organic solvent. Solid microparticles were collected on a fine-mesh sieve with 80 μm openings, washed three times with purified water, part of the water was dried from the opposite side of the sieve. The particles were dried at 25 °C in a cabinet drier (HORO – 048B, Dr. Hofmann GmbH, Ostfildern, Germany) for 24 h before further testing. All samples were prepared in triplicate and marked according to the altered formulation parameters. The formulation variables are shown in Table 1. Sample A, prepared under the parameters originating from the previous study9), served as the reference, and it was used for the subsequent comparison of monitored formulation parameters in individual samples of microparticles.
Optical microscope analysis
Optical microscope analysis was used to obtain mean size data. Two hundred microparticles of each sample were measured by a NIKON SMZ 1500 stereomicroscope (Nikon, Tokyo, Japan) and a 72AUC02 USB camera (The Imaging Source, Bremen, Germany) in connection with the computer software NIS-Elements AR 4.0 (Nikon, Tokyo, Japan), which calculated the mean size values.
Scanning electron microscopy
Microparticle morphology and surface topography were analyzed using scanning electron microscopy (SEM). Samples were placed directly onto the SEM sample holder and fixed by a double-sided sticking tape. The thick layer of Au coat (10 nm) was then applied. The images were taken by a scanning electron microscope MIRA3 (Tescan, Brno, Czech Republic) at an accelerating voltage of 5.0 kV.
Drug content
Mirtazapine content was determined by UV/Vis spectroscopy. Five milligrams of dried microparticles were dissolved in 25 ml of dichloromethane. Absorbance was measured at 295 nm using a UV/Vis spectrometer (Lambda 25, Perkin Elmer, Waltham, MA). Encapsulation efficiency (EE) and drug loading (DL) were calculated from the obtained values using the following equations10, 11).

where mMZs corresponds with the total MZ amount in a sample (mg; determined via UV/Vis spectroscopy), and mMZt stands for the drug weight used for the sample preparation (mg). The assay was carried out in triplicate, and the calculated results were expressed as mean values with standard deviations (SD).

where mMZs once again corresponds with the total MZ amount in the sample and mS is the gross weight of the sample (mg). The assay was carried out in triplicate. Results are expressed as mean values and SD. The effectiveness of the process was also evaluated by the yield, which was calculated by the following equation12).

where ms stands for the gross mass of microparticles and mt represents the total mass of the mirtazapine and PLGA used for the microparticle preparation. Experiments were carried out in triplicate.
In vitro release studies
A Sotax dissolution device with USP Dissolution Apparatus 1 settings (SOTAX AT 7 On-Line System, Donau Lab, Switzerland) was employed at 100 rpm to evaluate drug release from PLGA microparticles. Baskets were custommade and had a double wall with a very fine mesh to prevent microparticle dropout. Vessels were filled with 1000 ml of phosphate buffer with pH 7.2 and kept at 37.0 ± 0.5 °C. Therefore, the pH value of 7.2 was chosen to emulate conditions for parenteral administration. The microparticles for the dissolution test were weighted with respect to their actual MZ content. At specific time intervals (15, 30, 60, 120 min. and subsequently every two hours during the 72-hour dissolution test), the samples were withdrawn for analysis using a UV spectrophotometer (Lambda 25, Perkin Elmer, USA) at 295 nm. The dissolution test was carried out with six samples of each batch, and the results were expressed as average values and SD. The lag time and mean dissolution time t15%, representing the time in which 15 % of the drug is released, were calculated. This MZ amount was achieved for all tested samples; therefore, the parameter t15% could be used for comparing the microparticles dissolution profiles. To propose the drug release mechanism from matrix beads, the experimental data were treated according to the following equations14):

where Mt is the amount of drug released at time t; M∞ is the absolute cumulative amount of drug released at infinitive time; K0 , K1 , KH, KBL are the zero order, first order, Higuchi, Baker-Lonsdale, and release constants, respectively, and KKP is the release constant comprising the structural and geometrical characteristics. Release exponent n characterizes the mechanism of drug release, specifically n = 0.5 corresponds to a Fickian diffusion release, 0.5 < n < 1.0 to an anomalous transport, n = 1.0 to a zero-order release kinetics, and n > 1.0 to a super Case II transport14, 15).
Regarding the inconstant variance of some measured data, the weighted least squares method was applied to the dissolution data. The release constant average value of each model with confidential regions (CR) (at the significant level p ≤ 0.05) and determination coefficient R2 of regression analysis were calculated. Observing that R2 is only an orientation measure for the regression function suitability, the autocorrelation test of residua deviations (Durbin-Watson test) was determined. Regression diagnostics were calculated using the QC.Expert™ 2.5 software.
Similarity factor f2 compares the dissolution profiles of a pair of drug products using the dissolution data in their native form16). Similarity factor values range between 0 and 100. If f2 ≥ 50, drug release profiles are over 90% similar. If f2 < 50, release profiles are not similar, and the observed influence of the formulation or process variables is considered significant17). The similarity factor values f2 were calculated using equation [9]14):

where Ri and Ti is the amount of the drug in the reference (R) and tested (T) samples (in percent) released at the given time interval, and n means the number of samplings.
Nowadays, similarity factor, along with difference factor, is approved analytic tool for dissolution profiles comparison which is also part of authorities guidelines. In the pharmacopoeial sections it is mainly used for the products comaprison.
Data analysis
Data analysis was performed using the Principal Component Analysis (Unscrambler X, v 1.3, Camo software) in order to describe variability in the data, relationships among measured parameters (EE (%), DL (%), T lag (h), k R2 for zero-order, mean size (as Ekv. Ratio)) and objects, and to detect outliers. Before the modeling, the data were adjusted by autoscaling.
Results and discussion
Particle size and morphological properties
The size of prepared mirtazapine-loaded microparticles ranged from 165.34 to 360.17 μm (Table 2). Bigger particles were obtained within the samples with higher polymer amounts (B-PLGA900 and C-PLGA1200). This finding can be explained by the literature data saying that a higher PLGA amount is responsible for increased viscosity and surface tension of the oil phase leading to a bigger microparticles size18). In contrast, the sample F-DM10 showed a significantly smaller particle size than the other formulations – 165.34 μm. A higher amount of dichloromethane in the internal phase has a significant effect on the size of the microspheres. While a low volume of the internal phase yields a viscous and concentrated polymer solution, a higher amount of the solvent decreases the viscosity so that the polymer solution is broken into smaller particles during the emulsification more easily19).
The morphology of the prepared particles can be observed in Figs. 1 and 2. The images clearly show that the increase of PLGA amount up to 1200 mg fundamentally affected the spherical nature of the microparticles, which have been deformed in shape (Fig. 1c)20). When using the higher drug amount during the formulation (sample E-M600, Fig. 1e), it did not change the spherical shape of the microparticles, but the surface was smoother and exhibited a smaller number of pores. Additionally, the surface of microspheres was also smoother at higher ratios CP/ DP (continual phase/dispersed phase), probably due to a faster solidification rate. CP containing a large amount of water probably resulted in more rapid polymer precipitation due to the larger evaporation interface area, and therefore less porous spheres were formed21).


Encapsulation process
Table 2 presents encapsulation efficiency, drug loading, and yield results. EE was in the range of 17.17–51.07%. The change of the phase volume in the emulsion system significantly influenced EE. Multiplication of the organic solvent amount caused a decrease in EE of the sample F-DM10 up to 17.17%. The viscosity decrease resulted in faster drug leakage22). Also, a decrease in the external aqueous phase volume (G-PVA600 and H-PVA400) caused a reduction of EE to 41.88% or 27.79%, respectively. Due to the decline of the continuous phase volume, the concentration gradient between the phases was reduced. It has led to a slower microparticle formation and lower EE21). An increase in the PLGA concentration (samples B-PLGA900 and C-PLGA1200) led to lower EE (46.15% and 32.99%). According to some studies, EE should be higher when using higher polymer concentration in the dispersed phase23, 24). It also relates to the increased viscosity of the phase and faster creation of microparticles25). In this work, however, using a higher amount of PLGA decreased EE, which the loss rates of the procedure might cause since some portion of the polymer adhered to the mechanical stirrer’s shaft during the solvent evaporation process higher viscosity of the oil phase.
An increase in the MZ amount slightly reduced EE (samples D-M400 and E-M600) to 44.56% and 42.52%, respectively. A higher loading provided a higher MZ concentration in the emulsion droplets. This increase in the MZ concentration gradient between the emulsion droplets and the continuous water phase increased the amount of MZ slowly dissolving into the continuous water phase during the preparation19).
Drug release
MZ is practically insoluble (< 0.05 mg . mL−1) in water13), and for this reason, a long-term sustained release was expected. Figs. 3, 4, 5, and 6 show in vitro dissolution profiles of the prepared PLGA microparticles. Table 2 presents lag time and parameter t15% and Table 3 similarity factor analysis.
Effect of PLGA content – Polymer concentration is a crucial factor influencing the characteristics and release profiles of microspheres. The dissolution curves of microspheres prepared with a higher amount of PLGA (samples B-PLGA900 and C-PLGA1200) were characterized by a relatively long lag time (30–40 hours) and a slower release of the active substance, t15% for the sample B-PLGA900 reached 815 minutes and for the sample C-PLGA1200 1940 minutes. Increased PLGA content in the formulation results in bigger microparticles and smaller overall surface area, slowing down the MZ release26, 27). The obvious difference was also confirmed by the similarity factor f2 analysis (see Table 3).


Effect of mirtazapine content – The release profiles were related to the degree of actual MZ loading in the prepared microparticles. In samples D-M400 and E-M600, in which higher concentrations of MZ were used in microparticles preparation, there was a significant reduction in lag time. For D-M400 and E-M600, lag times took only 30 and 15 minutes, respectively. A significant reduction of lag time in the sample E-M600 could be explained by the drug’s presence at the microspheres’ surface regions due to its abundance during preparation, which resulted in a rapid initial release of MZ28). This fact is described by the image from a stereoscopic microscope of the sample E-M600 (Fig. 2b) with visible turbid microparticles. This turbidity could be caused by a higher drug content. Sample A exhibited a much longer lag time (1210 min); therefore, the drug release is significantly different in comparison with the sample D-M400, despite the similar release behavior of these two samples (f2 = 60.70) when the lag time of sample A was not reflected in the calculation. A further increase in the drug content significantly affects the dissolution profile evident from f2 similarity factor analysis (A x E-M600 = 44.39). Dissolution curves of samples E-M600 and D-M400 were found to be similar (f2 = 57.73).
Effect of the volume of both emulsion phases – Reducing the volume of the external aqueous phase (samples G-PVA600 and H-PVA400) to 600 ml, or 400 ml, respectively, resulted in a slower drug release and a longer lag time in comparison with the reference sample A. Explanation can be seen that decreased volume of the external phase resulted in bigger microparticles with a smaller surface (Table 2) and thus slower drug release27). Dissolution curves of both samples have almost the same course. Similarity factor f2 analysis calculated between the samples revealed the significance of the external volume effect on the dissolution profiles (A x G-PVA600 = 34.02 and A x H-PVA400 = 34.47). Further reduction of the external phase did not show a substantial difference in the drug release rate; parameter t15% took value 790 min for the sample G-PVA600 and 820 min for the sample H-PVA400. This finding was also confirmed by the similarity factor (G-PVA600 x H-PVA400 = 79.60).
Increased volume of dichloromethane in the internal phase (sample F-DM10) caused slower drug release even though smaller particles with larger surfaces were prepared. However, the EE was the lowest; therefore, there was a low amount of drug to exploit the most extensive surface. The curve was characterized by a relatively high lag time value (36 hours) and showed a biphasic drug release. After 72 hours, it had released only 42.64% of MZ.
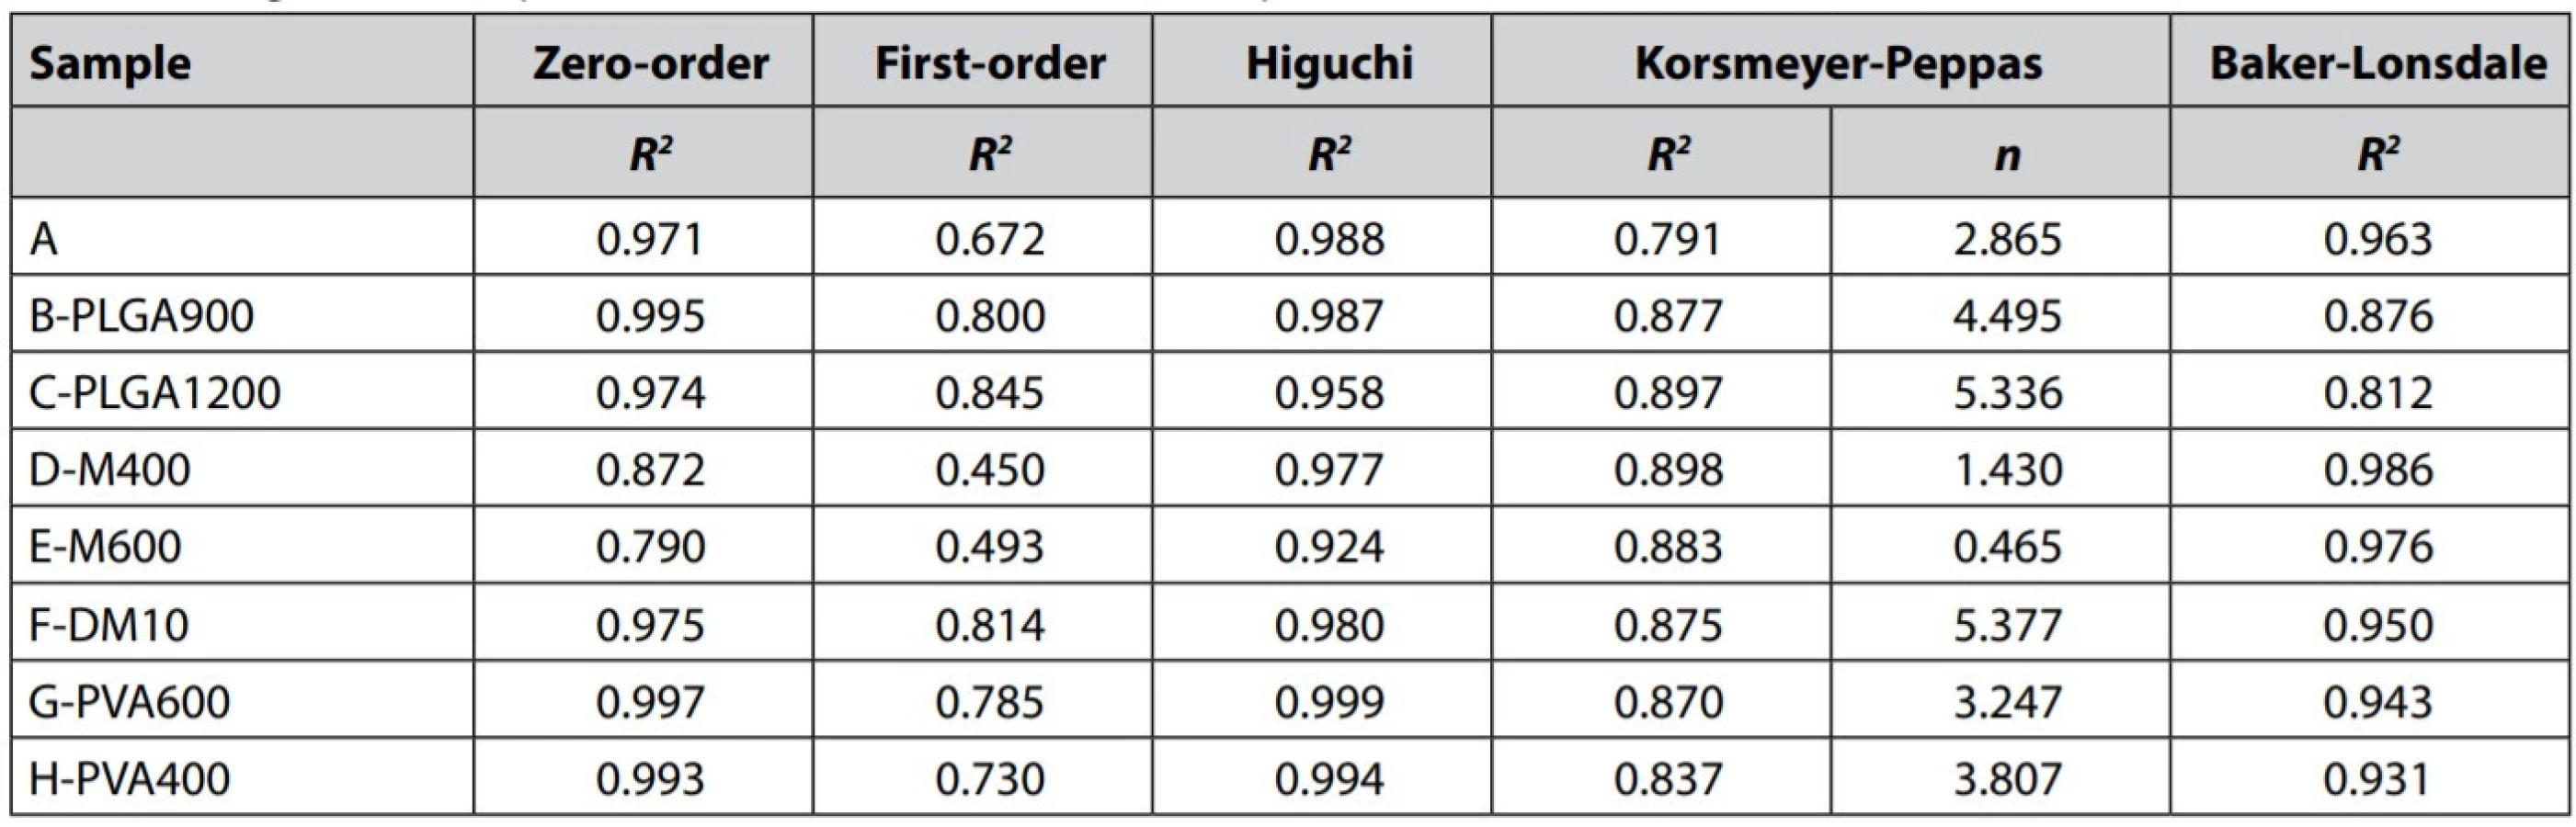


The data were examined according to the kinetic model’s Equations [4] – [8] to understand the MZ release mechanism and determine approximate kinetics. The determination coefficients R2 and release exponent n for the Korsmeyer-Peppas model are shown in Table 4. The dissolution data poorly correlated with the firstorder kinetic model (R2= 0.845). Better fitting was found for the zero-order kinetic model (R2 ≥ 0.971), except for the samples D-M400 and E-M600 (R2 = 0.790–0.872), probably due to their significant bi-phasic drug release manner. As the results suggest, in overall, the MZ release from PLGA microparticles is close to desired zero-order kinetics, which can be demonstrated in Figs. 3, 5, and 6. Participation of MZ diffusion from PLGA matrix microparticles can be predicted from a solid correlation with the Higuchi model (R2 ≥ 0.924) and R2 value of some samples for the Baker-Lonsdale model, which is better suited to evaluate diffusion from spheres. According to the literature, the drug release from PLGA microparticles combines both diffusion and erosion processes29). Unfortunately, the erosion participation could not be confirmed due to the dissolution data’s low correlation (R2 ≤ 0.898) with the Korsmeyer-Peppas model.
Principal Component Analysis (PCA) was used to study relationships between the monitored parameters (EE (%), DL (%), lag time (h), R2 for the zero-order kinetic model, and mean size) and association with the formulation parameters. The sample F-DM10 differed considerably in the values of the monitored parameters without a clear common trend and thus behaved as an outlier in the multidimensional set. Therefore, it was not included in the evaluation. The amount of variability explained by the first two principal components was high enough since it described 89% of variability30). Variability of PC-1 is associated with the MZ content, which is evident from the component score plot (Fig. 8), and it is explained by DL (%), lag time (h), R2 for the zero-order kinetic model, and mean size, which is evident from the correlation loading plot (Fig. 7). Variability of PC-2 component is associated with overall PLGA content, and it is explained by the EE. Mean size is positively correlated with lag time, and both these variables are negatively correlated with DL and R2 for the zero-order kinetic model. There is an apparent trend based on the MZ content. When MZ content increases, mean size and the lag time decreases; meanwhile, DL and R2 for the zero-order kinetic model increase (D-M400 0.872 a E-M600 0.790). It also means that the smallest particles have a shorter lag time and a quicker drug release, mainly influenced by MZ content (Figs. 7, 8). Variability along PC-2 is associated with the overall PLGA content, where the samples with the lowest PLGA weight exhibited the highest EE and vice versa. As discussed before, this observation is not consistent with the literature; however, since the DM amount remained the same in these particular samples, the increasing viscosity of the oil phase could very easily increase losses by material sticking/clinging to the shaft and beakers, resulting in the lower EE.
Conclusion
PLGA microparticles with mirtazapine were successfully prepared by the solvent evaporation technique. The influence of different parameters was assessed by factorial design analysis, which proved to be a valuable tool for pre-formulation experiments, and many interesting phenomena were shown. The aqueous phase volume and polymer amount, as well as the drug weight, significantly affected the dissolution profile and mirtazapine release rate. Different amounts of PLGA or dichloromethane in the oil phase remarkably influenced the microparticles size. The prolonged drug release profiles with a pronounced lag time reported in the previous study were conclusively confirmed. After a size decrease, the particles could represent a promising approach for assessing mirtazapine adverse effects evaluation in animal models.
Conflict of interest: none.
Acknowledgment
This research was supported by Masaryk University (Project MUNI/A/1574/2020) and the Ministry of Education, Youth and Sports of the Czech Republic (Project CZ.02.1.01/0.0/0.0/15_003/0000495).
M. Holická, J. Muselík, M. Kejdušová, M. Pavelková, K. Kubová, P. Doležel, D. Vetchý, PharmDr. Jakub Vysloužil, Ph.D.
Masaryk University, Faculty of Pharmacy
Department of Pharmaceutical Technology
Palackého 1, 612 00 Brno, Czech Republic
e-mail: vyslouzilj@pharm.muni.cz
V. Košťál
Tescan Orsay, Brno, Czech Republic
J. Mašek
Veterinary Research Institute
Department of Pharmacology and Toxicology, Brno, Czech Republic
Zdroje
- Okubo M., Murayama N., Miura J., Chiba Y., Yamazaki H. Effects of cytochrome P450 2D6 and 3A5 genotypes and possible coadministered medicines on the metabolic clearance of antidepressant mirtazapine in Japanese patients. Biochem. Pharmacol. 2015; 93, 104–109.
- Anttila S. A., Leinonen E. V. A review of the pharmacological and clinical profile of mirtazapine. CNS Drug Rev. 2001; 7, 249–264.
- Kasper S., Praschak-Rieder N., Tauscher J., Wolf R. A risk-benefit assessment of mirtazapine in the treatment of depression. Drug Saf. 1997; 17, 251–264.
- Verster J. C., van de Loo A. J. A. E., Roth T. Mirtazapine as positive control drug in studies examining the effects of antidepressants on driving ability. Eur. J. Pharmacol. 2015; 753, 252–256.
- Timmer C. J., Sitsen J. M., Delbressine L. P. Clinical pharmacokinetics of mirtazapine. Clin. Pharmacokinet. 2000; 38, 461–474.
- Ranjan O. P., Shavi G. V., Nayak U. Y., Arumugam K., Averineni R. K., Meka S. R., Sureshwar P. Controlled release chitosan microspheres of mirtazapine: In vitro and in vivo evaluation. Arch. Pharm. Res. 2011; 34, 1919–1929.
- Sah H., Thoma L. A., Desu H. R., Sah E., Wood G. C. Concepts and practices used to develop functional PLGA-based nanoparticulate systems. Int. J. Nanomed. 2013; 8, 747–765.
- Li M., Rouaud O., Poncelet D. Microencapsulation by solvent evaporation: state of the art for process engineering approaches. Int. J.Pharm. 2008; 3, 26–39.
- Vysloužil J., Doležel P., Kejdušová M., Košťál V., Beneš L., Dvořáčková K. Long-term controlled release of PLGA microparticles containing antidepressant mirtazapine. Pharm. Dev. Tech. 2016; 21, 214–221.
- Paskaris G., Bouropoulos N. Swelling studies and in vitro release of verapamil from calcium alginate and calcium alginate-chitosan beads. Int. J. Pharm. 2006; 323, 34–42.
- Wang S. B., Chen A. Z., Weng L. J., Chen M. Y., Xie X. L. Effect of drug-loading methods on drug load, encapsulation efficiency and release properties of alginate/poly-L arginine/chitosan ternary complex microcapsules. Macromol. Biosc. 2004; 4, 27–30.
- Song M., Li N., Sun S., Tiedt L. R., Liebenberg W., de Villiers M. M. Effect of viscosity and concentration of wall former, emulsifier and pore-inducer on the properties of amoxicillin microcapsules prepared by emulsion solvent evaporation. Il. Farmaco 2005; 60, 261–267.
- Sarkar A., Rohani S. Molecular salts and co-crystals of mirtazapine with promising physicochemical properties J. Pharm. Biomed. Anal. 2015; 110, 93–99.
- Costa P., Lobo J. M. S. Modeling and comparison of dissolution profiles. Eur. J. Pharm. Sci. 2001; 13, 123–133.
- Samani M. S., Montaseri H., Kazemi A. The effect of polymer blends on release profiles of diclofenac sodium from matrices. Eur. J. Pharm. Biopharm. 2003; 55, 351 – 355.
- Ocaña J., Frutos G., Sánchez O. P. Using the similarity factor f2 in practice: A critical revision and suggestions for its standard error estimation. Chemom. Intell. Lab. Syst. 2009; 99, 49–56.
- Vetchý D., Kopecká M., Vetchá M., Franc A. Modely in vitro – in vivo ve vývoji léčiv. Chem. Listy 2014; 108, 32–39.
- Feczkó T., Tóth J., Dósa G., Gyenis J. Influence of process conditions on the mean size of PLGA nanoparticles. Chem. Eng. Process. 2011; 50, 846–853.
- Yang Y. Y., Chung T. S., Ng N. P. Morphology, drug distribution, and in vitro release profiles of biodegradable polymeric microspheres containing protein fabricated by double-emulsion solvent extraction/evaporation method. Biomaterials 2001; 22, 231–241.
- Heslinga M. J., Mastria E. M., Eniola-Adefeso O. Fabrication of biodegradable spheroidal microparticles for drug delivery applications. J. Control. Rel. 2009; 138, 235–242.
- Mao S., Shi Y., Li L., Xu J., Schaper A., Kissel T. Effects of Process and Formulation Parameters on Characteristics and Internal Morphology of Poly(D, L-lactide-co-glycolide) Microspheres Formed by the Solvent Evaporation Method. Eur. J. Pharm. Biopharm. 2008; 68, 214–223.
- Choi H. S., Seo S-A., Khang G., Rhee J. M., Lee H. B. Preparation and characterization of fentanyl-loaded PLGA microspheres: in vitro release profiles. Int. J. Pharm. 2002; 234, 195–203.
- Yeo Y., Park K. control of encapsulation efficiency and initial burst in polymeric microparticle systems. Arch. Pharm. Res. 2004; 27, 1–12.
- Doan T. V. P., Couet W., Olivier J. C. Formulation and in vitro characterization of inhalable rifampicin-loaded PLGA microspheres for sustained lung delivery. Int. J. Pharm. 2011; 414, 112–117.
- André-Abrant A., Taverdet J. L., Jay J. microencapsulation par évaporation de solvant. Eur. Polym. J. 2001; 37, 955–967.
- Klose D., Siepmann F., Elkharraz K., Krenzlin S., Siepmann J. How porosity and size affect the drug release mechanisms from PLGA-based microparticles. Int. J. Pharm. 2006; 314, 198–206.
- Yang Y. Y., Chung T. S., Bai X. L., Chan W. K. Effect of preparation conditions on morphology and release profiles of biodegradable polymeric microspheres containing protein fabricated by double-emulsion method. Chem. Eng. Sci. 2000; 55, 2223–2236.
- O’Donnell P. B., McGinity J. W., Zhu K. J., Liu J. H., Hao Y. L. Influence of processing on the stability and release properties of biodegradable microspheres containing thioridazine hydrochloride. Eur. J. Pharm. Biopharm. 1998; 45, 83–94.
- Fredenberg S., Wahlgren M., Reslow M., Axelsson A. The mechanisms of drug release in poly(lactic-co-glycolic acid)-based drug delivery systems – a review. Int. J. Pharm. 2011; 415, 34–52.
- Reimann C., Filzmoser P., Garret R. G., Dutter R. Statistical data analysis explained: applied environmental statistics with R. Chichester: John Wiley & Sons 2008.
Štítky
Farmacie FarmakologieČlánek vyšel v časopise
Česká a slovenská farmacie

2021 Číslo 6
- Aceklofenak v léčbě muskuloskeletálních onemocnění – srovnání s dalšími NSAIDs z hlediska účinnosti a bezpečnosti
- Využití diklofenaku ve formě gelu v terapii seboroické keratózy
- Budoucnost guaifenesinu jako OTC myorelaxans
Nejčtenější v tomto čísle
- Supply of medicines in the Terezín ghetto
- Antibiotics and the quality indicators for outpatient antibiotic use in Slovakia
- XLII. pracovní den Radiofarmaceutické sekce ČSNM
- Preformulation design of PLGA particulate system for multi-day drug delivery of the antidepressant mirtazapine