
Pseudoautosomal Region 1 Length Polymorphism in the Human Population
The human sex chromosomes differ in sequence, except for homologous sequences at both ends, termed the pseudoautosomal regions (PAR1 and PAR2). PAR enables the pairing of chromosomes Y and X during meiosis. The PARs are located at the termini of respectively the short and long arms of chromosomes X and Y. The observation of gradual shortening of the Y chromosome over evolutionary time has led to speculations that the Y chromosome is “doomed to extinction.” However, the Y chromosome has been shaped over evolution not only by the loss of genes, but also by addition of genes as a result of interchromosomal exchanges. In this work, we identified males with a duplication on chromosome Xp22.33 of about 136 kb as an incidental finding during a copy number variation screen. We demonstrate that the duplicon is an insertional translocation due to non-allelic homologous recombination from the X to the Y chromosome that is flanked by a long terminal repeat (LTR6B). We show this translocation event has occurred independently multiple times and that the duplicated region recombines with the X chromosome. Therefore, the duplicated region represents an extension of the pseudoautosomal region, representing a novel mechanism shaping sex chromosomal evolution in humans.
Published in the journal:
. PLoS Genet 10(11): e32767. doi:10.1371/journal.pgen.1004578
Category:
Research Article
doi:
https://doi.org/10.1371/journal.pgen.1004578
Summary
The human sex chromosomes differ in sequence, except for homologous sequences at both ends, termed the pseudoautosomal regions (PAR1 and PAR2). PAR enables the pairing of chromosomes Y and X during meiosis. The PARs are located at the termini of respectively the short and long arms of chromosomes X and Y. The observation of gradual shortening of the Y chromosome over evolutionary time has led to speculations that the Y chromosome is “doomed to extinction.” However, the Y chromosome has been shaped over evolution not only by the loss of genes, but also by addition of genes as a result of interchromosomal exchanges. In this work, we identified males with a duplication on chromosome Xp22.33 of about 136 kb as an incidental finding during a copy number variation screen. We demonstrate that the duplicon is an insertional translocation due to non-allelic homologous recombination from the X to the Y chromosome that is flanked by a long terminal repeat (LTR6B). We show this translocation event has occurred independently multiple times and that the duplicated region recombines with the X chromosome. Therefore, the duplicated region represents an extension of the pseudoautosomal region, representing a novel mechanism shaping sex chromosomal evolution in humans.
Introduction
The human sex chromosomes originate from an ancestral homologous chromosome pair. During mammalian evolution, these chromosomes lost homology due to progressive degradation of the Y chromosome. The decay of the Y chromosome started with the introduction of sex determination factors, which initiated subsequent cycles of suppressed recombination [1]. Two main mechanisms are usually invoked to explain the reduction of XY homology. Reduced recombination rates near the pseudoautosomal boundary (PAB) would result in an accumulation of mutations which ultimately result in the inability to recombine [2]. Suppressed recombination led to the gradual decline in recombination. In addition, a stepwise reduction of recombination has been observed in the mammalian Y chromosome. Based on the nucleotide divergence between the human X and Y chromosome, nine different regions, termed strata, can be distinguished [3], [4]. It has been speculated that chromosomal rearrangements, such as inversions, might explain the stepwise decrease in sequence similarity between genes ordered on the human X chromosome and their homologs (called “gametologs”) on the Y chromosome [3]. Nevertheless, comparative genomic analysis has failed to identify such inversions [5], [6]. Hence, the forces driving recombination suppression remain to be established.
The observation of a gradual demise of the Y chromosome has lead to speculations that, from an evolutionary perspective, the Y chromosome is doomed to extinction [7], [8]. In contrast, recent evidence suggests that gene loss has been limited over the past 25 million years [9]. However, the Y chromosome is not only shaped by loss of genes and gene functions, but also by addition of genes as a result of interchromosomal exchanges. An autosome to gonosome translocation occurred after the divergence of the placental mammals from marsupials, increasing the size of the eutherian gonosomes [10]. Similarly, chromosomal regions known to be autosomal in different mammals seem to have translocated to the subtelomeric region of the long arm of the X chromosome during great ape evolution and subsequently to both the X and Y chromosome subtelomeres during hominid evolution [11], [12]. There remain two regions of homology: the 2.7 Mb pseudoautosomal region 1 (PAR1) at the telomeres of the short arms and the 0.3 Mb human specific PAR2 at the termini of the long arms [2], [13]. These XY homologous regions are required for pairing and synapse formation resulting in the obligate cross-over which is required for proper chromosome segregation during mammalian meiosis. Although often perceived as stable, it is well known that genes in the human PAR1 show elevated divergence with their primate orthologs and high levels of structural polymorphism. [14]–[17].
Relative to other mammalian species with a characterized PAR, the human PAB (i.e. PAB1; the human specific PAR2 has no counterpart in other genomes) is positioned distally. The PAB maps within the gene coding for one of the XG blood group antigens [18], [19]. XG is disrupted on the Y chromosome, and thus lacks nine exons on its 3′ end. The PAB was probably created by the intrachromosomal transposition of a chromosome fragment including the sex-determining region Y (SRY) gene [20]. Over time the PAB has shifted about 240 bp into the PAR by attrition, accounting for the fact that the PAR is flanked by a 240 bp segment of reduced homology (∼77%) on its proximal side [21]. An Alu element is located at the human PAB, but this is believed to have inserted after the divergence of old world monkeys and great apes and therefore did not create the PAB [22]. Hence, the PAB has remained stable since the divergence of the great apes and is considered stable in the Catarrhini lineage [1], [22]. Here we demonstrate that a previously undiscovered PAR1 length polymorphism exists in the human population as a result of recent recurrent chromosomal rearrangements that shifts the PAB by 110 kb towards the centromere.
Results
Segmental X Chromosomal Duplication Inserted in Y
To identify pathogenic copy number variants in patients with developmental disorders, we screened ∼4300 individuals (∼60% male) by microarrays. This screening identified 15 male patients of mainly Belgian origin carrying a duplication with a minimum size of 98,630 bp and of maximum 136,609 bp on Xp22.33 (Figure 1 A). To determine whether the duplication occurred de novo or was inherited, arrays were performed on both parents in all 6 families for which parental blood samples could be obtained. We had assumed that the duplicon would have arisen de novo or would be inherited from the mother, since males inherit their X chromosome from the mother. However, the duplication was paternally inherited in all families.

Based on the paternal inheritance, we hypothesized the duplicon resided on the Y chromosome. To test this hypothesis and to determine the location of the duplicon, we performed FISH on metaphases from one index, his father, and a male control using probes to target PAR1 and the duplicated region. We observed PAR1 signals on both X and Y chromosomes in all samples (Figure 1 C). The duplicated region was found on the X chromosome in the index, father, and control, but was also found on the Y chromosome of the index and father (Figure 1 C). The FISH analysis demonstrates that the X duplicon is actually located on the Y chromosome at or near the short arm pseudoautosomal region.
Since the duplicated region appeared to be adjacent to the X-linked PAR1, we reasoned that the Y chromosome copy would also be adjacent to the Y-linked PAR1. If so, the regular Y-PAR1 boundary would be disrupted in carriers and a PCR spanning the Y-PAR1 boundary should result in an amplification product in controls, but not in duplication carriers (Figure S1). As expected, the Y-PAR1 boundary specific PCR resulted in an amplification product in normal males, but not in females. In contrast to our hypothesis, the same amplicon was observed in carrier males (Figure S1.). Hence, the duplicon is not a mere extension of Y-PAR1.
To elucidate the exact location of the duplicon on the Y chromosome we performed targeted capture using a BAC spanning the duplicon as a bait, followed by Illumina sequencing for patient P1. The capture resulted in a 1228.4 fold enrichment of the insert region and generated on average 348,529 reads over the bait. Since the BAC spans the duplicon, it was expected that some paired-ends would map back to different locations in the Y chromosome reference sequence, and that some reads would feature split sequences. Unexpectedly, no chimeric pairs or split reads could be detected.
Upon closer scrutiny of the aligned reads, the PAB region featured three different types of reads: reference Y-PAB reads, reference X-PAB reads, and SNP containing X-PAB reads. The PAB also showed three stretches of heterozygous SNPs: a 33% allele frequency region flanked by two 50% allele frequency regions (Figure 1 D). Since males should have no heterozygous SNPs in their hemizygous X-specific sequences and pseudoautosomal SNPs should show allele ratios of 50% we hypothesized that one portion of the pseudoautosomal region was duplicated. Indeed, the 33% allele frequency region and the proximal 50% allele frequency region represent a duplication event while the distal 50% allele frequency region represents the normal pseudoautosomal SNPs. The breakpoint was delineated by selecting the most proximal (chrX:2,694,303) SNP with an allele frequency of 50% and the most distal (chrX:2,694,429) SNP with an allele frequency of 30%. Interestingly, those SNPs both lie in a long terminal repeat, LTR6B, chrX:2,694,151-2,694,702 (551bp). The most proximal 50% allele frequency SNP was also near a second LTR6B repeat, chrX:2,808,549-2,809,097 (548 bp). These repeats explain that more than 99% of the reads mapping around the SNP frequency changes feature a mapping quality of 0, an indication of reads that map to multiple locations. The presence of these repeats at both sides of the duplicon also explain the absence of chimeric pairs and split reads. The duplicon thus comprises 110 kb of X-specific sequences as well as 5 kb proximal PAR1, resulting in the construct illustrated in Figure 2 A. The 5 kb sequence is present as three copies in the patient (once on his normal X chromosome and twice on his Y chromosome with the X insertion), which explains the 33% SNP ratio profile as well as the presence of three different kinds of reads at the PAB.

To verify the boundary was at the LTR6B in the index patients and their fathers, PCR was performed using one primer located in the distal PAR1 and another located in the X-specific region distal to the duplicon boundary and predicted to span the LTR6B (Figure 2 A, green primers). Not only are these primers separated by 115 kb in the reference genome, but they also have opposite orientations. As expected, the PCR generated an amplicon in carrier males, but not in male or female controls (Figure 2 B). To confirm the presence of the LTR6B in the amplicon, the PCR products were Sanger sequenced, confirming they contained respectively a PAR1 specific fragment, LTR6B, and an X specific sequence (Figure 2 C). These results demonstrate that the duplicon is an insertional translocation from X to Y that is flanked by LTR6B.
A Reciprocal Deletion
During the initial screening for pathogenic copy number variants we also identified a patient carrying a reciprocal deletion (Figure 3 A). Familial analysis showed both the female index as well as the father and sister to be carriers. We hypothesized the deletion to be reciprocal to the duplication and to have occurred by non-allelic homologous recombination (NAHR) between the LTR6Bs, thus comprising chrX:2694151-2808549 (i.e. from one to the other LTR6B). To confirm this hypothesis we designed a PCR using one primer distal and one proximal of this range. The primer sites are 115 kb apart so the PCR should fail in any individual except those featuring a deletion between them. As expected, the PCR generated an amplicon in the three carriers, but not in male or female controls (Figure 3 B). Therefore, we concluded that the deletion corresponds to the duplication described above. This was verified by Sanger sequencing the index carriers amplicon. The sequence showed an LTR6B featuring an X-specific profile at the region-specific LTR6B positions 2, 10, and 15, and a PAR1-specific profile at positions 3 to 9 and 11 to 14. Position 1 was not sequenced (Figure 3 C). A G was sequenced at rs2534626/2316283. We considered this confirmation that a deletion of chrX:2694151-2808549 results in a merged LTR6B.

The Insertional Translocation Occurs Recurrently
The Y-PAR1 extension observed in the different families could have arisen as a single ancient insertional translocation event or might have occurred recurrently. The finding of a reciprocal deletion supports the latter, but to provide additional evidence the relatedness of the Y chromosomes containing the Y-PAR1 extension was determined by chromosome Y SNP/STR typing. All six father Y haplotypes were identical to their index sons. The carriers featured two main Y-chromosomal haplogroups: all 20 carriers of Belgian origin featured haplogroup I (sub-haplogroup I2a*; I-P37.2*) and the two French carriers featured haplogroup R (sub-haplogroup R1b1b2a1a2*; R-P312*)(Figure S2). A comparative Y-STR network analysis with other autochthonously Belgian I2 (I-P215) samples revealed that all but one of the I2a* haplotypes displaying an elongated PAR1 belonged to two closely related clusters (Figure 4). While these two clusters were related to the other I2a* samples earlier observed in the Belgian population the highly distinct I2a*-haplotype appeared to be more closely related to haplogroup I2b1* (I-M223*). Within each of the two clusters of I2a* haplotypes a high paternal kinship was observed as most of their haplotypes differed from each other in less than eight Y-STR loci. According to the mutation rates measured by Ballantyne et al. [23] and the formulae of Walsh [24] the latest common patrilineal ancestors of the largest cluster lived between 7 and 33 generations ago (95% credibility interval), i.e. between 1185 and 1835 (generation span of 25 years) or 855 and 1765 (generation span of 35 years). To determine whether more individuals with the Y-chromosomal sub-haplogroup I2a* carry the described duplicon, we analyzed two additional sub-haplogroup I2a* Belgian individuals (identified as § in Figure 4). Interestingly the Y-extended PAR1 boundary PCR described above also generated amplicons in these individuals. We therefore conclude that the majority of – if not all – I2a* Y chromosomes carry the duplicon.

The Insertional Translocation in Y Recombines with X
Formal proof that the extended PAR sequence is truly pseudoautosomal would be the demonstration of recombination events within the duplicon between X and Y. We show two lines of circumstantial evidence that this is the case.
First, we amplified ∼5 kb of the distal duplicated region and sequenced the amplicons using long-read single molecule sequencing by PacBio. Haplotypes were phased and all family members were found to share one of three X specific haplotypes (Figure 2 D). All fathers and sons shared at least one similar X specific haplotype, confirming the paternally inherited haplotype. Notably, only family 4 did not have paternal inheritance from the large haplotype groups 1 or 2. This family was also the only family with haplogroup R from Y-Chromosomal STR typing, and was the only non-Belgian family, confirming its distant and independent origin. Oddly, two samples (P10 and P15), did not have a single unphased contig (indicating two identical amplicons) or a single contig with phasing (indicating the same target amplicon sequence with small nucleotide differences). They instead featured one unphased contig resembling the targeted X region (P10 56xcoverage, P15 81xcoverage) and one contig with less coverage (P10 38xcoverage, P15 32xcoverage) matching a highly similar (95%) region of the Y chromosome.
Despite the observation that all I2a* sub-haplogroup members are derived from an ancient NAHR recombination event, there are at least two different extended PAR haplotypes on the Y chromosomes (Table 1). The different haplotypes on Y could have developed through historical mutational events or as a product of recombination between the X chromosome and the duplication insertion on the Y chromosome. Since the two main haplotypes differ by twelve variants we believe recombination is a more likely event.

Second, ∼5 kb amplicons spanning the Y-extended PAR junction were PacBio sequenced and the smaller PCR amplicons spanning the boundary were Sanger sequenced. Within the Sanger sequenced region, the reference LTR6B sequences marking the duplicon's borders differ between each other at 15 positions (Figure 2 C). All carrier Sanger sequences had the same distal 13 differences that match the X-specific LTR6B. However, the proximal two differences (SNP rs2534625/rs12843082 and a single indel) were only found in the LTR6B sequence of a subset of carriers. Carriers with the two variants also had an additional non-reference LTR6B sequence variation (rs2316283). We labeled the additional variant containing sequence as Junc1 and the more X-specific sequence as Junc2. All carriers also showed three variants in the pseudoautosomal reference sequence: an A at rs2534627, a T at rs2857320, and at rs34061732. PacBio amplicon sequencing of the duplicon border identified variants upstream of the Sanger sequencing for rs211654, rs10625422, and rs211655 in all samples with longer amplicon lengths (Table S2, all samples except P10-13). In the region overlapping the Sanger sequences, all PacBio amplicons showed perfect concordance with the Sanger calls. Additionally, a Junc1 carrying an additional SNP (rs211656) was found in a single PacBio amplicon (termed Junc1c in Table 1). To conclude, within the I2a* sub-haplogroup members, two different Y-extended PAR junctions were identified. Junc1 is a recombination between the distal X specific LTR6B and the proximal PAR specific LTR6B, a consequence of the non-allelic recombination event. In Junc2, the original X specific LTR6B is observed. The most likely explanation is that a recombination event occurred in the manner of gene conversion with the X-linked LTR6B serving as the donor and the Y-linked LTR6B as the acceptor reconstituting the original X specific LTR6B sequence. Another possibility is that a recombination event occurred within this LTR6B between the distal and proximal parts of the fusion LTR6B reconstituting the original X specific LTR6B sequence.
Discussion
PAR1 is common to most eutherian mammals, with a gene order that has been fairly well-conserved since its addition to the pre-existing sex chromosomes that are shared with marsupials [25]. However, the PAB has shifted over evolutionary time and both the size and gene content of PAR1 differ among mammalian species, implying genes within the ancestral PAR have been differentially subsumed into the non-recombining regions in different mammalian lineages [2]. In general, there is evolutionary pressure to expand the non-recombining region resulting in contraction of the PAR. This attrition is attributed to recombination suppression of sex determining region flanking regions. This PAR attrition is counteracted by the addition of new PAR sequences via translocations. Such terminal translocation patterns have shaped the human PAR1 and PAR2 [25]. Here we demonstrate that an apparent male specific X chromosomal copy variant flanking PAR1 represents a PAR1 length polymorphism. The duplication causes a 110 kb proximal extension of PAR1.
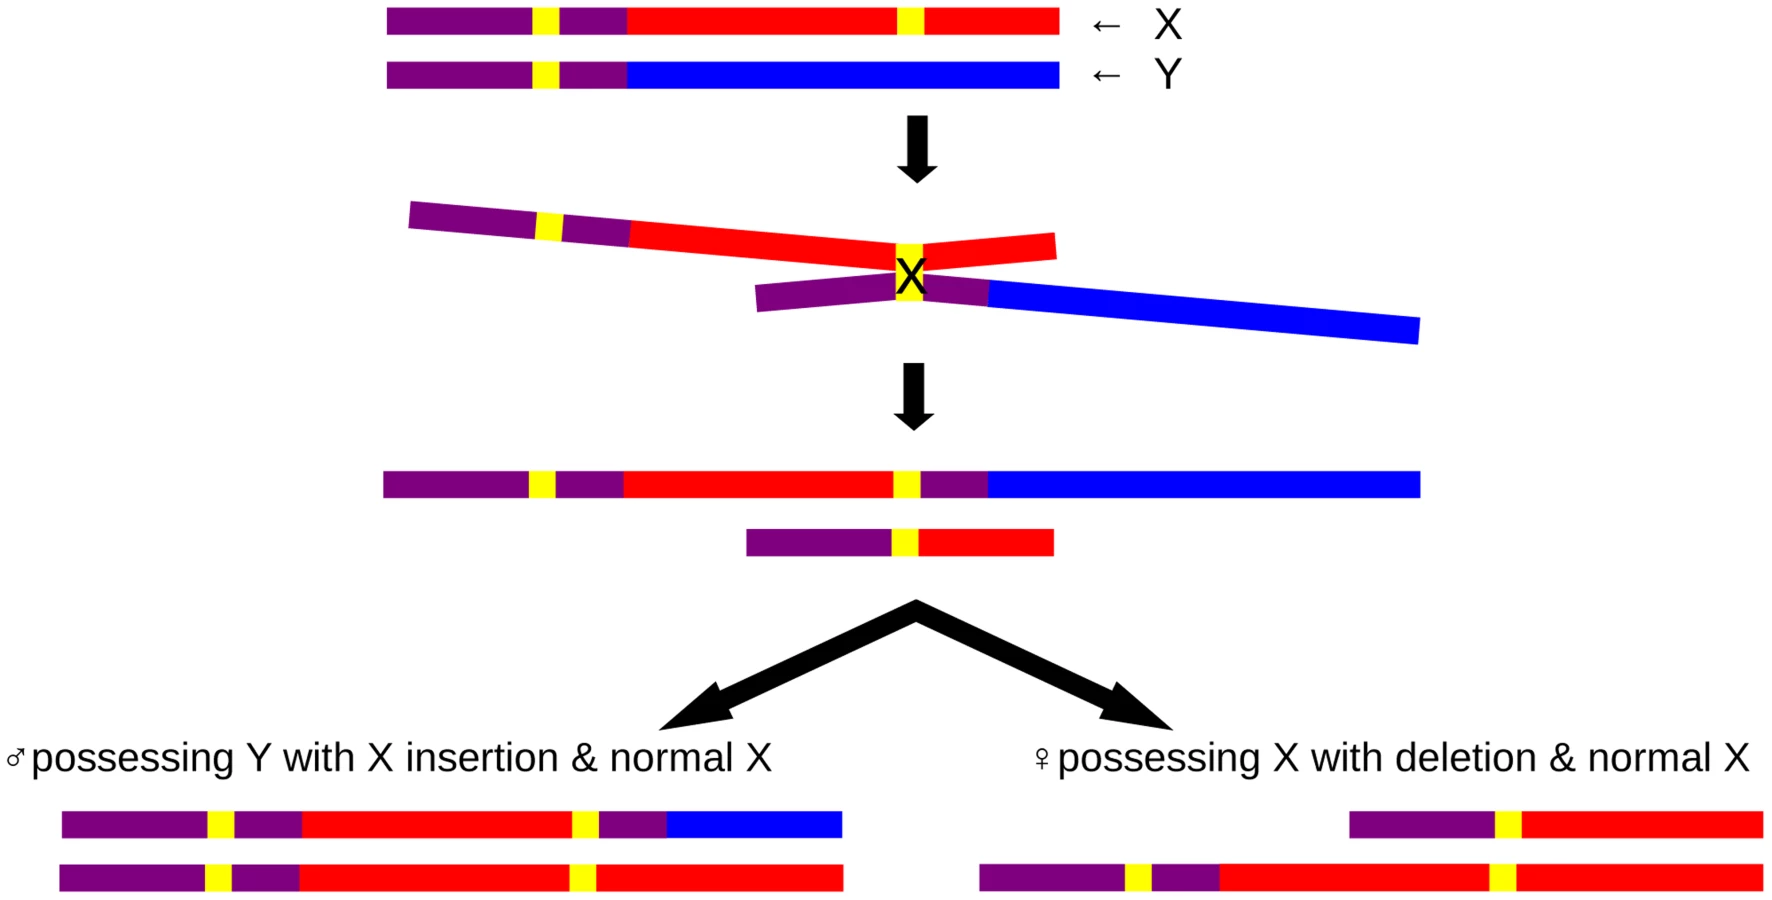
The PAR1 extension resulted from an insertional translocation event, caused by non-allelic homologous recombination (NAHR) between the LTR6B repeats, one of which is located within PAR1 and one in the X-specific region (Figure 5). This PAB length polymorphism could reflect either an ancient PAB which has shifted during hominoid evolution or could be a de novo event which has occurred during recent human evolution. Several lines of evidence suggest the latter. First, the PAB in great apes and macaques coincides with the human reference PAB. Hence, for this PAB polymorphism to be ancient, it should have arisen during hominoid evolution and subsequently be lost in the majority of our population. Second, the analysis of chromosome Y haplotypes carrying this duplicon shows the presence of this rare variant in different haplogroups which are phylogenetically unrelated (Figure S2) and from different geographic locations, together with an absence of the rare variant in other haplogroups. To be the PAB predecessor, it would have to be lost several times during human evolution. Hence, the most parsimonious explanation is that the PAB polymorphism is caused by independent, but identical, insertional translocation events. In addition, the identification of one family carrying the reciprocal microdeletion which results in a 5 kb reduction of PAR1 on the X chromosome demonstrates that NAHR at the X and Y LTR6B repeats is recurrent.
We not only show sequence homology of the extended PAR region, but provide strong evidence for recombination. This provides formal proof that the extended PAR also acts functionally as a pseudoautosomal sequence. Since all the haplogroup I2a* individuals are ancestrally related, the PAR1 extension is likely to be the consequence of a single insertional translocation event. Nevertheless, different X haplotypes exist in the Y of this haplogroup I2a*. We therefore assume that those haplotypes have been introduced by X-Y recombination. Second, three (four if including Junc1c) of those males have a different junction (Junc2) as compared to the majority of this haplogroup. We deduced that Junc1 is generated by the insertional translocation event and that Junc2 has arisen by X-Y recombination within the X specific LTR6B.
Insertional translocation events are thought to be the consequence of at least three chromosomal breaks resulting in an interchromosomal transposition of a broken fragment (2 breaks) into another chromosome (at least one break). The exact mechanism by which insertional translocations are generated remains, however, to be established. Interestingly, Durkin, et al. [26] showed that several insertional translocation events in cattle genome evolution have occurred via a circular intermediate which subsequently integrated into the receptor chromosome. Here, we present, to our knowledge, the first example of an insertional translocation which is generated by NAHR. Whereas the duplicon is technically an insertional translocation, it has mechanistically arisen because of a terminal translocation event between the long terminal repeat (LTR) in unique X chromosomal sequence and the LTR in the XY homologous region. Several reciprocal balanced and unbalanced translocations have been shown to be the consequence of NAHR between different chromosomes [27]. This translocation event can be considered mechanistically similar. In contrast to the known low copy repeats (LCRs) that generate NAHR events, the LTRs here are extremely short, with only 548 bp homology. Hence, opposite to the general view that only LCRs larger than several kb are drivers of genomic disorders [28], [29], this observation provides further proof that short repeats also have to be considered as drivers of illegitimate recombination [30], [31].
Whether NAHR is a common mechanism for the generation of insertional translocations remains to be determined. Nevertheless, it is tempting to speculate that the proximal PAB expansion detected amongst mouse subspecies also occurred as a consequence of an interstitial NAHR mediated translocation event. The house mouse, Mus musculus domesticus, has the smallest PAR amongst those that have been mapped. The PAB is located at about 700 kb from the distal end of the X chromosome, the third intron of the Mid1 gene and truncates the 5′ end of the Y copy. However, in Mus musculus castaneus, a subspecies of the house mouse, the PAB shows a 430 kb shift proximal of the M.m.domesticus boundary. The dichotomy in sequence divergence between the proximal and distal segments of the M.m.castaneus PAR suggests the proximal segment is a recent translocation of X chromosome sequence to the Y chromosome. Interestingly, the Y specific PAB of M.m.castaneus is characterized by a long interspersed nuclear element (LINE1) that is present throughout the mouse genome [32]. Since NAHR between line elements has been suggested as a cause of chromosomal rearrangements [33], [34] it seems plausible that it originated by the same NAHR mechanism. Sequencing of more PABs in other species and populations will probably reveal more pseudoautosomal boundary polymorphisms.
Variation in the PAR boundary is likely to have consequences for the expression of both adjacent genes situated in the duplicon: XG and GYG2 (Figure 1 B). XG encodes a surface protein expressed on red blood cells that belongs to a clinically irrelevant blood group system [35]. GYG2 encodes glycogenin-2, the predominant glycogenin isoform in the liver, which serves as a primer for glycogen synthase [36], [37]. Since the duplication is inherited in all families where the inheritance could be determined and since the duplication can be traced within most likely all I2a* sub-haplogroup members, it seems clear that this variant does not cause developmental anomalies or observable adverse fitness effects. Loss of XG and GYG2 may, however, have biochemical consequences and is likely to result in reduced fitness. Based on the paternal origin of the deletion and the apparent normal phenotype of the father, any effect of nullisomy of both those genes is likely to be minor. However, follow up of this family as well as the detection of more patients with this deletion is required to establish potential phenotypic effects.
In conclusion, we demonstrate that a pseudoautosomal length polymorphism exists in the human population. The extension of the PAR by NAHR presents a novel mechanism shaping sex chromosomal evolution. It seems plausible that such events have occurred frequently during genome evolution. In addition to the already known deceleration of Y chromosome degradation, our results demonstrate a new way of counteracting the processes leading to a loss of Y chromosomes in humans since a proximally extending PAR1 reconstitutes X-borne genetic material thought to be lost from the Y. Thus, if true, current predictions on when the Y chromosome will be lost from humans [38] need to be adapted for the effects of proximally extending PARs. The finding of this length polymorphism also has consequences for statistical genetic analysis in this region since recombination events may alter the haplotype structure periodically.
Materials and Methods
Ethics Statement
The study of variants in the human population is part of the analysis of copy number variants coming from an institutional genome wide analysis study. This has been approved by the institutional review board under protocol nr. S55513.
Sample Collection, Cytogenetic, FISH, and Array Analysis
Blood samples were obtained from 16 patients, 13 parents, and 2 siblings referred for cytogenetic investigation due to the presence of intellectual disability (ID), autism, dysmorphic features or - in one case - subfertility. All families had a geographic origin in Belgium, except family 4 that originated from France. Phenotypes are described in further detail in Table S1. Duplications were confirmed by FISH using BAC clones as previously described [39]. Probe RP11-457M7 was used to target the pseudoautosomal region and probe RP11-146D5 targeted the X-specific duplication.
Samples were analyzed on CytoSure 105K and 180K Custom Microarrays composed of probes from the CytoSure Syndrome Plus v2 array supplemented with probes from the CytoSure ISCA v2 60K array [40], [41]. DNA digestion, labeling, and hybridization were performed according to the manufacturer's protocol.
PCR and Sanger Sequencing
PCR was used to identify the breakpoints. Primers (Table S2) were designed with Primer3 [42], [43]. Input sequences were masked for interspersed repeat sequences using the RepeatMasker track [44], [45] provided by the UCSC browser [46], [47]. Amplification of fragments was performed using the Platinum Taq DNA Polymerase system (Invitrogen), following the manufacturer's protocol. The thermocycler profile used was: 94°C for 30 sec, followed by 25 cycles at 94°C for 30 sec, 60°C for 30 sec, and 72°C for 2 : 30 min, with a final extension of 72°C for 1 min.
We performed Sanger sequencing of the breakpoint-spanning amplicons on an ABI 3130xl automated capillary DNA sequencer (Applied Biosystems). First, ExoSAP-IT (USB) treatment was performed according to the manufacturer's protocol. A BigDye Terminator v3.1 Cycle Sequencing Kit (Applied Biosystems) was then used as follows: the sequencing reaction was performed using 2 µl template, 1.5 µl sequencing buffer (5X), 4.5 µl distilled water, 0.5 µl Big Dye, 2.5 µl primer (separate reactions for F and R). Reaction conditions were: 3 min at 96°C followed by 25 cycles at 96°C for 10 sec, 5 sec at 50°C, and 4 min at 60°C. Sequencing products were precipitated using 10 µl sequencing product, 10 µl distilled water, 2 µl NaAcEDTA (1.5 M NaAc + 2.5 mM EDTA) and 80 µl ice cold EtOH (100%). Samples were stored for 15 min at room temperature (RT), and then centrifuged for 30 min at 4°C and 3000 rpm. Supernatant was removed. Samples were centrifuged upside-down for 1 min at 4°C and 1800 rpm. 150 µl ice cold 70% EtOH was added and samples were centrifuged for 10 min at 4°C and 1800 rpm. Supernatant was removed and samples were centrifuged upside-down for 1 min at 4°C and 1800 rpm. Samples were kept for 30 min at RT (dust - and light free). 15 µl of High Dye (formamide) were added before spinning and vortexing samples. Samples were stored for 15 min at RT and denatured for 3 min at 96°C. DNA sequences were visualized using ABI sequence scanner v1.0 (Applied Biosystems).
BAC Mediated Targeted Paired-End Sequencing
BAC-mediated targeted paired-end sequencing was used to narrow down the breakpoint region. DNA was captured by a BAC mediated pull-down using an adapted protocol of Bashiardes et al. [48]. BAC clone ChrX-32k-3P23 was labeled with BioPrime DNA Labeling System (Invitrogen) according to the manufacturer's protocol. Genomic DNA was sonicated to a fragment size of approximately 350-650 bp and linkers were added. Separately, 300 ng biotin-labeled BAC mixed with 30 µl Cot-1 DNA, 1% 3M Na-Acetate, and 3000 ng fragmented genomic DNA mixed with 1% 3 M Na-Acetate and in 2.5× abs. EtOH were precipitated at −20°C overnight. Samples were centrifuged for 30 min at 4°C and 3000 rpm. Supernatant was removed. Samples were centrifuged upside-down for 1 min at 4°C and 1800 rpm. 150 µl ice cold 70% EtOH were added and samples were centrifuged for 10 min at 4°C and 1800 rpm. Supernatant was removed and samples were centrifuged upside-down for 1 min at 4°C and 1800 rpm. Pellets were dried at 37°C for a few minutes and resuspended in 25 µl nuclease–free water at 37°C for at least 30 min. Samples were transferred to 0.2 ml tubes and denatured and hybridized in a thermocycler as follows: BAC DNA was denatured for 5 min at 95°C and incubated for 15 min at 65°C. 24 µl of 2× hybridization buffer (1.5 M NaCl, 40 mM Na-phosphate buffer pH 7.2, 10 mM EDTA pH8.0, 10× Denhardt's Solution, 0.2% SDS) were added in the cycler and samples were incubated for another hour at 65°C. Genomic DNA was denatured after 40 minutes in another thermocycler for 5 min at 95°C and incubated for 15 min at 65°C. 25 µl of 2× hybridization buffer were added in the cycler. Finally both samples were mixed in the thermocycler by pipetting and hybridized for another 70 h at 65°C. 100 µl magnetic beads (Dynamed M-280 Streptavidin; Invitrogen) were washed twice with 1 ml binding buffer (10 mM Tris-HCl pH 7.5, 1 mM EDTA ph 8.0, 1 M NaCl) and resuspended in 150 µl binding buffer. Hybridization solution was pipetted from cycler to the prepared beads. Tubes were sealed and spun for 30 min upside-down at RT. Beads were pulled down with a magnet, the supernatant removed, and beads were washed once for 15 min in 1 ml 1× SSC, 0.1% SDS on a vibrating table at RT and twice for 15 min in 1 ml 0.1 × SSC 0.1% SDS at 65°C in a vibrating heating block. 50 µl 0.1 M NaOH were added to the beads and they were shook gently for 10 min at RT. Finally the supernatant was pipetted to 1 M Tris-HCL pH 7.5 and the resulting volume of 100 µl was distributed on QIAquick Spin Columns and purified according to the manufacturer's instructions.
Samples were sequenced on a HiSeq 2000 (Illumina) for 2×100 bp reads using the SBS sequencing kit v3 following the manufacturer's protocol. The standard Illumina primary data analysis work-flow was followed for base calling and quality scoring.
Illumina reads were aligned to the human genome (hg19) with BWA v0.5.9 [49] with default settings except that nucleotides with quality score lower than 15 were soft clipped. Read duplicates were discarded after mapping with PICARD MarkDuplicates v1.38 (http://picard.sourceforge.net). Local realignment around indels was performed with RealignerTargetCreator and IndelRealigner from GATK v1.0.4974 [50]–[52]. Finally base quality scores were recalibrated with CountCovariates and Table Recalibration from GATK. The variant frequency of each position of chromosome X between bases 2,680,000 and 2,830,000 was assessed with SNIFER (E. Souche, personal communication). Reads not mapped in proper pair, reads mapped with a mapping quality lower than 30, and nucleotides with quality lower than 20 were discarded. A call was considered heterozygous if its read depth was of at least 100 and the variant frequency was between 25% and 75%.
Y-chr Haplogroup and Y-STR Typing
In total, 42 Y-STR loci were genotyped for all samples as described in previous studies [53], [54]. However, instead of PowerPlex Y the recent developed PowerPlex Y23 System (Promega Corporation, Madison, WI, USA) was used. All 42-Y-STR haplotypes were submitted to Whit Atheys Haplogroup Predictor [55] to obtain probabilities for the inferred haplogroups. Based on these results, the samples were assigned to specific Y-SNP assays according to previously published protocols [53], [56] to confirm the main haplogroup and to assign the sub-haplogroup to the most accurate level of the latest published Y-chromosomal tree [57], [58].
GenAlEx version 6.5 [59], [60] was used to calculate the differences between all observed haplotypes based on the 42 Y-STR loci. Next, the median joining haplotype network for all the samples belonging to haplogroup I2a* (I-P37.2*) was constructed based on 26 single-copy Y-STRs by NETWORK version 4.5.1.0 [61] (http://www.fluxus-engineering.com) together with all I2 (I-P215) samples already observed in the autochthonous Belgian population by Larmuseau et al. [53], [54], [56]. The network analysis used the weighting scheme described by Qamar et al. [62] due to different mutation rates among the markers based on Ballantyne et al. [23].
Pacific Biosciences Sequencing and Analyses
Primers (Table S2) were designed with Primer3 to cover chrX:2,718,644-2,723,016 and a combination of chrX:2805180-2809097 plus chrY:2644703-2645415. PacBio specific barcodes with padding sequence were added to the 5′ end of the primers. PCRs were performed using the TaKaRa long range PCR kit by ClonTech. Products were checked on agarose gels, individually purified on MinElute columns (Qiagen), quantified with the Quant-iT PicoGreen dsDNA Assay Kit (Life Technologies), and equimolar amounts pooled. This pool was purified on Qiagen MinElute columns, concentrated, and fragmentation checked on a DNA 12000 chip analyzed on a Bioanalyzer 2100 (Agilent). ∼2 µlg of the pool was prepared for sequencing according to Pacific Biosciences 5 kb protocol using PacBio's DNA Template Prep Kit 2.0 (3 kb-10 kb). The library was first sequenced on a PacBio RS using a DNA/Polymerase Binding Kit 2.0 on a single SMRT cell for a 120 minute movie. The library was sequenced a second time on a PacBio RSII using a DNA/Polymerase Binding Kit P4 on a single SMRT cell for a 180 minute movie. Both runs used PacBio DNA Sequencing Kit 2.0 sequencing reagents. Both SMRTcells were analyzed together using SMRT portal version 2.2's RS_Long_Amplicon_Analysis.1 pipeline with the following non-default settings: minimum sub-read length of 4000, demultiplexing with paired barcodes, and higher stringency on the barcode filtering (30). The assembled amplicon contigs were evaluated by command line BLAST [63] against targeted sequences flanked by 100 N's. Contigs were selected with alignment lengths near to the full target length and a minimum coverage of 30. These contigs were visualized and aligned with ClustalX 2.1 [64] to call variants, ignoring Poly-N length variants of ≥5 nucleotides.
Supporting Information
Zdroje
1. BachtrogD (2013) Y-chromosome evolution: emerging insights into processes of Y-chromosome degeneration. Nat Rev Genet 14 : 113–124.
2. OttoSP, PannellJR, PeichelCL, AshmanTL, CharlesworthD, et al. (2011) About PAR: the distinct evolutionary dynamics of the pseudoautosomal region. Trends Genet 27 : 358–367.
3. LahnBT, PageDC (1999) Four evolutionary strata on the human X chromosome. Science 286 : 964–967.
4. PandeyRS, Wilson SayresMA, AzadRK (2013) Detecting evolutionary strata on the human X chromosome in the absence of gametologous Y-linked sequences. Genome Biol Evol 5 : 1863–1871.
5. MaraisG, GaltierN (2003) Sex chromosomes: how X-Y recombination stops. Curr Biol 13: R641–643.
6. KatsuraY, IwaseM, SattaY (2012) Evolution of genomic structures on Mammalian sex chromosomes. Curr Genomics 13 : 115–123.
7. AitkenRJ, Marshall GravesJA (2002) The future of sex. Nature 415 : 963.
8. Marshall GravesJA (2006) Sex chromosome specialization and degeneration in mammals. Cell 124 : 901–914.
9. HughesJF, SkaletskyH, BrownLG, PyntikovaT, GravesT, et al. (2012) Strict evolutionary conservation followed rapid gene loss on human and rhesus Y chromosomes. Nature 483 : 82–86.
10. WatersPD, DuffyB, FrostCJ, DelbridgeML, GravesJAM (2001) The human Y chromosome derives largely from a single autosomal region added to the sex chromosomes 80-130 million years ago. Cytogenet Cell Genet 92 : 74–79.
11. VermeeschJR, PetitP, KermouniA, RenauldJC, Van Den BergheH, et al. (1997) The IL-9 receptor gene, located in the Xq/Yq pseudoautosomal region, has an autosomal origin, escapes X inactivation and is expressed from the Y. Hum Mol Genet 6 : 1–8.
12. CharcharFJ, SvartmanM, El-MogharbelN, VenturaM, KirbyP, et al. (2003) Complex events in the evolution of the human pseudoautosomal region 2 (PAR2). Genome Res 13 : 281–286.
13. FlaquerA, RappoldGA, WienkerTF, FischerC (2008) The human pseudoautosomal regions: a review for genetic epidemiologists. Eur J Hum Genet 16 : 771–779.
14. FilatovDA, GerrardDT (2003) High mutation rates in human and ape pseudoautosomal genes. Gene 317 : 67–77.
15. BussellJJ, PearsonNM, KandaR, FilatovDA, LahnBT (2006) Human polymorphism and human-chimpanzee divergence in pseudoautosomal region correlate with local recombination rate. Gene 368 : 94–100.
16. SchiebelK, MederJ, RumpA, RosenthalA, WinkelmannM, et al. (2000) Elevated DNA sequence diversity in the genomic region of the phosphatase PPP2R3L gene in the human pseudoautosomal region. Cytogenet Cell Genet 91 : 224–230.
17. JorgezCJ, WeedinJW, SahinA, Tannour-LouetM, HanS, et al. (2011) Aberrations in pseudoautosomal regions (PARs) found in infertile men with Y-chromosome microdeletions. J Clin Endocrinol Metab 96: E674–679.
18. EllisNA, YeTZ, PattonS, GermanJ, GoodfellowPN, et al. (1994) Cloning of PBDX, an MIC2-related gene that spans the pseudoautosomal boundary on chromosome Xp. Nat Genet 6 : 394–400.
19. EllisNA, TippettP, PettyA, ReidM, WellerPA, et al. (1994) PBDX is the XG blood group gene. Nat Genet 8 : 285–290.
20. GlaserB, MyrtekD, RumplerY, SchiebelK, HauwyM, et al. (1999) Transposition of SRY into the ancestral pseudoautosomal region creates a new pseudoautosomal boundary in a progenitor of simian primates. Hum Mol Genet 8 : 2071–2078.
21. Van LaereAS, CoppietersW, GeorgesM (2008) Characterization of the bovine pseudoautosomal boundary: Documenting the evolutionary history of mammalian sex chromosomes. Genome Res 18 : 1884–1895.
22. EllisN, YenP, NeiswangerK, ShapiroLJ, GoodfellowPN (1990) Evolution of the pseudoautosomal boundary in Old World monkeys and great apes. Cell 63 : 977–986.
23. BallantyneKN, GoedbloedM, FangR, SchaapO, LaoO, et al. (2010) Mutability of Y-chromosomal microsatellites: rates, characteristics, molecular bases, and forensic implications. Am J Hum Genet 87 : 341–353.
24. WalshB (2001) Estimating the time to the most recent common ancestor for the Y chromosome or mitochondrial DNA for a pair of individuals. Genetics 158 : 897–912.
25. MangsAH, MorrisBJ (2007) The Human Pseudoautosomal Region (PAR): Origin, Function and Future. Curr Genomics 8 : 129–136.
26. DurkinK, CoppietersW, DrogemullerC, AharizN, CambisanoN, et al. (2012) Serial translocation by means of circular intermediates underlies colour sidedness in cattle. Nature 482 : 81–84.
27. OuZ, StankiewiczP, XiaZ, BremanAM, DawsonB, et al. (2011) Observation and prediction of recurrent human translocations mediated by NAHR between nonhomologous chromosomes. Genome Res 21 : 33–46.
28. LiuP, LacariaM, ZhangF, WithersM, HastingsPJ, et al. (2011) Frequency of nonallelic homologous recombination is correlated with length of homology: evidence that ectopic synapsis precedes ectopic crossing-over. Am J Hum Genet 89 : 580–588.
29. LiuP, CarvalhoCM, HastingsPJ, LupskiJR (2012) Mechanisms for recurrent and complex human genomic rearrangements. Curr Opin Genet Dev 22 : 211–220.
30. ShawCJ, LupskiJR (2005) Non-recurrent 17p11.2 deletions are generated by homologous and non-homologous mechanisms. Hum Genet 116 : 1–7.
31. LuoY, HermetzKE, JacksonJM, MulleJG, DoddA, et al. (2011) Diverse mutational mechanisms cause pathogenic subtelomeric rearrangements. Hum Mol Genet 20 : 3769–3778.
32. WhiteMA, IkedaA, PayseurBA (2012) A pronounced evolutionary shift of the pseudoautosomal region boundary in house mice. Mamm Genome 23 : 454–466.
33. KoumbarisG, Hatzisevastou-LoukidouH, AlexandrouA, IoannidesM, ChristodoulouC, et al. (2011) FoSTeS, MMBIR and NAHR at the human proximal Xp region and the mechanisms of human Xq isochromosome formation. Hum Mol Genet 20 : 1925–1936.
34. HigashimotoK, MaedaT, OkadaJ, OhtsukaY, SasakiK, et al. (2013) Homozygous deletion of DIS3L2 exon 9 due to non-allelic homologous recombination between LINE-1s in a Japanese patient with Perlman syndrome. Eur J Hum Genet 21 : 1316–1319.
35. JohnsonNC (2011) XG: the forgotten blood group system. Immunohematology 27 : 68–71.
36. MuJ, SkuratAV, RoachPJ (1997) Glycogenin-2, a novel self-glucosylating protein involved in liver glycogen biosynthesis. J Biol Chem 272 : 27589–27597.
37. MuJ, RoachPJ (1998) Characterization of human glycogenin-2, a self-glucosylating initiator of liver glycogen metabolism. J Biol Chem 273 : 34850–34856.
38. Marshall GravesJA (2002) The rise and fall of SRY. Trends Genet 18 : 259–264.
39. VermeeschJR, MertensG, DavidG, MarynenP (1995) Assignment of the human glypican gene (GPC1) to 2q35-q37 by fluorescence in situ hybridization. Genomics 25 : 327–329.
40. SrisupunditK, BradyPD, DevriendtK, FrynsJP, Cruz-MartinezR, et al. (2010) Targeted array comparative genomic hybridisation (array CGH) identifies genomic imbalances associated with isolated congenital diaphragmatic hernia (CDH). Prenat Diagn 30 : 1198–1206.
41. VermeeschJR, MelotteC, FroyenG, Van VoorenS, DuttaB, et al. (2005) Molecular karyotyping: array CGH quality criteria for constitutional genetic diagnosis. J Histochem Cytochem 53 : 413–422.
42. UntergasserA, CutcutacheI, KoressaarT, YeJ, FairclothBC, et al. (2012) Primer3–new capabilities and interfaces. Nucleic Acids Res 40: e115.
43. KoressaarT, RemmM (2007) Enhancements and modifications of primer design program Primer3. Bioinformatics 23 : 1289–1291.
44. JurkaJ (2000) Repbase update: a database and an electronic journal of repetitive elements. Trends Genet 16 : 418–420.
45. Smit AFA, Hubley R, Green P (1996–2010). RepeatMasker Open-3.0. URL http://www.repeatmasker.org.
46. KentWJ, SugnetCW, FureyTS, RoskinKM, PringleTH, et al. (2002) The human genome browser at UCSC. Genome Res 12 : 996–1006.
47. KarolchikD, BarberGP, CasperJ, ClawsonH, ClineMS, et al. (2014) The UCSC Genome Browser database: 2014 update. Nucleic Acids Res 42: D764–770.
48. BashiardesS, VeileR, HelmsC, MardisER, BowcockAM, et al. (2005) Direct genomic selection. Nat Methods 2 : 63–69.
49. LiH, DurbinR (2009) Fast and accurate short read alignment with Burrows-Wheeler transform. Bioinformatics 25 : 1754–1760.
50. McKennaA, HannaM, BanksE, SivachenkoA, CibulskisK, et al. (2010) The Genome Analysis Toolkit: a MapReduce framework for analyzing next-generation DNA sequencing data. Genome Res 20 : 1297–1303.
51. DePristoMA, BanksE, PoplinR, GarimellaKV, MaguireJR, et al. (2011) A framework for variation discovery and genotyping using next-generation DNA sequencing data. Nat Genet 43 : 491–498.
52. Van der AuweraGA, CarneiroM, HartlC, PoplinR, del AngelG, et al. (2013) From FastQ Data to High-Confidence Variant Calls: The Genome Analysis Toolkit Best Practices Pipeline. Curr Protoc Bioinformatics 43 : 11.10.1–11.10.33.
53. LarmuseauMH, VanderheydenN, JacobsM, CoomansM, LarnoL, et al. (2011) Micro-geographic distribution of Y-chromosomal variation in the central-western European region Brabant. Forensic Sci Int Genet 5 : 95–99.
54. LarmuseauMH, VanoverbekeJ, GielisG, VanderheydenN, LarmuseauHF, et al. (2012) In the name of the migrant father–analysis of surname origins identifies genetic admixture events undetectable from genealogical records. Heredity (Edinb) 109 : 90–95.
55. AtheyWT (2006) Haplogroup prediction from Y-STR values using a Bayesian-allele-frequency approach. Journal of Genetic Genealog 2 : 34–39.
56. LarmuseauMH, OttoniC, RaeymaekersJA, VanderheydenN, LarmuseauHF, et al. (2012) Temporal differentiation across a West-European Y-chromosomal cline: genealogy as a tool in human population genetics. Eur J Hum Genet 20 : 434–440.
57. Van GeystelenA, DecorteR, LarmuseauMH (2013) AMY-tree: an algorithm to use whole genome SNP calling for Y chromosomal phylogenetic applications. BMC Genomics 14 : 101.
58. Van GeystelenA, DecorteR, LarmuseauMH (2013) Updating the Y-chromosomal phylogenetic tree for forensic applications based on whole genome SNPs. Forensic Sci Int Genet 7 : 573–580.
59. PeakallR, SmousePE (2006) GENALEX 6: genetic analysis in Excel. Population genetic software for teaching and research. Molecular Ecology Notes 6 : 288–295.
60. PeakallR, SmousePE (2012) GenAlEx 6.5: genetic analysis in Excel. Population genetic software for teaching and research–an update. Bioinformatics 28 : 2537–2539.
61. BandeltHJ, ForsterP, RohlA (1999) Median-joining networks for inferring intraspecific phylogenies. Mol Biol Evol 16 : 37–48.
62. QamarR, AyubQ, MohyuddinA, HelgasonA, MazharK, et al. (2002) Y-chromosomal DNA variation in Pakistan. Am J Hum Genet 70 : 1107–1124.
63. AltschulSF, GishW, MillerW, MyersEW, LipmanDJ (1990) Basic local alignment search tool. J Mol Biol 215 : 403–410.
64. LarkinMA, BlackshieldsG, BrownNP, ChennaR, McGettiganPA, et al. (2007) Clustal W and Clustal X version 2.0. Bioinformatics 23 : 2947–2948.
Štítky
Genetika Reprodukční medicínaČlánek vyšel v časopise
PLOS Genetics
2014 Číslo 11
Nejčtenější v tomto čísle
- An RNA-Seq Screen of the Antenna Identifies a Transporter Necessary for Ammonia Detection
- Systematic Comparison of the Effects of Alpha-synuclein Mutations on Its Oligomerization and Aggregation
- Functional Diversity of Carbohydrate-Active Enzymes Enabling a Bacterium to Ferment Plant Biomass
- Regularized Machine Learning in the Genetic Prediction of Complex Traits