
Benefit and harm of intensive blood pressure treatment: Derivation and validation of risk models using data from the SPRINT and ACCORD trials
Using data from two large clinical trials that showed heterogeneity in blood pressure treatment effects, Sanjay Basu and colleagues investigate how risks of treatment benefit and harm vary across individuals.
Published in the journal:
. PLoS Med 14(10): e32767. doi:10.1371/journal.pmed.1002410
Category:
Research Article
doi:
https://doi.org/10.1371/journal.pmed.1002410
Summary
Using data from two large clinical trials that showed heterogeneity in blood pressure treatment effects, Sanjay Basu and colleagues investigate how risks of treatment benefit and harm vary across individuals.
Introduction
Elevated blood pressure (BP) is the leading risk factor for death worldwide [1,2], primarily because it increases the risk of cardiovascular disease (CVD) events such as myocardial infarction (MI) and stroke. In the SPRINT trial, patients at high risk for CVD events experienced lower rates of fatal and nonfatal major CVD events when treated with intensive rather than standard BP treatment (goal systolic BP < 120 mm Hg versus <140 mm Hg, respectively) [3]. Yet patients treated with intensive treatment experienced significantly higher rates of some serious adverse events including hypotension, syncope, electrolyte abnormalities, and acute kidney injury or failure. A similar trial conducted on patients with type 2 diabetes mellitus (the ACCORD-BP trial) found lower average benefit of intensive BP treatment than SPRINT [4]. Meta-analyses of randomized trials comparing more intensive to less intensive BP treatment have noted that while CVD events and deaths are typically reduced more among intensively treated participants overall, the increased risk of serious adverse events is not necessarily among the same participants who experience CVD risk reduction—raising the question of whether lower BP targets may best apply to some patient populations than others [5].
Conventional subgroup analyses have not revealed a distinct subgroup of individuals among whom intensive therapy is clearly more beneficial or harmful [3,4]. Such univariate subgroup analyses are known to be limited in detecting clinically important heterogeneity in treatment effects; multivariable analyses, examining combinations of features that may explain variation in treatment harms and benefits, have better power while limiting false positive results [6–9].
In this context, many researchers have sought to identify patients more likely to experience benefit or harm from intensive BP treatment. Previous studies that developed multivariable risk prediction models to identify patients who are more likely to benefit from intensive BP management have limitations that can now be examined. Previous studies lacked rigorous calibration testing (e.g., Greenwood–Nam–D’Agostino [GND] tests, which detect significant differences between predicted and observed outcomes) or relied on data from trials that did not have very low systolic BP targets and therefore had very few participants in which very tight BP control was considered [5,10–12]. Importantly, all previous studies used models selected to detect heterogeneous treatment effects in ways that can become overfitted and unstable in the presence of highly collinear variables (such as systolic and diastolic pressure). Newer statistical regularization methods have been created to select a parsimonious and stable model among collinear variables [13].
The principal aim of this study was to develop and validate risk models for predicting individual patients’ chances of benefit and harm from intensive BP therapy. A secondary aim was to test the hypothesis that the statistical method of elastic net regularization would improve the estimation of risk models for predicting absolute risk difference, as compared to a traditional backwards variable selection approach.
Methods
Ethical approval
Approval for this study was obtained from the institutional review board of Stanford University (eProtocol #IRB-39321).
Study design and reporting was based on the Transparent Reporting of a Multivariable Prediction Model for Individual Prognosis or Diagnosis (TRIPOD) Statement [14]. S1 Text details the data underlying the results and provides the prospective analysis plan. The TRIPOD checklist is uploaded as S2 Text.
Primary study sample
The primary study sample included participants from the SPRINT trial (N = 9,361), a randomized, controlled, open-label trial of intensive versus standard BP treatment among adults without type 2 diabetes mellitus, conducted at 102 clinical sites in the United States between November 2010 and August 2015 (Table 1) [3]. The trial was stopped early after a median follow-up of 3.3 years due to a significantly lower rate of the primary composite CVD outcome in the intensive treatment arm than in the standard treatment arm. Inclusion criteria for the SPRINT trial included age at least 50 years, systolic BP 130 to 180 mm Hg, and increased CVD event risk (defined as clinical or subclinical CVD other than stroke; chronic kidney disease, excluding polycystic kidney disease, with an estimated glomerular filtration rate between 20 and 60 ml/min/1.73 m2; a 10-year Framingham risk score of at least 15%; or age at least 75 years). Exclusion criteria included having diabetes mellitus or a prior stroke.

The study sample for model development included N = 9,069 SPRINT trial participants (96.9% of the randomized participant sample); 292 participants were omitted due to missing predictor variables. The study sample for model validation included N = 4,498 ACCORD-BP participants (95.0% of the randomized participant sample); the other 235 participants were omitted due to missing predictor variables. Correlations among variables in each dataset are provided in S1 and S2 Figs.
Outcomes
Two composite outcomes were defined for the current analysis: (i) CVD events and deaths, defined as nonfatal MI, acute coronary syndrome (ACS) not resulting in MI, nonfatal stroke, acute decompensated congestive heart failure (CHF), or CVD death, and (ii) serious adverse events, defined as occurrences of hypotension, syncope, electrolyte abnormalities, bradycardia, or acute kidney injury or renal failure that were fatal or life-threatening, that resulted in clinically significant or persistent disability, that required or prolonged a hospitalization, or that were judged by the investigator to represent a clinically significant hazard or harm (coded per the Medical Dictionary for Regulatory Activities) [15]. Injurious falls were excluded from the serious adverse events list because they were not available in the external comparator trial dataset (see the external validation section, below), although they were not significantly increased in the intensive treatment arm in SPRINT. In a sensitivity analysis, we included injurious falls to ensure that results did not meaningfully change.
Candidate predictors
Candidate predictor variables for the two outcomes were taken from the pre-randomization eligibility screening or clinical examination prior to randomization to intensive or standard treatment. Predictors included treatment arm (intensive or standard), age at randomization (years), sex (male/female), race/ethnicity (black/non-black and Hispanic/non-Hispanic), seated systolic and diastolic BP (mm Hg), tobacco smoking status (current/not current smoker and former/not former smoker), serum creatinine (μmol/l), urine microalbumin/creatinine ratio (mg/mmol), total cholesterol (mmol/l), direct high-density lipoprotein (HDL) cholesterol (mmol/l), triglycerides (mmol/l), body mass index (kg/m2), number of BP treatment agents (0 or higher), daily aspirin use (yes/no), and statin use (yes/no). All predictor variables were included along with interaction terms between treatment arm (intensive or standard) and each predictor variable, to identify possible heterogeneous treatment effects.
Development and assessment of CVD and adverse event prediction models
Two Cox proportional hazards models were developed to predict outcomes censored at a maximum of 5 years: (i) a CVD prediction model to predict incidence of first CVD event (MI, ACS, stroke, or CHF) or CVD death, and (ii) an adverse event prediction model to predict incidence of first serious adverse event.
To select amongst predictor variables, elastic net regularization was used. Elastic net regularization is a statistical approach designed to select models in the context of collinearity, which produces challenges for older stepwise selection approaches [13,16]. In our study, elastic net regularization was used to fit a Cox model via penalized maximum likelihood, using internal cross-validation to minimize the risk of overfitting and attendant overestimation of C-statistics (see S1 Text). Only complete case analyses were performed, without imputation, due to <8% of participants missing values for any predictor variable (Fig 1). We compared the elastic net regularization approach to a traditional backwards selection approach, which has been used extensively in the past for development and selection of risk models based on randomized trial data [9]. The backwards selection approach starts with all candidate predictor variables in the model equations, then drops variables with the least significance sequentially until finding a model that minimizes the Akaike information criterion, which rewards models for better fit but penalizes models for having additional parameters (to maintain parsimony) [17].

For performance assessment, model discrimination was assessed with the C-statistic (area under the receiver operating characteristic curve, capturing sensitivity and specificity of the model), and model calibration with the GND test (comparing predicted versus observed probabilities of each outcome by deciles of risk).
Development and assessment of clinical risk scores
For each SPRINT participant, benefit and harm due to intensive treatment were calculated using the CVD and adverse event prediction models. Benefit was estimated as predicted CVD event/death risk for each study participant under intensive treatment minus the predicted CVD event/death risk under standard treatment, censored at 5 years. Harm was estimated as predicted serious adverse event risk under intensive treatment minus the predicted serious adverse event risk under standard treatment, censored at 5 years. Hence, we did not use our models to identify individuals with highest/lowest risk of CVD or highest/lowest risk of serious adverse events (i.e., we were not identifying risk groups); rather, we used the Cox models to first calculate the probability of a CVD event/death or probability of a serious adverse event on intensive treatment, and then used the Cox models to calculate the probability of these events on standard treatment. The difference in probability of a CVD event/death on standard treatment minus the probability on intensive treatment was defined as the absolute predicted benefit (absolute risk reduction [ARR] in CVD event/death probability), and the probability of a serious adverse event on intensive treatment minus the probability on standard treatment was defined as the absolute predicted harm (absolute risk increase [ARI] in serious adverse event probability). When the Cox model was calibrated to the derivation data, the calibration provided the baseline hazard rate for events (listed in Table 2) and the intercept (also listed in Table 2). Hence, the full functional form of the Cox model was used to produce an absolute probability of an event, as with common CVD risk prediction models such as the Framingham risk score [18]. By differencing the absolute probability of an event on intensive treatment and the absolute probability of an event on standard treatment, we calculated the absolute predicted benefit or harm from switching from standard to intensive treatment [8,9].

To assess the clinical importance of higher or lower predicted benefit or harm, the ARR in CVD events/deaths and the ARI in serious adverse events in SPRINT were computed across predicted benefit and predicted harm values [20].
External validation
For external validation, the risk scores developed from SPRINT data were applied to participants in the ACCORD-BP trial (N = 4,733 total, of which we used 4,498 with complete predictor variable data), a trial of intensive versus standard BP therapy among adults with type 2 diabetes mellitus (see S1 Text). Because the published composite primary outcomes differed between the SPRINT and ACCORD-BP trials, we utilized the disaggregated outcome variables in the ACCORD-BP dataset to construct the CVD and adverse event outcomes defined above, ensuring consistent endpoint definitions between the derivation and validation datasets. For both the elastic net and backwards selection approaches, because of different baseline probabilities of events, the Cox baseline hazard probability was recomputed for the models for individuals with type 2 diabetes from ACCORD-BP, though model coefficients were not adjusted.
Subgroups
To transform the predicted benefit/harm values into categories for ARR/ARI estimation, we divided the predicted benefit/harm distributions into subgroups. Cut points defining the subgroups were chosen to correspond to the tertiles of the distribution of predicted benefit and harm for the combined data from both SPRINT and ACCORD-BP, because the predicted benefit/harm distributions were unimodal (i.e., no natural cut points) and because the cut points for tertiles were closest to the zero benefit and zero harm lines. In sensitivity analyses, we recalculated the ARR/ARI estimates using alternative cut points defined by tertiles of predicted benefit and harm for SPRINT alone and for ACCORD-BP alone.
Results
Participants
The study sample included N = 9,069 SPRINT trial participants (96.9% of the randomized participant sample, including 4,555 [97.4%] from the intensive treatment arm and 4,514 [96.4%] from the standard treatment arm); 292 participants were excluded due to missing candidate predictor variables (Fig 1). The included participant sample had an average age of 67.8 years, was 35.4% female, and had an average baseline systolic BP of 139.7 mm Hg (Table 1). Participants were followed for a median of 3.3 years. Of the participants included from the intensive treatment arm, 206 (4.5%) experienced CVD events or deaths, and 445 (9.8%) experienced serious adverse events; from the standard treatment arm, 285 (6.3%) participants experienced CVD events or deaths, and 326 (7.2%) experienced serious adverse events.
Development and assessment of CVD and adverse event prediction models
The CVD prediction model chosen through elastic net regularization was designed to predict CVD events/deaths and included treatment arm and pre-randomization values for age, sex, race/ethnicity, smoking status, BP, BP agents prescribed, aspirin and statin use, lipid profile, serum creatinine, and body mass index (Table 2). The key interaction terms between intensive treatment and patient characteristics revealed that older age, black race, higher diastolic BP, and higher lipids were associated with greater CVD risk reduction benefit from intensive treatment, while current smoking was associated with less benefit. The CVD prediction model chosen through elastic net regularization had a C-statistic of 0.71 (95% CI: 0.68, 0.74) and passed the GND test for calibration (slope of observed versus predicted event rate = 1.06, intercept = −0.004, GND test for significant difference between observed and predicted event rates, P = 0.68; plots in Fig 2).

The adverse event prediction model chosen through elastic net regularization was designed to predict the first serious adverse event, and included treatment arm and pre-randomization values for age, sex, ethnicity, smoking status, BP, BP agents prescribed, aspirin and statin use, lipid profile, and serum creatinine (Table 3). The key interaction terms between intensive treatment and patient characteristics revealed that male sex, current smoking, statin use, elevated creatinine, and higher lipids were associated with greater risk of serious adverse events from intensive treatment. The adverse event prediction model chosen through elastic net regularization had a C-statistic of 0.71 (95% CI: 0.69, 0.73) and passed the GND test (slope of observed versus predicted event rate = 1.10, intercept = −0.012, GND test P = 0.12; Fig 2). Injurious falls were excluded from the serious adverse events list in the base case analysis because they were not available in the external validation dataset; in a sensitivity analysis conducted on the SPRINT dataset (S1 Table), we included injurious falls and found that model variable selection, coefficients, and results did not significantly change for the serious adverse event model.

Overall, predicted benefit and risk from the models chosen through elastic net regularization (Table 4) varied markedly among SPRINT study participants, with an interquartile range of ARR of 0.009 to 0.031 in the probability of a CVD event/death, and an interquartile range of ARI of 0.014 to a 0.047 in the probability of experiencing a serious adverse event due to intensive therapy (Fig 3).

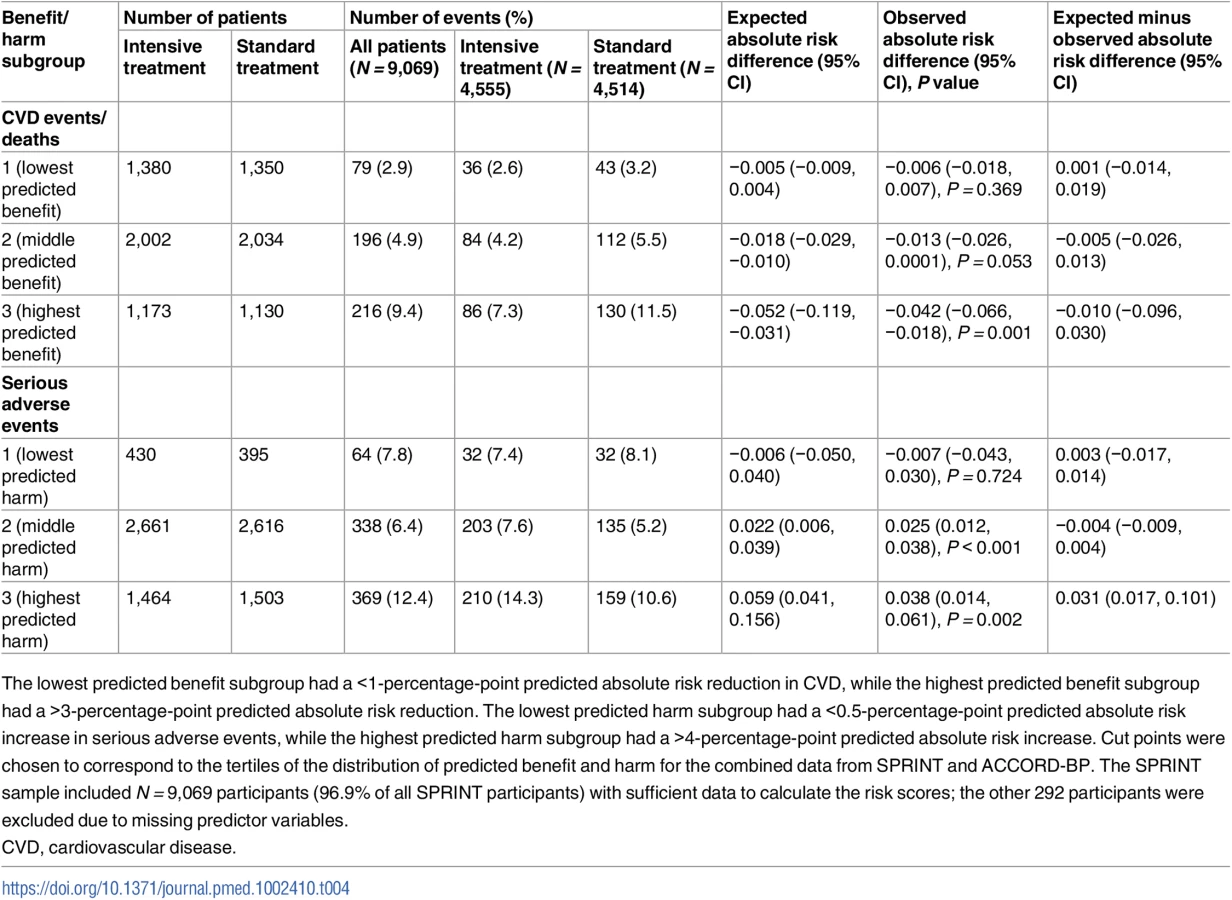
Based on tertiles of ARR/ARI in SPRINT and ACCORD-BP, the lowest predicted benefit subgroup had a <1-percentage-point ARR in CVD, while the highest predicted benefit subgroup had a >3-percentage-point ARR. The lowest predicted harm subgroup had a <0.5-percentage-point ARI in serious adverse events, while the highest predicted harm subgroup had a >4-percentage-point ARI. SPRINT participants in the highest subgroup of predicted benefit from the models chosen through elastic net regularization had a number needed to treat (NNT) of 24 to prevent 1 CVD event/death over 5 years (ARR in CVD events/deaths = 0.042, 95% CI: 0.018, 0.066; P = 0.001), those in the middle predicted benefit subgroup had a NNT of 76 (ARR = 0.013, 95% CI: −0.0001, 0.026; P = 0.053), and those in the lowest subgroup had no significant risk reduction (ARR = 0.006, 95% CI: −0.007, 0.018; P = 0.71; Table 4; P < 0.001 for trend in ARR across predicted benefit subgroups by stratified log-rank test). Participants in the highest subgroup of predicted harm had a number needed to harm (NNH) of 27 to cause 1 serious adverse event (ARI in serious adverse events = 0.038, 95% CI: 0.014, 0.061; P = 0.002), participants in the middle predicted harm subgroup had a NNH of 41 (ARI = 0.025, 95% CI: 0.012, 0.038; P < 0.001), and participants in the lowest subgroup had no significant increase in harm (ARI = −0.007, 95% CI: −0.043, 0.030; P = 0.72; Table 4; P < 0.001 for trend in ARI across predicted risk subgroups by stratified log-rank test).
Predicted benefit and predicted harm were only moderately correlated (Pearson correlation 0.56), with a substantial number of patients having high predicted benefit and low predicted harm, or vice versa. In all, 422 (4.7%) of the included participants were in the highest two benefit subgroups (positive benefit; ARR = 0.032, 95% CI: 0.013, 0.050; P = 0.027) but the lowest subgroup of harm (no significant harm; ARI = 0.007, 95% CI: −0.043, 0.030; P = 0.72), and, similarly, 2,327 (25.7%) were in the lowest benefit subgroup (no significant benefit; ARR = 0.006, 95% CI: −0.007, 0.018; P = 0.37) but the highest two harm subgroups (increased risk of harm; ARI = 0.032, 95% CI: 0.013, 0.050; P = 0.001; S2 Table).
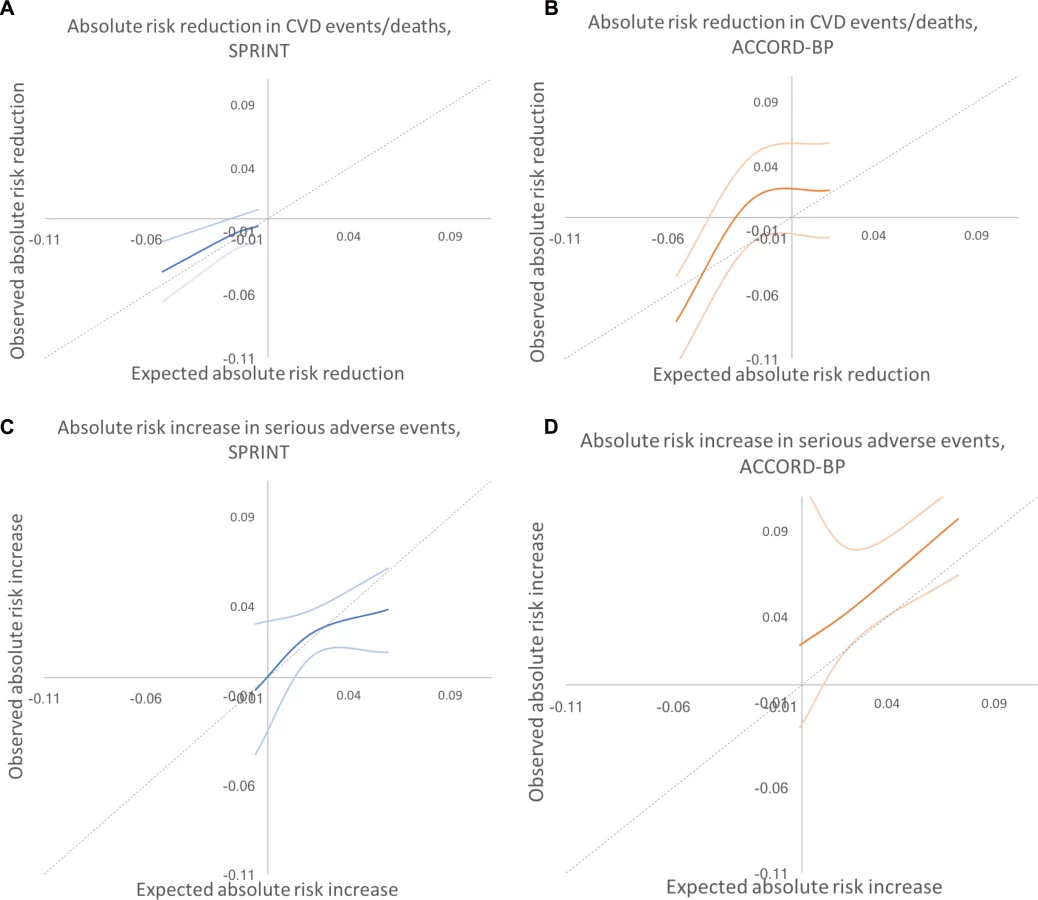
Results did not meaningfully differ when alternative cut points were used to define the subgroups (S3 Table). As shown in Fig 4, the expected versus observed absolute risk difference in major CVD events/death across the participant population was close to the ideal diagonal line; for serious adverse events, the line was less linear, with improved predictive performance at low to middle rates of risk, and underprediction of risk at high levels of risk.
External validation
The external validation sample included ACCORD-BP participants with sufficient data to calculate the risk estimates (N = 4,498 [95.0%]); 235 participants were omitted due to missing predictor variables (Fig 1). The included participant sample had an average age of 63.2 years, was 48.9% female, and had an average baseline systolic BP of 139.5 mm Hg (Table 1).
The models chosen through elastic net regularization were adjusted to the higher baseline hazard rate among type 2 diabetics (Table 2), but no adjustment was made to the model coefficients. The models for benefit and harm had C-statistics of 0.69 (95% CI: 0.66, 0.71) and 0.71 (95% CI: 0.68, 0.74), calibration slopes of 0.96 and 1.01, calibration intercepts of 0.006 and −0.003, and GND test P values for differences between predicted and observed event rates of 0.18 and 0.07 for CVD risk reduction and adverse event risk increase, respectively (Fig 2).
ACCORD-BP participants in the highest subgroup of predicted benefit from the models chosen through elastic net regularization had a NNT of 12 to prevent 1 CVD event/death (ARR = 0.081, 95% CI: 0.046, 0.115; P < 0.001), participants in the middle subgroup had no significant risk reduction (ARR = −0.013, 95% CI: −0.047, 0.021; P = 0.46), and participants in the lowest subgroup had no significant risk reduction (ARR = −0.021, 95% CI: −0.058, 0.016; P = 0.26; Table 5; P < 0.001 for trend in ARR across predicted benefit subgroups by stratified log-rank test). Participants in the highest subgroup of predicted harm had a NNH of 11 to cause 1 serious adverse event (ARI = 0.097, 95% CI: 0.071, 0.123; P < 0.001), participants in the middle subgroup had a lower but significant increase (ARI = 0.046, 95% CI: 0.020, 0.073; P = 0.001), and participants in the lowest subgroup had a still lower and not significant increase (ARI = 0.023, 95% CI: −0.047, 0.093; P = 0.522; Table 5; P < 0.001 for trend in ARI across predicted risk subgroups by stratified log-rank test). The model was not able to predict ARI in serious adverse events as precisely among ACCORD-BP as among SPRINT participants; ACCORD-BP participants with low predicted ARI had a wide range of observed ARIs (Fig 5). As shown in Fig 5, the expected versus observed absolute risk difference in major CVD events/deaths and adverse events across the study population was not as close to the ideal diagonal line in ACCORD-BP as in SPRINT, particularly with underprediction of adverse events in ACCORD-BP, but remained within the confidence intervals of prediction.


Overall, the ACCORD-BP participant sample was skewed more towards lower benefit and higher harm than the SPRINT participant sample (Fig 3; S2 Table). Sixty-seven (1.5%) of included ACCORD-BP participants were in the highest subgroup of predicted benefit (positive benefit; ARR = 0.081, 95% CI: 0.046, 0.115; P < 0.001) but the lowest subgroup of harm (no significant risk of harm; ARI = 0.023, 95% CI: −0.047, 0.093; P = 0.522), and, conversely, 2,739 participants (60.9%) were in the lowest two benefit subgroups (no significant benefit; ARR = 0.017, 95% CI: −0.018, 0.053; P = 0.35) but the highest two harm subgroups (significant risk of harm; ARI = 0.072, 95% CI: 0.046, 0.098; P < 0.001).
Comparison of models chosen through elastic net regularization versus traditional selection
Compared to the models chosen through elastic net regularization, the models chosen through a traditional backwards selection procedure had different variable choices, including critically different interaction terms for detection of heterogeneous treatment effects (Table 6). The CVD model chosen through traditional backwards selection included terms for age, total and HDL cholesterol, smoking, serum creatinine, urine microalbumin/creatinine ratio, number of BP agents, systolic BP, diastolic BP, and treatment arm, and interaction terms between treatment arm and age, systolic BP, and diastolic BP. The serious adverse event model chosen through traditional backwards selection included terms for age, sex, serum creatinine, urine microalbumin/creatinine ratio, smoking, systolic BP, number of BP treatment agents, and treatment arm, and an interaction term between treatment arm and number of BP treatment agents.

Compared with the elastic net models, the models chosen through traditional backwards selection had similar discrimination in SPRINT but lower discrimination in ACCORD-BP for serious adverse events (C-statistics of 0.70 [95% CI: 0.68, 0.72] and 0.71 [95% CI: 0.69, 0.73] for CVD events/deaths and serious adverse events, respectively, in SPRINT, and 0.68 [95% CI: 0.66, 0.70] and 0.60 [95% CI: 0.57, 0.62] in ACCORD-BP, a meaningfully large difference for serious adverse event discrimination [21,22]) and poorer calibration (slopes of 1.08 and 1.16 for CVD events/deaths and adverse events, respectively, in SPRINT, and 1.04 and 0.54 in ACCORD-BP), failing the GND test in the ACCORD-BP external validation sample for the serious adverse event model (GND test P value = 0.68 for the CVD model and <0.001 for the serious adverse event model; Table 7; Fig 2). Importantly, the predictions from the adverse event model chosen through traditional backwards selection failed to correctly stratify higher versus lower absolute risk for adverse events from intensive BP therapy, given the poorer calibration (Table 8; Fig 2). ACCORD-BP participants in the middle predicted subgroup for ARI actually had lower mean observed ARIs (ARI = 0.023, 95% CI: 0.010, 0.036; P = 0.001) than those in the lowest predicted risk increase subgroup (ARI = 0.033, 95% CI: −0.005, 0.070; P = 0.087). As shown in Fig 4, the expected versus observed absolute risk difference from the backward selection model was similar to that of the elastic net regularization model for absolute risk difference in CVD events/deaths, but was highly erroneous in estimation of ARI in serious adverse events for both the SPRINT and ACCORD-BP datasets.


Discussion
In this study, we achieved our principal aim of deriving models that could help identify subgroups of participants in both SPRINT and ACCORD-BP who had lower versus higher ARRs in CVD events/deaths and ARIs in serious adverse events. While numerous models exist for estimating overall CVD risk, the recent availability of individual participant data from randomized intensive BP treatment trials has enabled us to apply a strategy that not only estimates overall risk of CVD events/deaths, but also addresses a different clinically important question: who is most likely to benefit and most likely to experience harm from intensive BP treatment? The models we developed (i) calculate degree of benefit or harm from therapy, rather than only absolute pre-treatment risk; (ii) use data readily available to clinicians, with an online calculator available to provide patient-specific probabilities of benefit and harm to enable individualized patient counseling (and to provide clinicians with individualized NNT values for benefit/harm) [19]; and (iii) may assist clinician–patient discussions of potential benefits and harms from intensive BP treatment, particularly among patients with concerns about polypharmacy or the occurrence of serious adverse events [23]. An individual practitioner can use the risk calculators for personalized decision-making that may inform treatment choices. Specifically, because many individuals in both SPRINT and ACCORD who were eligible for intensive BP treatment had a higher probability of harm than benefit, or vice versa, the risk calculation may have significant impact on clinical decision-making. Previous studies did not have rigorous calibration testing, or they relied on data from trials that did not have very low systolic BP targets and therefore had very few participants in which very tight BP control was considered [5,10–12]. Our study analyzes ARR rather than only relative risk reduction, and also examines major treatment-related adverse events, which were an uncommon outcome in trials and meta-analyses that had less intensive BP targets than SPRINT or ACCORD-BP [11].
As a secondary aim, we also tested the hypothesis that an elastic net regularization approach to identifying heterogeneities in treatment effect from trial data could improve upon the traditional method of backwards variable selection when identifying a risk model for ARR or ARI. Our findings that an elastic net regularization approach produced superior results to a traditional model selection approach for predicting ARI in severe adverse events has important and timely implications for the development of clinical prediction models from randomized trial data in the era of precision medicine. While it is straightforward to model changes in risk for a disease like CVD, which is well-characterized, it is a more nuanced issue to model increased risk of adverse events, for which the predictors are less well-known. Data from several trials are now becoming more widely available, and our findings imply that selecting a model through regularization to identify which patients are more likely to experience benefit or harm may help reduce overfitting and imprecise estimates as compared to models using traditional variable selection and estimation approaches.
Our findings highlight the more general point that average trial results can often hide clinically important heterogeneities in treatment effects and that such variation can be difficult to detect through conventional univariate subgroup analyses. Our findings suggest there were high benefit and low benefit subgroups in the SPRINT trial, despite the overall beneficial average treatment effect. It is not surprising that our findings differ from conclusions made in commentaries accompanying the SPRINT trial, which suggested that while some serious adverse events were reported in the trial, the risk of harm would be unlikely to outweigh the benefits of intensive therapy [24]. Our study suggests that the risk of benefit and of harm varies across individuals, necessitating individualized treatment decisions. Extensive theoretical and empirical research suggests that conventional univariate subgroup analyses are very limited in their ability to detect clinically important heterogeneity in treatment effects [25–27]. In contrast, multivariable approaches, especially those that examine baseline risk factors for treatment benefit and harm, often detect major variation in absolute benefits within clinical trials [6–9]. Therefore, our findings, which identified large heterogeneity in the likelihood of experiencing benefit or harm from intensive BP therapy, are more expected than not. Overall consideration of a number of factors in combination, rather than any single factor, was required to robustly explain the clinically important variations in benefit and in harm found in SPRINT. Conducting multivariable, data-driven analyses may improve the refinement of clinical practice guidelines, compared to the strategy of providing guidance for clinical practice based on single variables such as age or diabetes status [28]. Our risk scores correctly identified that the ACCORD-BP trial contained mostly participants who would be expected to derive low benefit and have a high chance of harm from intensive BP therapy, suggesting that attributes other than diabetes mellitus may explain the difference between the high average benefit found in SPRINT and the low average benefit found in ACCORD-BP. Further, our results suggest there were high benefit and low benefit groups in both trials.
Our results also have broader implications for detection of heterogeneous treatment effects from clinical trial data. Previously, several authors estimated models to improve personalized medicine by detecting heterogeneous treatment effects from clinical trial data [7,9,29]. In a recent international contest, numerous models were selected from SPRINT trial data to identify which patients were more likely to experience benefits or harms from intensive BP therapy [12]; our results using a standard backwards selection model were similar those of 1 previously published set of models [10]. We found that the serious adverse event model chosen by backwards selection failed formal calibration testing (GND tests for differences between predicted and observed risks). Indeed, the adverse event model chosen through the standard backwards selection approach failed to correctly stratify higher versus lower ARIs for adverse events from intensive BP therapy. Models selected to detect heterogeneous treatment effects are known to become overfitted to development data and unstable when collinear variables (such as systolic and diastolic BP) are present; modern regularization methods have been created to select a parsimonious and stable model among collinear variables. Our data-driven approach using a contemporary regularization method with conservative cross-validation also limits type I error from multiple hypothesis testing.
Our analysis has important caveats and limitations. Due to the early stopping of the SPRINT trial, we could only assess short-term outcomes over the duration of the study. Additionally, while the ACCORD-BP trial was used as an external comparator, it differed from SPRINT in important respects, such as the inclusion of people with type 2 diabetes mellitus and differences in BP measurement technique [30]. Additionally, while SPRINT and ACCORD-BP are the largest randomized controlled trials evaluating the clinical effectiveness of intensive BP control, providing the best available evidence on the heterogeneity of intensive BP treatment effects, our plots of predicted versus observed ARI in serious adverse events reveal that a key limitation is the sample size of ACCORD-BP, which limited us in that there was a broad range of observed ARI estimates among persons with type 2 diabetes who had a low predicted ARI. A prior simulation study revealed that alternative trial designs that randomize persons in a stepwise fashion to incrementally greater treatment intensity, rather than randomizing between only standard and intensive BP treatment levels, could increase statistical power to detect heterogeneous treatment effects and provide more granular estimates of treatment benefit or harm [27]. We chose not to use quality of life or disability weights by outcome to combine the two models into a single score. Such values vary widely across different people (e.g., one person’s priorities may not be the same as another’s when comparing the risk of heart attack to the risk of renal failure) and vary even within clinical endpoints (e.g., one stroke can be much worse than another) [31]. Finally, it is not possible for us to mechanistically explain the physiological relationships of the heterogeneous treatment effects captured by our models, since this is an observational secondary data analysis that cannot dissect mechanisms, and the covariates chosen in the models may be surrogates for complex physiological processes.
The next logical step following this analysis is to prospectively test the impact of our risk score on clinical practice and patient outcomes, along with further validation among more heterogeneous populations. In addition, further study of specific drug–drug interactions, standardization of outcome definitions, and continued sharing of data from randomized trials could assist in the development and validation of clinical prediction scores such as this one in future assessments. Future work involving risk model development to detect heterogeneous treatment effects from clinical trial data should consider strategies such as the elastic net regularization approach employed here, to improve model selection and coefficient estimation in the setting of collinearity.
Supporting Information
Zdroje
1. Bromfield S, Muntner P. High blood pressure: the leading global burden of disease risk factor and the need for worldwide prevention programs. Curr Hypertens Rep. 2013;15 : 134–6. doi: 10.1007/s11906-013-0340-9 23536128
2. Forouzanfar MH, Liu P, Roth GA, Ng M, Biryukov S, Marczak L, et al. Global burden of hypertension and systolic blood pressure of at least 110 to 115 mm Hg, 1990–2015. JAMA. 2017;317 : 165–82. doi: 10.1001/jama.2016.19043 28097354
3. SPRINT Research Group. A randomized trial of intensive versus standard blood-pressure control. N Engl J Med. 2015;2015 : 2103–16.
4. ACCORD Study Group. Effects of intensive blood-pressure control in type 2 diabetes mellitus. N Engl J Med. 2010;2010 : 1575–85.
5. Xie X, Atkins E, Lv J, Bennett A, Neal B, Ninomiya T, et al. Effects of intensive blood pressure lowering on cardiovascular and renal outcomes: updated systematic review and meta-analysis. Lancet. 2016;387 : 435–43. doi: 10.1016/S0140-6736(15)00805-3 26559744
6. Hayward RA, Kent DM, Vijan S, Hofer TP. Multivariable risk prediction can greatly enhance the statistical power of clinical trial subgroup analysis. BMC Med Res Methodol. 2006;6 : 18. doi: 10.1186/1471-2288-6-18 16613605
7. Burke JF, Hayward RA, Nelson JP, Kent DM. Using internally developed risk models to assess heterogeneity in treatment effects in clinical trials. Circ Cardiovasc Qual Outcomes. 2014;7 : 163–9. doi: 10.1161/CIRCOUTCOMES.113.000497 24425710
8. Kent DM, Rothwell PM, Ioannidis JP, Altman DG, Hayward RA. Assessing and reporting heterogeneity in treatment effects in clinical trials: a proposal. Trials. 2010;11 : 85. doi: 10.1186/1745-6215-11-85 20704705
9. Dorresteijn JA, Visseren FL, Ridker PM, Wassink AM, Paynter NP, Steyerberg EW, et al. Estimating treatment effects for individual patients based on the results of randomised clinical trials. BMJ. 2011;343:d5888. doi: 10.1136/bmj.d5888 21968126
10. Patel KK, Arnold SV, Chan PS, Tang Y, Pokharel Y, Jones PG, et al. Personalizing the intensity of blood pressure control. Circ Cardiovasc Qual Outcomes. 2017;10:e003624. doi: 10.1161/CIRCOUTCOMES.117.003624 28373269
11. Blood Pressure Lowering Treatment Trialists’ Collaboration, Sundström J, Arima H, Woodward M, Jackson R, Karmali K, et al. Blood pressure-lowering treatment based on cardiovascular risk: a meta-analysis of individual patient data. Lancet. 2014;384 : 591–8. doi: 10.1016/S0140-6736(14)61212-5 25131978
12. New England Journal of Medicine. SPRINT data analysis challenge. Waltham (Massachusetts): Massachusetts Medical Society; 2017 [cited 2017 Apr 17]. Available: https://challenge.nejm.org/pages/home.
13. Tibshirani R, Bien J, Friedman J, Hastie T, Simon N, Taylor J, et al. Strong rules for discarding predictors in lasso‐type problems. J R Stat Soc Series B Stat Methodol. 2012;74 : 245–66. doi: 10.1111/j.1467-9868.2011.01004.x 25506256
14. Collins GS, Reitsma JB, Altman DG, Moons KG. Transparent reporting of a multivariable prediction model for individual prognosis or diagnosis (TRIPOD): the TRIPOD statement. BMC Med. 2015;13 : 1. doi: 10.1186/s12916-014-0241-z 25563062
15. Brown EG, Wood L, Wood S. The medical dictionary for regulatory activities (MedDRA). Drug Saf. 1999;20 : 109–17. 10082069
16. Simon N, Friedman J, Hastie T, Tibshirani R. Regularization paths for Cox’s proportional hazards model via coordinate descent. J Stat Softw. 2011;39 : 1.
17. Akaike H. Information theory and an extension of the maximum likelihood principle. In: Parzen E, Tanabe K, Kitagawa G, editors. Selected papers of Hirotugu Akaike. New York: Springer; 1998. pp. 199–213.
18. D’Agostino RB, Vasan RS, Pencina MJ, Wolf PA, Cobain M, Massaro JM, et al. General cardiovascular risk profile for use in primary care: the Framingham Heart Study. Circulation. 2008;117 : 743–53. doi: 10.1161/CIRCULATIONAHA.107.699579 18212285
19. Basu S, Sussman J, Rigdon J, Steimle L, Denton B, Hayward R. Risk calculator for benefit and harm from intensive blood pressure treatment. Palo Alto: Stanford University; 2017 [cited 2017 Sep 26]. Available: http://sanjaybasu.shinyapps.io/intbp.
20. Moore DF. Applied survival analysis using R. New York: Springer; 2016.
21. Fawcett T. An introduction to ROC analysis. Pattern Recognit Lett. 2006;27 : 861–74.
22. Metz CE. Basic principles of ROC analysis. Semin Nucl Med. 1978;8 : 283–98. doi: 10.1016/S0001-2998(78)80014-2 112681
23. Bavishi C, Bangalore S, Messerli FH. Outcomes of intensive blood pressure lowering in older hypertensive patients. J Am Coll Cardiol. 2017;69 : 486–93. doi: 10.1016/j.jacc.2016.10.077 28153104
24. Perkovic V, Rodgers A. Redefining blood-pressure targets—SPRINT starts the marathon. N Engl J Med. 2015;373 : 2175–8. doi: 10.1056/NEJMe1513301 26551394
25. VanderWeele TJ, Knol MJ. Interpretation of subgroup analyses in randomized trials: heterogeneity versus secondary interventions. Ann Intern Med. 2011;154 : 680–3. doi: 10.7326/0003-4819-154-10-201105170-00008 21576536
26. Wallach JD, Sullivan PG, Trepanowski JF, Sainani KL, Steyerberg EW, Ioannidis JPA. Evaluation of evidence of statistical support and corroboration of subgroup claims in randomized clinical trials. JAMA Intern Med. 2017;177 : 554–60. doi: 10.1001/jamainternmed.2016.9125 28192563
27. Basu S, Sussman JB, Hayward RA. Detecting heterogeneous treatment effects to guide personalized blood pressure treatment: a modeling study of randomized clinical trials. Ann Intern Med. 2017;154 : 680–3. doi: 10.7326/M16-1756 28055048
28. Chobanian AV. Hypertension in 2017—what is the right target? JAMA. 2017;317 : 579–80. doi: 10.1001/jama.2017.0105 28135357
29. Yeh RW, Secemsky EA, Kereiakes DJ, Normand S - LT, Gershlick AH, Cohen DJ, et al. Development and validation of a prediction rule for benefit and harm of dual antiplatelet therapy beyond 1 year after percutaneous coronary intervention. JAMA. 2016;315 : 1735–49. doi: 10.1001/jama.2016.3775 27022822
30. Agarwal R. Implications of blood pressure measurement technique for implementation of systolic blood pressure intervention trial (SPRINT). J Am Heart Assoc. 2017;6:e004536. doi: 10.1161/JAHA.116.004536 28159816
31. GBD 2013 DALYs and HALE Collaborators, Murray CJL, Barber RM, Foreman KJ, Abbasoglu Ozgoren A, Abd-Allah F, et al. Global, regional, and national disability-adjusted life years (DALYs) for 306 diseases and injuries and healthy life expectancy (HALE) for 188 countries, 1990–2013: quantifying the epidemiological transition. Lancet. 2015;386 : 2145–91. doi: 10.1016/S0140-6736(15)61340-X 26321261
Štítky
Interní lékařstvíČlánek vyšel v časopise
PLOS Medicine
2017 Číslo 10
- Alternativní léčebné možnosti u hypercholesterolemie při intoleranci statinů
- Vliv kombinace nutraceutik na remodelaci levé komory srdeční u osob s metabolickým syndromem
- Nutraceutika a jejich ovlivnění mírného kardiometabolického rizika
- Princip účinku medu v léčbě chronických i infikovaných ran
- Superoxidovaný roztok a jeho využití v léčbě ran
Nejčtenější v tomto čísle
- Assessing the neuroprotective benefits for babies of antenatal magnesium sulphate: An individual participant data meta-analysis
- Gabapentin, opioids, and the risk of opioid-related death: A population-based nested case–control study
- A combination of plasma phospholipid fatty acids and its association with incidence of type 2 diabetes: The EPIC-InterAct case-cohort study
- Quantifying underreporting of law-enforcement-related deaths in United States vital statistics and news-media-based data sources: A capture–recapture analysis