
The Evolution of Spinnable Cotton Fiber Entailed Prolonged Development and a Novel Metabolism
A central question in evolutionary biology concerns the developmental processes by which new phenotypes arise. An exceptional example of evolutionary innovation is the single-celled seed trichome in Gossypium (“cotton fiber”). We have used fiber development in Gossypium as a system to understand how morphology can rapidly evolve. Fiber has undergone considerable morphological changes between the short, tightly adherent fibers of G. longicalyx and the derived long, spinnable fibers of its closest relative, G. herbaceum, which facilitated cotton domestication. We conducted comparative gene expression profiling across a developmental time-course of fibers from G. longicalyx and G. herbaceum using microarrays with ∼22,000 genes. Expression changes between stages were temporally protracted in G. herbaceum relative to G. longicalyx, reflecting a prolongation of the ancestral developmental program. Gene expression and GO analyses showed that many genes involved with stress responses were upregulated early in G. longicalyx fiber development. Several candidate genes upregulated in G. herbaceum have been implicated in regulating redox levels and cell elongation processes. Three genes previously shown to modulate hydrogen peroxide levels were consistently expressed in domesticated and wild cotton species with long fibers, but expression was not detected by quantitative real time-PCR in wild species with short fibers. Hydrogen peroxide is important for cell elongation, but at high concentrations it becomes toxic, activating stress processes that may lead to early onset of secondary cell wall synthesis and the end of cell elongation. These observations suggest that the evolution of long spinnable fibers in cotton was accompanied by novel expression of genes assisting in the regulation of reactive oxygen species levels. Our data suggest a model for the evolutionary origin of a novel morphology through differential gene regulation causing prolongation of an ancestral developmental program.
Published in the journal:
. PLoS Genet 4(2): e25. doi:10.1371/journal.pgen.0040025
Category:
Research Article
doi:
https://doi.org/10.1371/journal.pgen.0040025
Summary
A central question in evolutionary biology concerns the developmental processes by which new phenotypes arise. An exceptional example of evolutionary innovation is the single-celled seed trichome in Gossypium (“cotton fiber”). We have used fiber development in Gossypium as a system to understand how morphology can rapidly evolve. Fiber has undergone considerable morphological changes between the short, tightly adherent fibers of G. longicalyx and the derived long, spinnable fibers of its closest relative, G. herbaceum, which facilitated cotton domestication. We conducted comparative gene expression profiling across a developmental time-course of fibers from G. longicalyx and G. herbaceum using microarrays with ∼22,000 genes. Expression changes between stages were temporally protracted in G. herbaceum relative to G. longicalyx, reflecting a prolongation of the ancestral developmental program. Gene expression and GO analyses showed that many genes involved with stress responses were upregulated early in G. longicalyx fiber development. Several candidate genes upregulated in G. herbaceum have been implicated in regulating redox levels and cell elongation processes. Three genes previously shown to modulate hydrogen peroxide levels were consistently expressed in domesticated and wild cotton species with long fibers, but expression was not detected by quantitative real time-PCR in wild species with short fibers. Hydrogen peroxide is important for cell elongation, but at high concentrations it becomes toxic, activating stress processes that may lead to early onset of secondary cell wall synthesis and the end of cell elongation. These observations suggest that the evolution of long spinnable fibers in cotton was accompanied by novel expression of genes assisting in the regulation of reactive oxygen species levels. Our data suggest a model for the evolutionary origin of a novel morphology through differential gene regulation causing prolongation of an ancestral developmental program.
Introduction
One of the central questions in evolutionary biology concerns the developmental and genetic processes by which new phenotypes arise. The recent merger of genomic technologies with phylogenetics has generated important insights into the evolution of developmental transformations in maize [1,2], rice [3,4] and other taxa, e.g., [5,6]. These studies demonstrate that morphological change in complex organs can often be initiated by relatively few mutations, most often in regulatory regions [7], although the genetic underpinnings of most evolutionary change remains unknown. An exceptional example of evolutionary innovation involving a single-celled structure is the cotton seed trichome, present in all 50 species in the genus Gossypium and colloquially termed “cotton fiber” in the domesticated species. On the day of anthesis (flower opening), approximately one in four cells of the ovular epidermis has already been fated to become a trichome, initially appearing as a spherical protrusion and subsequently elongating through stages of primary wall synthesis, secondary wall synthesis, maturation and cell death. Representing one of most distinct single cell types in the plant kingdom, cotton fibers may attain a final length of 6 cm in some cultivars, with a length/width ratio of more than 2000 [8]. A single cotton ovary contains ∼500,000 elongating cells representing a single cell type.
The long, strong and fine fibers of modern cotton cultivars were wrought through a long history of both natural and human-mediated selection [9–11]. Following its origin about 10 MYA [12,13], Gossypium diversified into approximately 50 species in the warmer, arid to semi-arid regions of both hemispheres. This radiation was accompanied by cytogenetic differentiation, which now is reflected in the recognition of eight, monophyletic “genome groups” (A to G and K) (Figure 1A). Remarkably, four wild Gossypium species were independently domesticated by aboriginal domesticators ∼5000 years ago, or more, and transformed into fiber and seed-oil plants [10,14]. Two of these (G. arboreum and G. herbaceum) are A-genome diploids from the Old World, while the other two (G. hirsutum and G. barbadense) are AD-genome allotetraploids from the New World.

In contrast to the cultivated diploids and tetraploids, wild diploid species have short (mostly <5mm), coarse and tightly adherent trichomes that would not be recognized as “cotton” by a casual observer. The only exception is the wild form of G. herbaceum (G. herbaceum subsp. africanum), which has sparse but elongated and spinnable fiber. Both wild and cultivated cottons produce fiber on the seed coat, but there are striking morphological and structural differences between these fibers, the most obvious of which is their size. Some species (e.g., G.thurberi, G. trilobum, G. davidsonii, and G. klotzschianum) do not possess obvious seed hairs, but they actually are present as developmentally repressed structures not visible to the unaided eye [15]. The duration of the elongation phase and the timing of onset of secondary wall synthesis appear to be key determinants of the final length of the fiber in both wild and cultivated plants [15–18]. This trait of prolonged elongation was passed on to the allopolyploids, which in turn was a key component of their eventual domestication [15].
When viewed in a phylogenetic context (Figure 1A), the origin of spinnable fibers is diagnosed to have occurred once in the history of Gossypium, following divergence of the A-genome and F-genome clades. This “pre-adapted” A-genome ancestor later contributed this genome and its propensity for the development of elongated cotton fibers to the allotetraploid cottons that colonized and diversified in the New World, ultimately giving rise to the modern, annualized forms of G. hirsutum that account for >90% of contemporary world cotton commerce.
To gain insight into the genetic factors that led to the evolution of long, spinnable cotton fibers, we performed global gene expression analysis, comparing the A-genome taxon G. herbaceum to its closest wild relative, G. longicalyx. The latter species was described relatively recently, following its discovery in eastern Africa [19], and is cladistically resolved as the sister taxon to the A-genome in molecular phylogenetic analyses of both plastid and nuclear gene sequences (13) (Figure 1A). We used a newly designed long oligonucleotide microarray and ovular trichome isolation procedures to analyze gene expression over a time-course of trichome development in both species. This analysis revealed major differences in genes related to stress responses and cell elongation, as well as a prolonged developmental profile in wild G. herbaceum. We suggest that the evolution of spinnable fiber was accompanied by prolongation of an ancestral developmental program, mediated through avoidance of stress-like processes in the developing fiber cells. This suggests that the evolutionary origin of a novel cell phenotype was facilitated by hypermorphosis.
Results
The A-Genome Shows a Prolonged Fiber-Cell Developmental Program
We used an experimental loop-design system to compare mRNA expression levels in developing fiber-cells derived from A - and F-genome cotton species (Figure 1B). RNAs isolated from four developmental time-points, 5, 10, 20 and 25 days post-anthesis (DPA), were amplified and hybridized to cotton oligonucleotide microarrays containing 22,827 probes derived from deep EST sampling of diverse tissues and organs [20]. A summary of the number of genes differentially expressed between adjacent time-points during fiber development in both species is presented in Figure 2. Within each genome, many genes were found to be differentially expressed during fiber development (FDR < 0.05), but the distribution of the number of genes differentially expressed between adjacent time points was different for the two species. In G. herbaceum, the distribution was relatively even throughout the developmental stages studied (notice that the interval 10–20 DPA is twice the duration of 5–10 and 20–25 DPA), whereas in the F-genome species, G. longicalyx, ∼80% of significant expression changes occurred between the two adjacent time points 10 and 20 DPA. Also, in the transition from 20 to 25 DPA only 4 genes were differentially expressed in G. longicalyx, in comparison to 493 genes that were differentially expressed during this same interval in the A-genome species G. herbaceum. Because longer, spinnable fiber is phylogenetically derived [15], these results indicate that the fiber-cell developmental program in the A-genome has become prolonged during its evolution.

F-Genome Fiber Development Is Linked with Early Expression of Stress-Related Genes
To better appreciate changes in global expression during fiber development and evolution, we tracked differences in expression between A - and F-genomes for all genes at all developmental stages. For each comparison upregulated and downregulated genes were tabulated, from which we derived categories of statistically overrepresented biological processes (Table S1). As expected from an inter-specific comparison, hundreds of genes were found that were differentially expressed between fibers from A - and F-genome plants. Inspection of the gene lists revealed that, among genes which previously had been described as regulating fiber elongation [21], some did indeed show significant expression differences, while others did not. An example of the developmental expression patterns for 5 differentially expressed and 5 non-differentially expressed, well-described genes, between F - and A - genomes, is provided in Figure S1.
A major difference in the developmental programs of fiber cells in the two taxa was revealed by GO family representation analyses (Table S1). Most noteworthy is the observation that at the beginning of fiber development in F-genome fibers, many genes involved with stress-response processes were highly upregulated. Comparison of statistically overrepresented biological processes at 5 DPA, for example, showed that in A-genome fibers, processes important for elongation, such as “respiration”, “energy” and “ribosome biogenesis” are overrepresented (Table 1). At the same time-point, however, genes upregulated in F-genome fibers belong to biological processes such as “response to stress”, “transcription regulatory activity” and “flavonoid biosynthesis”. Moreover, analyzing the 60 most-differentially expressed genes at 5 DPA, representing the top 2% of the upregulated genes in the F-genome in comparison to the A-genome, showed that more than a third were related to “response to stress” processes (Table S2). The expression pattern of some of these highly upregulated “stress response” genes in developing fiber-cells of the F-genome in comparison to the A-genome are presented in Figure S2.

Overexpressed Genes in A-Genome Fibers Are Associated with H2O2 and ROS Regulation
A possibility that emerged from differences in gene expression between A-genome and F-genome fibers was that high levels of H2O2 and other reactive oxygen species (ROS) may be responsible for the stress-like processes evident in F-genome fibers early in fiber development. Hydrogen peroxide has previously been shown to be important for cell elongation, as it is required for cell wall loosening and expansion [22–25]. At high concentration, however, H2O2 becomes toxic, leading to stress processes that may lead to early onset of secondary cell wall synthesis and the end of cell elongation [22,26]. These observations suggest the hypothesis that the evolution of long spinnable A-genome fibers was accompanied by novel expression of genes that assist in regulating H2O2 and other ROS levels.
To evaluate this possibility, we examined the microarray data for genes that may control ROS and cell stress in elongating cells (Table 2). Three genes shown in other systems to regulate H2O2 levels by functional or regulatory means were investigated further. GAST1-like is a member of the gibberellin-induced, cysteine-rich protein family previously shown to be induced by H2O2. In transgenic Petunia, suppression of GAST1-like homologs inhibits elongation, whereas upregulation stimulates H2O2 scavenging, perhaps via redox-active cysteines, and cell elongation [27]. GAST1-like was previously shown to be expressed mainly in cotton fibers [21] (Figure S3). Cop1/BONZAI is part of a calcium-dependent, membrane-binding protein family, shown to promote growth and development in addition to repression of cell death by inactivation of stress-promoting R-genes [28]. Pex1 is a gene that encodes a protein important for the biogenesis of the peroxisome, an organelle that rids the cell of toxic substances such as H2O2 [29]. Both Cop1/BONZAI and Pex1 genes are only detected in fiber-specific EST libraries, out of more than 30 EST libraries that exist for cotton from a diverse set of tissues and organs (http://cottonevolution.info/).

For each of these three genes, we conducted real-time PCR using elongating and non-elongating fibers from several additional cotton accessions and species with either short or long fiber. As shown in Figure 3, GAST1-like, Cop1/BONZAI and Pex1 were highly upregulated in A-genome relative to F-genome fibers. Paralleling this result, all three genes were expressed in additional taxa having long fibers (G. arboreum, and both cultivated and wild forms of G. hirsutum), at the beginning of fiber-cell development, but were either undetected or were only weakly expressed in species with short fibers (G. raimondii (D clade), in addition to the F-genome species G. longicalyx). This consistent association between fiber development and gene expression across divergent clades suggests a functional association.

Discussion
Transcription profiling of cotton using microarrays has been the subject of several recent studies, either using ovular tissue with fibers attached, or the fibers themselves [21,30–33]. These studies simultaneously evaluate mRNA expression levels for thousands of genes, providing a powerful tool for analyzing biological processes important to cotton fiber differentiation and development. One conclusion is that the transcriptome of cotton fibers is extraordinarily complex [21], involving thousands of genes that vary in expression levels through the stages of cellular initiation, primary wall synthesis, secondary wall deposition, maturation, and death. Here we provide the first comparative evolutionary analysis of fiber cell development, focusing on the initial phylogenetic steps implicated in the natural transformation of epidermal seed trichomes into long, spinnable fibers prior to and during human domestication. In this regard, the accession we used in this study is a domesticated form of G. herbaceum. Thus, our study reflects the evolution of either species-level differences, human selection (domestication), or both. The above-described qPCR analysis, however, was performed using other domesticated and wild species, showing that for this set of genes the changes occurred prior to domestication. In addition to its relevance to the evolutionary transitions in morphology and to cotton crop improvement, to our knowledge this study is the first to characterize the evolutionary, developmental genomics of a single cell type in any eukaryotic organism.
Our proposed model describing the developmental and evolutionary processes that led to the formation of spinnable fiber is presented in Figure 4. Previous ultrastructural characterization of various developing cotton fibers, including those of F - and A - genome species, demonstrate that the earliest stages of fiber initiation and development are phenotypically similar for species with either short or long fibers [15]. At 2 DPA, for example, fiber cells appear as the same spherical protrusion both in F - and A - genomes. This stage is followed by a period of rapid cell elongation, a process known to involve cell-wall relaxation, which itself has been shown to require non-enzymatic reactions mediated by H2O2 and other ROS that cleave polysaccharides [22–25]. Therefore, H2O2, produced enzymatically by oxidation reactions, is a necessary molecule for cell elongation. Higher levels of H2O2, however, may halt elongation through apparent stimulation of cell wall stiffening [22,26], and can even promote programmed cell death or necrosis. Accordingly, Cosgrove [34] has suggested that fine regulation of steady-state levels of ROS are essential for proper cell elongation.
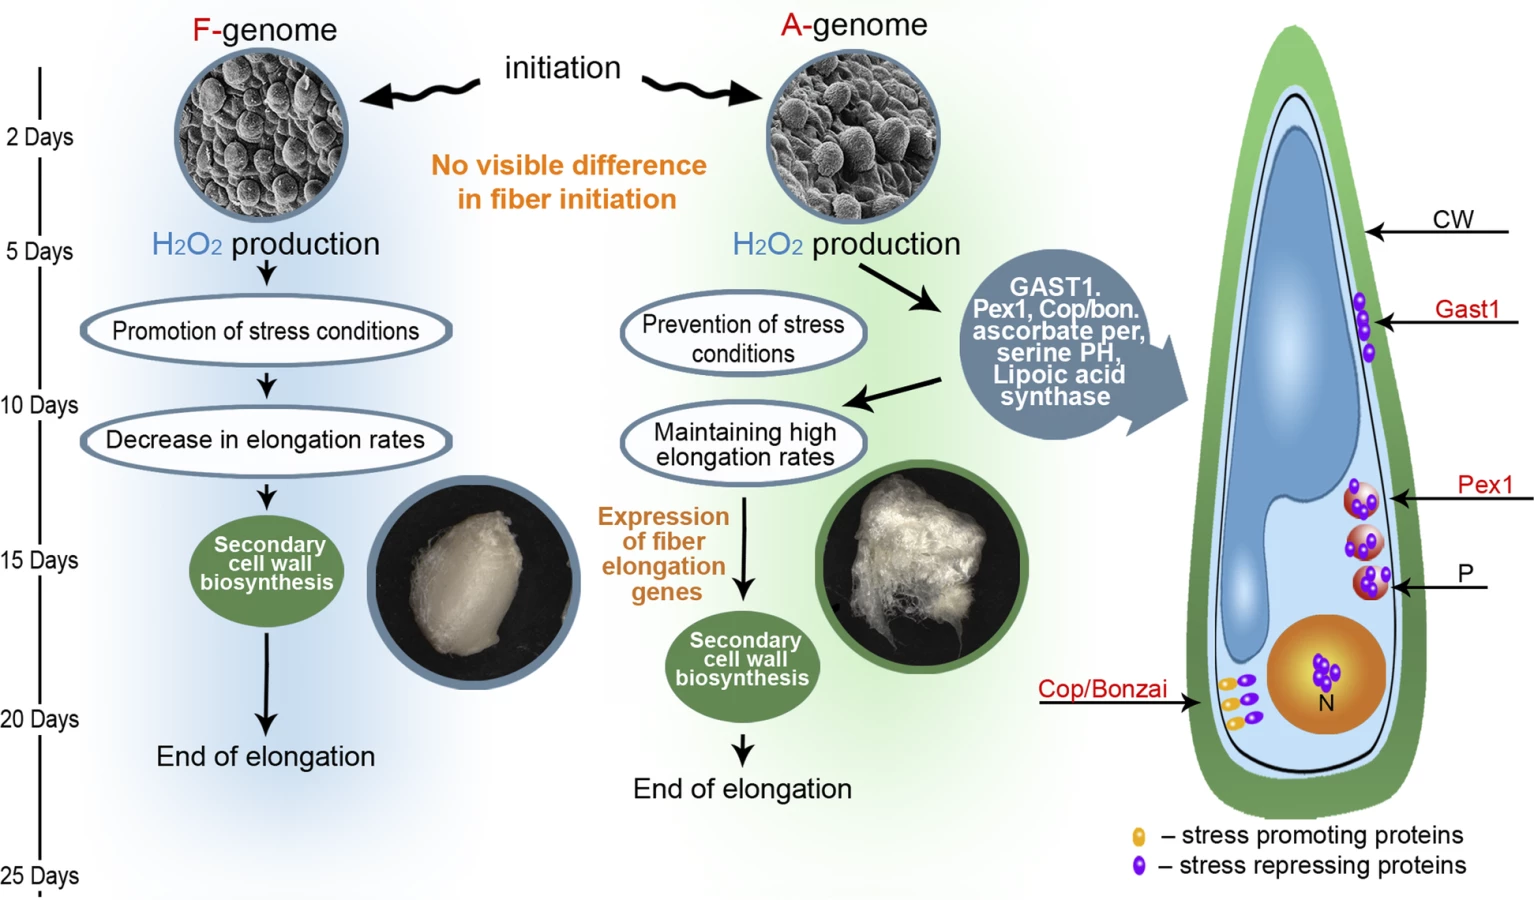
Our model suggests that the curtailed developmental duration of the F-genome, relative to the A-genome, is caused by an insufficient control of cellular H2O2 and other ROS levels, eventually arresting elongation and leading to an induction of secondary cell wall synthesis. In cotton, H2O2 has been suggested to function as a developmental signal in the differentiation of secondary walls in cultivated G. hirsutum fibers, evidenced by the fact that inhibition of H2O2 production or scavenging existing H2O2 from the system prevents cell wall differentiation [35]. Similarly, exogenous addition of H2O2 prematurely promotes secondary cell wall formation in young fibers [35]. Our data are consistent with this interpretation and with earlier secondary cell wall formation in the F-genome, as indicated by expression differences between F - and A - genomes for the cellulose synthase A1 (CeSA1) gene. CeSA1 is a well-characterized gene involved in fiber secondary cell wall synthesis, and CeSA1 RNA expression levels have been suggested as a marker for secondary wall cell synthesis [30]. In our study, CeSA1 increases its expression earlier in the F-genome than in the A-genome (Figure S1–S1J).
Similar to the F-genome, early elongating fibers of the A-genome are exposed to increasing levels of H2O2. A-genome fibers, however, did not show increased RNA levels of stress-related genes, suggesting that this lineage evolved a metabolism to modulate ROS levels by either functional or regulatory means. At the functional level, genes controlling antioxidant levels, including ascorbate peroxidase, glutathione peroxidase and lipolic acid synthase, are all upregulated in A-genome fibers relative to those of the F-genome. These proteins scavenge and detoxify H2O2 and other ROS. Recently, comparative proteomic analysis between regular and mutant cotton fibers showed the involvement of a cotton ascorbate peroxidase in H2O2 homeostasis during cell development [36].
An additional example of possible functional modulation of H2O2 levels is offered by the protein GAST1, which we studied further. GAST1 is a cysteine-rich, gibberellin-induced gene, initially identified in tomato, which is suppressed in the GA-deficient mutant gib-1 and for which expression coincides with stem elongation [37]. It belongs to a protein family, identified in many plant species, that is suggested to play a role in many biological processes, including cell division, cell elongation (promotion and inhibition), transition to flowering, root development, fruit development and defense (summarized in [27]). RNAi suppression of expression in one member of this family, GIP2, was shown to inhibit stem elongation under low-temperature conditions in transgenic Petunia [38]. Wigoda et al. [27] have shown that GIP2 overexpression promotes stem and corolla elongation. In the same study they showed that GAST2 is expressed in the cell-wall and suggested that its putative redox-active cysteines may act as antioxidants that control H2O2 levels at this site. The fact that our cotton GAST1 has the same conserved 12 cysteine residues as other GAST-like proteins (data not shown), is expressed mainly in the fiber [21] (as shown in Figure S3), and is not expressed in the fuzz-like F-genome fibers and the D-genome fibers make it a promising gene for further investigation.
At the regulatory level, we explored two candidate genes further using quantitative RT-PCR and a broader sampling of species and accessions having either short or long fibers. The first is the Cop1/BONZAI (Cop1) gene. Cop1 is a calcium-dependent, membrane-binding protein isolated from a mutant with a temperature-dependent growth defect and an enhanced disease resistance phenotype in Arabidopsis [39,40]. Further study revealed that Cop1 acts as a repressor of a disease resistance (R) gene and as such it prevented programmed cell death (PCD) processes (i.e. hypersensitive response) [28]. It is unclear if the F-genome fiber is undergoing early “classical” PCD processes, indicated by the fact that “cell death processes” was not a statistically overrepresented biological process in our study. Cop1, however, was ranked in our microarray analysis as the single most upregulated gene in the A-genome, relative to the F-genome, among thousands of differentially expressed genes, making it as a strong candidate for controlling stress-like processes. Further quantitative RT-PCR analyses using a broader sampling of species with short and long fibers yielded comparable results (Figure 3), lending additional support to the hypothesis of a role for Cop1in fiber elongation.
A second regulatory gene studied further is Pex1. This gene is one of a cascade of peroxisome biogenesis genes that previously have been shown to be induced by H2O2 in both plant and animal cells, and have been suggested to assist in restoration of cellular redox balance in response to wounding and infection with an avirulent pathogen [29]. Pex1 encodes a member of the AAA (ATPases associated with diverse cellular activities) superfamily of ATPases that have been suggested to mediate lipid and/or membrane addition to peroxisome membranes, facilitating peroxisome growth [41,42]. As shown in Figure 3, Pex1 mRNA levels are strongly correlated with fiber length.
To verify the hypothesized roles of GAST1, Cop1, and Pex1 genes, additional functional analyses are needed in growing fiber-cells, including in vivo measurements of H2O2 levels and elongation rates in developing fibers derived from F - and A-genome species. These studies comprise one focus of our ongoing efforts. In addition, hundreds of other genes were differentially expressed between A - and F-genome fibers, including many known to be involved in fiber development, suggesting that in addition to cellular redox balance, other biological processes may be involved in the evolution of spinnable fibers. Thus, additional work is necessary to reveal the nature and relative contributions of these additional processes to fiber transformation during evolution.
The results presented here add perspective to results from our previous comparative study of fiber development in wild Gossypium species [15], in which wild A - and F-genome species exhibited continued fiber elongation up until approximately 21 DPA. One possible reconciliation between this observation and the present study is that the timing of the period of maximum fiber elongation is a key developmental difference. Some species with short fibers showed a nearly linear rate of elongation over most of the growth period, whereas long-linted species exhibited more complex growth curves. Another possibility is that the most important factor in determining final fiber length is the absolute fiber elongation rate and not the relative percentage of mature length (as [15]), suggesting that the effects of H2O2 and other ROS are not qualitative, but instead are quantitative, operating via effects on amount of elongation.
The present study implicates several molecular mechanisms as being involved in the evolution of elongated epidermal seed trichomes, providing the foundation for later human domestication of an important crop plant. Why elongated epidermal seed hairs evolved is a matter of speculation. Perhaps fibers evolved to aid in bird dispersal, as suggested [43]. This hypothesis gains credibility from observations by J. Stewart (unpubl.) of a bird's nest in NW Puerto Rico that contained numerous seeds of feral G. hirsutum, as well as a collection of G. darwinii from a finch's nest in the Galapagos Islands (J. Wendel, unpubl.). One might also speculate that fibers serve to inhibit germination unless there is sufficient moisture to saturate the fibers; should germination occur following a light rain, there might not be sufficient water for subsequent survival of the seedling. A related possibility is that seed hairs function as “biological incubators” to facilitate germination only when ecological conditions are appropriate, by recruiting particular microbial communities under appropriate moisture regimes. Irrespective of the veracity of these speculations, one outcome is that these processes set the stage for human domestication millions of years later.
We show that a major heterochronic change included prolongation of an ancestral developmental program, and coincidently, this change pre-adapted the derivative cell type for human domestication. At least in part it appears that avoidance or delay of stress-like processes may underlie the increased elongation in A-genome fiber development compared to F-genome fiber, in conjunction with an increased ability to modulate cellular redox balance in the growing cell. These evolutionary processes, occurring as they did perhaps several million years ago [9,10], may be interpreted as the key events responsible for the domestication of one of the world's most important crop plants.
Materials and Methods
Plant material and RNA preparation.
Plants from Gossypium herbaceum (A1), G. longicalyx (F), G. hirsutum var TM1 (AD1), G. hirsutum var yucatanense (wild AD1), G. arboreum (A2) and G. raimondii (D5) were grown in three separate replicates of 4–8 plants in the Horticulture Greenhouses at Iowa State University. For each replicate, ovules were excised, immediately frozen in liquid nitrogen, and stored in −80 °C. At each developmental time point, fibers were isolated from ovules using a liquid nitrogen/glass bead shearing approach [21]. Initially, ovules were visually inspected for cell damage and the fibers were inspected for contaminating tissue. Subsequent RNA extractions were performed using a hot borate method [44]. RNA quality was confirmed on a BioAnalyzer (Agilent, Palo Alto, CA).
RNA amplification, labeling, and microarray hybridizations.
For microarray analyses, an indirect labeling procedure of amplified aminoallyl a-RNA was used as described [21]. Two dyes, Cy3 and Cy5, were coupled to 8 μg aliquots of aRNA using the Post-Labelling Aminoallyl-aRNA CyDye reactive dyes (Amersham Biosciences). A newly designed cotton long-oligonucleotide microarray containing over 22,827 probes derived from deep EST sampling of diverse tissues and organs [20] was used. All hybridizations, slide scanning and normalizations were performed as described previously [21].
Experimental design and statistical analysis.
A balanced developmental loop design for microarray analysis was performed (Figure 1B). For G. herbaceum (A1) and G. longicalyx (F), four fiber developmental time-points, 5, 10, 20 and 25 DPA were sampled. Within each species, hybridizations were performed between each pair of consecutive developmental stages by labeling one with Cy5 and the other with Cy3, and by closing the loop with a comparison of 25 and 5 DPA. In addition, 2 hybridizations were done between species at each time-point, using a dye swap for each pair. With three biological replications and 16 slides each, we generated gene expression data from a total of 48 microarrays. Statistical analyses were performed using R and SAS statistical software (code available upon request).
Log transformed, median-normalized values of the 22,827 genes were examined for expression differences between each fiber developmental stage within and between species. We considered a standard mixed linear model for the data for each gene as:


The 22,827 p-values from each comparison were converted to q-values using the method of Storey and Tibshirani [45]. These q-values were used to identify the number of differentially expressed genes for a given comparison when controlling the false discovery rate (FDR) at various levels.
Blast2GO (http://www.blast2go.de/) was used to identify biochemical pathways involved in a given comparison and to calculate the statistical significance of each pathway. Blast2GO includes the Gossip package [46] for statistical assessment of annotation differences between two sets of sequences, using Fisher's exact test for each GO term. FDR controlled p-values (FDR < 0.05) were used for the assessment of differentially significant metabolic pathways.
Quantitative RT-PCR analyses.
Amplified aRNA was used as a template for first strand cDNA synthesis with the Super-script II pre-amplification system reverse transcriptase kit (Gibco BRL Life Technologies) at 42 °C according to the supplier's instructions. Specific primers with amplicons for quantitative PCR were designed based on the sequence derived from the EST sequence corresponding to the candidate and reference genes (Table S3). We used the RNA helicase gene (Q9ZS12) as the reference gene. RNA helicase gene was found to be equally expressed in different developing fibers as well in other plant tissues [21]. cDNA was used as the template for quantitative PCR amplification using the GeneAmp 5700 Sequence Detection System (PE Biosystems) with SYBR Green Master Mix containing AmpliTaq Gold, according to the manufacturer's instructions (PE Biosystems). Standards containing logarithmically increasing known levels of cDNA were run with each set of primers for normalization. All real-time PCR products were confirmed by sequencing.
Supporting Information
Zdroje
1. DoebleyJStecAHubbardL
1997
The evolution of apical dominance in maize.
Nature
386
485
488
2. WangHNussbaum-WaglerTLiBZhaoQVigourouxY
2005
The origin of the naked grains of maize.
Nature
436
714
719
3. LiCBZhouALSangT
2006
Rice domestication by reducing shattering.
Science
311
1936
1939
4. KonishiSIzawaTLinSYEbanaKFukutaY
2006
An SNP caused loss of seed shattering during rice domestication.
Science
312
1392
1396
5. FraryANesbittTCFraryAGrandilloSvan der KnaapE
2000
fw2.2: A quantitative trait locus key to the evolution of tomato fruit size.
Science
289
85
88
6. SimonsKJFellersJPTrickHNZhangZCTaiYS
2006
Molecular characterization of the major wheat domestication gene Q.
Genetics
172
547
555
7. DoebleyJ
2006
Unfallen grains: how ancient farmers turned weeds into crops.
Science
312
1318
1319
8. KimHJTriplettBA
2001
Cotton fiber growth in planta and in vitro. Models for plant cell elongation and cell wall biogenesis.
Plant Physiol
127
1361
1366
9. BrubakerCLBourlandFMWendelJF
1999
The origin and domestication of cotton.
SmithCWCothrenJT
In:
Cotton: origin, history, technology and production
New York
John Wiley and Sons
3
31
10. WendelJF
1995
Cotton.
In:
SimmondsNSmarttJ
Evolution of crop plants
London
Longman
358
366
11. WendelJFCronnRC
2002
Polyploidy and the evolutionary history of cotton.
Adv Agron
78
159
186
12. WendelJFAlbertVA
1992
Phylogenetics of the cotton genus (Gossypium)-character-state weighted parsimony analysis of chloroplast-DNA restriction site data and its systematic and biogeographic implications.
Syst Bot
17
115
143
13. SeelananTSchnabelAWendelJF
1997
Congruence and consensus in the cotton tribe (Malvaceae).
Syst Bot
22
259
290
14. DillehayTDRossenJAndresTCWilliamsDE
2007
Preceramic adoption of peanut, squash, and cotton in northern Peru.
Science
316
1890
1893
15. ApplequistWLCronnRWendelJF
2001
Comparative development of fiber in wild and cultivated cotton.
Evol Dev
3
3
17
16. NaithaniSCRama RaoNSinghYD
1982
Physiological and biochemical changes associated with cotton fibre development.
Physiol Plantarum
54
225
229
17. BeasleyCA
1979
Cellulose content in fibers of cottons which differ in their lint lengths and extent of fuzz.
Physiol Plantarum
45
77
82
18. MeinertMCDelmerDP
1977
Changes in biochemical composition of the cell wall of the cotton fiber during development.
Plant Physiol
59
1088
1097
19. HutchJBLeeBJS
1958
Notes from the East African Herbarium: IX. A new species of Gossypium from central Tan-ganyika.
Kew Bull
13
221
223
20. UdallJAFlagelLECheungFWoodwardAWHovavR
2007
Spotted cotton oligonucleotide microarrays for gene expression analysis.
BMC Genomics
8
81
21. HovavRUdallJAHovavERappRAFlagelL
2007
A majority of genes are expressed in the single-celled seed trichome of cotton.
Planta
227
319
329
22. RodriguezAAGrunbergKATaleisnikEL
2002
Reactive oxygen species in the elongation zone of maize leaves are necessary for leaf extension.
Plant Physiol
129
1627
1632
23. ForemanJDemidchikVBothwellJHFMylonaPMiedemaH
2003
Reactive oxygen species produced by NADPH oxidase regulate plant cell growth.
Nature
422
442
446
24. FrySC
1998
Oxidative scission of plant cell wall polysaccharides by ascorbate-induced hydroxyl radicals.
Biochemical J
332
507
515
25. LiszkayAvan der ZalmESchopferP
2004
Production of reactive oxygen intermediates (O2˙—, H2O2, and ˙OH) by maize roots and their role in wall loosening and elongation growth.
Plant Physiol
136
3114
3123
26. SchopferP
1996
Hydrogen peroxide-mediated cell-wall stiffening in vitro in maize coleoptiles.
Planta
199
43
49
27. WigodaNBen-NissanGGranotDSchwartzAWeissD
2006
The gibberellin-induced, cysteine-rich protein GIP2 from Petunia hybrida exhibits in planta antioxidant activity.
Plant J
48
796
805
28. YangSHYangHJGrisafiPSanchatjateSFinkGR
2006
The BON/CPN gene family represses cell death and promotes cell growth in Arabidopsis.
Plant J
45
166
179
29. Lopez-HuertasECharltonWLJohnsonBGrahamIABakerA
2000
Stress induces peroxisome biogenesis genes.
EMBO J
19
6770
6777
30. ArpatABWaughMSullivanJPGonzalesMFrischD
2004
Functional genomics of cell elongation in developing cotton fibers.
Plant Mol Biol
54
911
929
31. ShiYHZhuSWMaoXZFengJXQinYM
2006
Transcriptome profiling, molecular biological, and physiological studies reveal a major role for ethylene in cotton fiber cell elongation.
Plant Cell
18
651
664
32. TaliercioEWBoykinD
2007
Analysis of gene expression in cotton fiber initials.
BMC Plant Biol
7
22
33. WuYLiewellynDJWhiteRRuggieroKAl-GhaziY
2007
Laser capture microdissection and cDNA microarrays used to generate gene expression profiles of rapidly expanding fibre initials cells on surface of cotton ovules.
Planta
226
1475
1490
34. CosgroveDJ
1999
Enzymes and other agents that enhance cell wall extensibility.
Annual Rev Plant Physiol Plant Mol Biol
50
391
417
35. PotikhaTSCollinsCCJohnsonDIDelmerDPLevineA
1999
The involvement of hydrogen peroxide in the differentiation of secondary walls in cotton fibers.
Plant Physiol
119
849
858
36. LiHBQinYMPangYSongWQMeiWQ
2007
A cotton ascorbate peroxidase is involved in hydrogen peroxide homeostasis during fibre cell development.
New Phytol
175
462
471
37. ShiLFOlszewskiNE
1998
Gibberellin and abscisic acid regulate GAST1 expression at the level of transcription.
Plant Mol Biol
38
1053
1060
38. Ben-NissanGLeeJYBorohovAWeissD
2004
GIP, a Petunia hybrida GA-induced cysteine-rich protein: a possible role in shoot elongation and transition to flowering.
Plant J
37
229
238
39. HuaJGrisafiPChengSHFinkGR
2001
Plant growth homeostasis is controlled by the Arabidopsis BON1 and BAP1 genes.
Genes Dev
15
2263
2272
40. JambunathanNSianiJMMcNellisTW
2001
A humidity-sensitive Arabidopsis copine mutant exhibits precocious cell death and increased disease resistance.
Plant Cell
13
2225
2240
41. FaberKNHeymanJASubramaniS
1998
Two AAA family peroxins, PpPex1p and PpPex6p, interact with each other in an ATP-dependent manner and are associated with different subcellular membranous structures distinct from peroxisomes.
Mol Cell Biol
18
936
943
42. KielJHilbrandsREVan der KleiIJRasmussenSWSalomonsFA
1999
Hansenula polymorpha Pex1p and Pex6p are peroxisome-associated AAA proteins that functionally and physically interact.
Yeast
15
1059
1078
43. FryxellPA
1979
The natural history of the cotton tribe
College Station (Texas)
Texas A&M University Press
44. WilkinsTASmartLB
1996
Isolation of RNA from plant tissue.
In:
PaK
A laboratory guide to RNA isolation, analysis, and synthesis
New York
Wiley-Liss
21
41
45. StoreyJDTibshiraniR
2003
SAM thresholding and false discovery rates for detecting differential gene expression in DNA microarrays.
In:
ParmigianiGGarrettESIrizarryRAZegerSL
The analysis of gene expression data: methods and software
New York
Springer
272
290
46. BluthgenNBrandKCajavecBSwatMHerzelH
2005
Biological profiling of gene groups utilizing Gene Ontology.
Genome Inform Ser Workshop Genome Inform
16
106
115
Štítky
Genetika Reprodukční medicínaČlánek vyšel v časopise
PLOS Genetics
2008 Číslo 2
Nejčtenější v tomto čísle
- Unintentional miRNA Ablation Is a Risk Factor in Gene Knockout Studies: A Short Report
- Ready for Her Close-Up: An Interview with Elaine Strass
- The Evolution of Spinnable Cotton Fiber Entailed Prolonged Development and a Novel Metabolism