
Did Genetic Drift Drive Increases in Genome Complexity?
Mechanisms underlying the dramatic patterns of genome size variation across the tree of life remain mysterious. Effective population size (Ne) has been proposed as a major driver of genome size: selection is expected to efficiently weed out deleterious mutations increasing genome size in lineages with large (but not small) Ne. Strong support for this model was claimed from a comparative analysis of Neu and genome size for ≈30 phylogenetically diverse species ranging from bacteria to vertebrates, but analyses at that scale have so far failed to account for phylogenetic nonindependence of species. In our reanalysis, accounting for phylogenetic history substantially altered the perceived strength of the relationship between Neu and genomic attributes: there were no statistically significant associations between Neu and gene number, intron size, intron number, the half-life of gene duplicates, transposon number, transposons as a fraction of the genome, or overall genome size. We conclude that current datasets do not support the hypothesis of a mechanistic connection between Ne and these genomic attributes, and we suggest that further progress requires larger datasets, phylogenetic comparative methods, more robust estimators of genetic drift, and a multivariate approach that accounts for correlations between putative explanatory variables.
Published in the journal:
. PLoS Genet 6(8): e32767. doi:10.1371/journal.pgen.1001080
Category:
Research Article
doi:
https://doi.org/10.1371/journal.pgen.1001080
Summary
Mechanisms underlying the dramatic patterns of genome size variation across the tree of life remain mysterious. Effective population size (Ne) has been proposed as a major driver of genome size: selection is expected to efficiently weed out deleterious mutations increasing genome size in lineages with large (but not small) Ne. Strong support for this model was claimed from a comparative analysis of Neu and genome size for ≈30 phylogenetically diverse species ranging from bacteria to vertebrates, but analyses at that scale have so far failed to account for phylogenetic nonindependence of species. In our reanalysis, accounting for phylogenetic history substantially altered the perceived strength of the relationship between Neu and genomic attributes: there were no statistically significant associations between Neu and gene number, intron size, intron number, the half-life of gene duplicates, transposon number, transposons as a fraction of the genome, or overall genome size. We conclude that current datasets do not support the hypothesis of a mechanistic connection between Ne and these genomic attributes, and we suggest that further progress requires larger datasets, phylogenetic comparative methods, more robust estimators of genetic drift, and a multivariate approach that accounts for correlations between putative explanatory variables.
Introduction
The vast array of genome sizes is a pattern that begs for explanation [1], [2]. Haploid (1C) genome size (measured either in base pairs or mass, where 106 Kb ≈1 picogram) spans eight orders of magnitude: the known eukaryotic range is ≈2,249–978,000,000 Kb [3], while Archaea and Bacteria range from 491–5,751 Kb and 76–13,034 Kb, respectively [4].
Lynch and colleagues [5]–[7] have argued strongly for a central role for nonadaptive processes such as mutation and drift in the evolution of genome size and complexity. In contrast to proposed neutral and adaptive models of genome size evolution (see, e.g. [8], [9]), they outline a model positing that mutations increasing genome size are slightly deleterious. Under this model, lineages differ in effective population size (Ne) and, as a result, differ in the efficacy with which natural selection will counteract genome expansion. Thus, lineages with small Ne will experience drift towards larger genomes [7]. As support for their argument, they presented a comparative analysis of roughly 30 taxa, ranging from bacteria to angiosperms, fungi, and mammals. Among these taxa, they reported a statistically significant negative relationship between Neu (a composite parameter including effective population size and nucleotide mutation rate) and genome size. Strikingly, the relationship was quite strong: 66% of the variation in genome size was explained by Neu [7]. This is truly an astounding result, considering the widely divergent selective regimes, life histories, and modes of reproduction found across these diverse organisms.
The Lynch & Conery model has sparked intense interest and >330 citations. Some objections on theoretical and methodological grounds have been voiced. Charlesworth and Barton [10] point out that Ne is confounded with many different aspects of organismal biology (e.g., developmental rate, body size), and thus that both Ne and genome size may be correlated effects of one or more other causal factors. Daubin and Moran [11] outline several objections, including that taxon differences in mutation rates make Neu a poor proxy for Ne that estimates of Ne from silent-site nucleotide diversity in bacteria (as in [7]) are skewed by population subdivision and cryptic species, and further that such Ne estimates are overly sensitive to recent evolutionary history. Nevertheless, the idea that Ne drives genome size and complexity seems to have gained acceptance [12]–[14], with some going so far as to characterize it as “the principal explanatory framework for understanding the evolution of genome organization” ([12], p. 303).
Here, we argue that such conclusions are premature without phylogenetic comparative analyses of genome size evolution. When species are used as data points, relationships between raw values of any two traits (e.g., Ne and genome size) are difficult to interpret, as shared phylogenetic history means that assumptions of statistical independence are likely to be violated [15]–[17]. Special methods are required to recover independence of observations and to test for evolutionary associations between traits. Frequently, conventional (nonphylogenetic) analyses overestimate the strength of the association between traits relative to phylogenetic methods [18]. In an extreme case, a strong correlation in the raw data can be driven by a single association at the base of the phylogenetic tree, e.g., it can reflect a single instance of correlated change in the traits, followed by uncorrelated changes and/or stasis in trait values during subsequent evolutionary history (Figure 1). In this study, we revisit the Lynch & Conery dataset with a phylogenetic perspective, taking advantage of new phylogenetic data and analysis tools.

Results
Model fitting
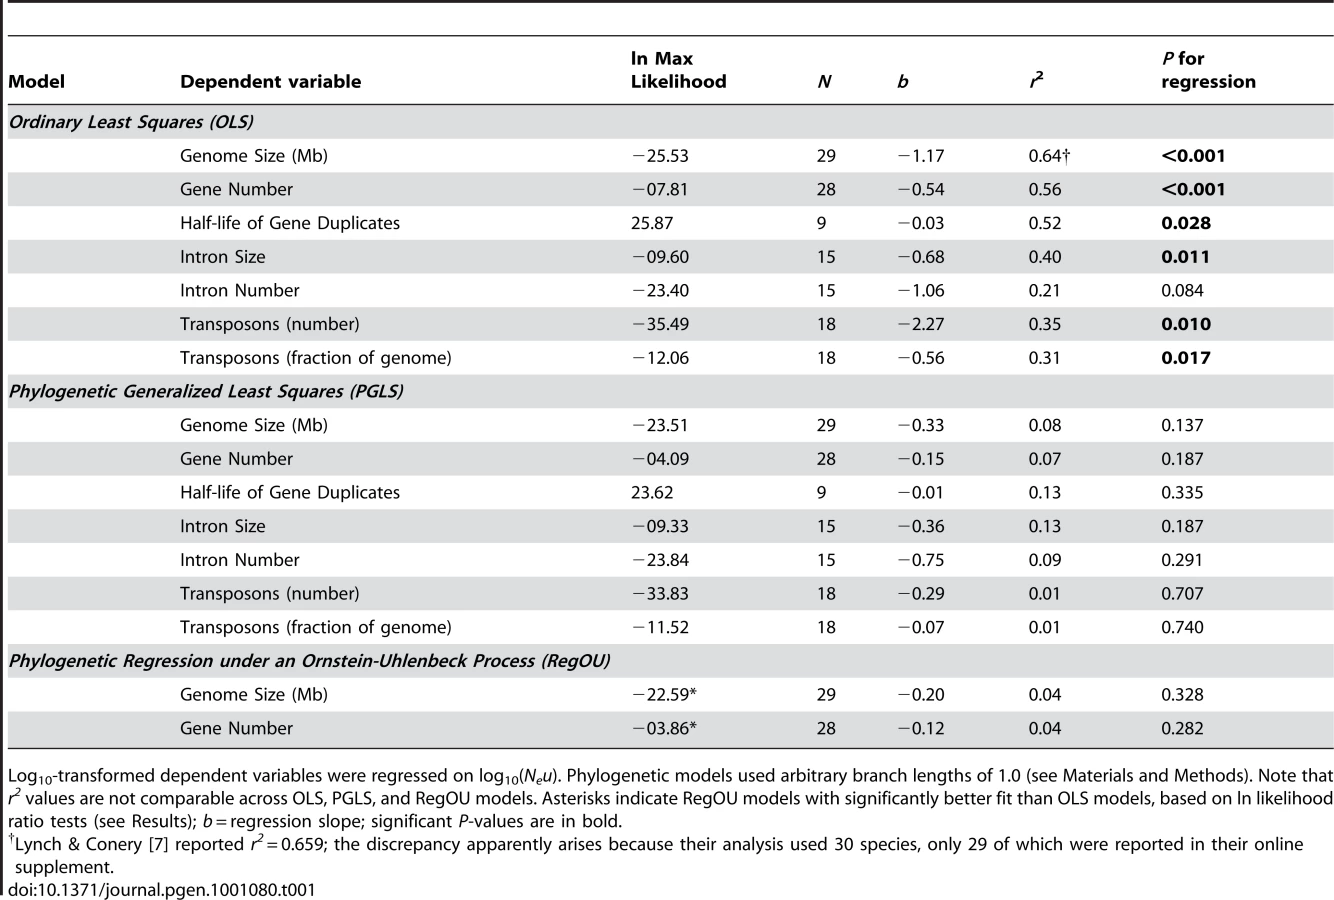
A phylogenetic topology and reconstruction of genome sizes is presented in Figure 2, illustrating that close relatives have similar genome sizes. Initial simple linear regressions of genome size on Neu explored four branch length models and found that the phylogenetic generalized least squares (PGLS) model with all branches = 1.0 provided a better fit than the nonphylogenetic ordinary least squares (OLS) model (Table 1). Subsequent analyses therefore used branch lengths of 1.0. For all variables except intron number, phylogenetic models (PGLS) exhibited better fit than nonphylogenetic (OLS) models (Table 1). For genome size and gene number, estimation of the Ornstein-Uhlenbeck transformation parameter d indicated substantial phylogenetic signal (d = 1.31 and 1.16, respectively), and the resulting RegOU models fit significantly better than the OLS models (ln likelihood ratio tests (LRTs), χ2 = 5.88, P = 0.015 and χ2 = 7.90, P = 0.005, respectively). In comparing the two phylogenetic models, the RegOU model did not produce significantly better fit vs. PGLS (LRTs, χ2 = 1.84, P = 0.175 and χ2 = 0.46, P = 0.498 for genome size and gene number, respectively).
![Phylogeny for the species in the Lynch & Conery dataset <em class="ref">[<b>7</b>]</em>, with a reconstruction of genome sizes.](https://pl-master.mdcdn.cz/media/cache/media_object_image_large/media/image/dbc48632aaf64b4a89272a870bbfbc70.png)
Phylogenetic regressions do not detect relationships between Neu and genomic attributes
Although there were strong negative relationships between Neu and six of the seven genomic attributes in nonphylogenetic regressions, the patterns disappeared when phylogenetic models were applied (Table 1). For example, the strong negative relationship between Neu and genome size (OLS, P<0.001, Figure 3A) was replaced with a nonsignificant relationship under better-fitting phylogenetic models (PGLS, P = 0.137, Figure 3B; RegOU, P = 0.328). Similar patterns were evident for gene number, the half-life of gene duplicates, intron size, intron number, transposon number, and transposon fraction (Table 1).
![Relationship between <i>N<sub>e</sub>u</i> and genome size across 22 eukaryotic and 7 prokaryotic species from the dataset of Lynch & Conery <em class="ref">[<b>7</b>]</em>.](https://pl-master.mdcdn.cz/media/cache/media_object_image_large/media/image/1b98aa2b662a2583d9a00d15338b0d60.png)
Discussion
Accounting for phylogenetic history substantially altered the perceived strength of the relationship between Neu and genomic attributes. In phylogenetic analyses, there were no consistent evolutionary associations between Neu and gene number, intron size, intron number, the half-life of gene duplicates, transposon number, transposons as a fraction of the genome, or overall genome size. Thus, a phylogenetically controlled reanalysis of the Lynch & Conery dataset [7] does not support the conclusion that Ne drives genome size patterns across the tree of life.
The few existing comparative analyses of more phylogenetically restricted datasets either do not support or provide only equivocal support for the Lynch & Conery model. Whitney et al. [19] conducted a phylogenetically controlled analysis of 205 species of seed plants and found no association between Ne and genome size. Kuo et al. [20] analyzed 42 paired bacterial genomes, using the efficacy of purifying selection in coding regions to quantify genetic drift. Bacterial taxa experiencing greater levels of genetic drift – implying a smaller evolutionary Ne – had smaller genomes, a pattern opposite that predicted by the Lynch & Conery model as articulated in [7]. Finally, in putative support of the model, Yi & Streelman [21] reported a significant negative relationship between Ne and genome size in a phylogenetically corrected analysis of 33 species of ray-finned fish. However, this analysis has been challenged as artifactual. Gregory & Witt [22] argue that Pleistocene population bottlenecks and polyploidy shaped both Ne and genome size of fishes in such a way as to generate a non-causal correlation between Ne and genome size in this particular dataset.
Future investigations of the role of genetic drift in determining genome size across the tree of life would benefit from several approaches. First, utilizing phylogenetic comparative methods, for which we advocate here, is an important step towards drawing robust inferences from species-level comparative analyses. Second, larger datasets would certainly increase confidence in our interpretations. While statistically nonsignificant, we note the relationships between Neu and genomic attributes (Table 1) are negative and thus are at least qualitatively consistent with the Lynch & Conery model, suggesting that power may be an issue. Furthermore, given that the Neu estimates in the current analysis required sequence data, species with small genomes relative to averages within clades are likely overrepresented; thus it would be important to ensure that species with large genomes are included in future analyses. Third, future studies would benefit from more robust estimates of genetic drift, as Neu estimated from silent-site diversity (as in [7] and the present reanalysis) has several undesirable properties. Because the mutation rate u differs among lineages [11], [23], [24], using Neu as a proxy for Ne could obscure any relationship between Ne and genome size. Further, Ne estimated from silent-site diversity may signal the effects of recent evolutionary events more than the long-term history under which genome size evolved [11]. Ka/Ks ratios (ratios of nonsynonymous to synonymous substitutions per site) are a promising alternative to Neu for estimating genetic drift [11], [20]. Finally, genome size is a complex trait that is unlikely to be explained by univariate analyses [10]. Phylogenetic comparative methods should be combined with multivariate models that are capable of distinguishing the contributions of highly correlated predictor variables. A recent analysis [19] is a step in the right direction: plant outcrossing rate and Ne were simultaneously examined in a multiple regression analysis of phylogenetically independent contrasts, allowing the partial contribution of each variable to be characterized. To make further progress on the population genetics of genome size and complexity, we clearly need phylogenetic comparative analyses of large datasets capable of distinguishing the contributions of Ne and its multiple correlates, including body size, developmental rate, and metabolic rate.
Materials and Methods
Data sources
Data on Neu and genome sizes for 22 eukaryotic and 7 prokaryotic species were obtained from the Supporting Online Material of [7]. For a subset of these species, data on gene number, intron size, intron number, and the half-life of gene duplicates were also obtained from the same source. Data on total transposon number and fraction of the genome occupied by transposons were obtained directly from M. Lynch; these data combine counts of LTR, non-LTR, and DNA transposons and correspond to the fourth panel of Fig. 4 of [7]. All traits were log10 transformed prior to analysis; for total transposon number and transposon fraction, constants of 1.0 and 0.01, respectively, were added prior to log-transformation.
Phylogeny construction
A composite tree for the species was constructed in Mesquite v. 2.71 [25] based on phylogenetic trees reported in [26]–[28]. As a visual heuristic, genome sizes were traced onto the phylogeny using the Parsimony Ancestral States method [29] with an assumption that all branch lengths equal 1.0.
Phylogenetic comparative analyses
All dependent variables were regressed on Neu using REGRESSIONv2.m [30] running in MATLAB v. 7.9.0. Three types of models were examined: ordinary least squares (OLS), phylogenetic generalized least squares (PGLS), and phylogenetic regression under an Ornstein-Uhlenbeck process (RegOU) [30], [31]. OLS is traditional ‘nonphylogenetic’ regression, which in effect assumes a star phylogeny in which all species are equally unrelated, and corresponds to the Neu vs. genome size analysis reported in [7]. PGLS assumes that residual variation among species is correlated, with the correlation given by a Brownian-motion like process along the specified phylogenetic tree (topology and branch lengths). PGLS is functionally equivalent to Felsenstein's [15] phylogenetically independent contrast method [31]. Finally, the RegOU model estimates (via restricted maximum likelihood) the strength of phylogenetic signal in the residual variation simultaneously with the regression coefficients; the former is given by d, the Ornstein-Uhlenbeck transformation parameter. An OU evolutionary model is typically used to model the effects of stabilizing selection around an optimum [30]. When d = 0, there is no phylogenetic signal in the residuals from the regression model; when d is significantly greater than 0, significant phylogenetic signal exists [30], [32].
Following [33], starter branch lengths corresponding to all branches = 1.0, Grafen's arbitrary lengths, Pagel's arbitrary lengths, and Nee's arbitrary lengths were compared in PGLS and RegOU regressions of genome size on Neu. Based on their likelihoods, the models with all branches = 1.0 achieved the best fit, and thus these branch lengths were used in all subsequent phylogenetic analyses. Model selection for each variable then proceeded in two steps. First, we compared the likelihoods of the PGLS model and the OLS model, with a higher likelihood taken as evidence of a better-fitting model. Second, we used ln likelihood ratio tests (LRTs) to compare the RegOU model with the PGLS and OLS models with 1 d.f. [30]. Given the issue of small sample sizes (see [32]) for most dependent variables and the fact that RegOU models require estimation of an extra parameter, RegOU models were examined only for genome size and gene number.
Zdroje
1. BaackEJ
WhitneyKD
RiesebergLH
2005 Hybridization and genome size evolution: timing and magnitude of nuclear DNA content increases in Helianthus homoploid hybrid species. New Phytol 167 623 630
2. GregoryTR
2005 The evolution of the genome. Amsterdam Elsevier
3. GregoryTR
NicolJA
TammH
KullmanB
KullmanK
2007 Eukaryotic genome size databases. Nucleic Acids Res 35 D332 D338
4. Center for Biological Sequence Analysis 2010 Genome Atlas Database. Lyngby, Denmark Technical University of Denmark http://www.cbs.dtu.dk/services/GenomeAtlas/.
5. LynchM
2007 The origins of genome architecture. Sunderland, , Massachusetts, USA Sinauer Associates
6. LynchM
2007 The frailty of adaptive hypotheses for the origins of organismal complexity. Proc Natl Acad Sci USA 104 8597 8604
7. LynchM
ConeryJS
2003 The origins of genome complexity. Science 302 1401 1404
8. BennettMD
LeitchIJ
2005 Genome size evolution in plants.
GregoryTR
The evolution of the genome Amsterdam Elsevier 89 162
9. PetrovDA
2002 Mutational equilibrium model of genome size evolution. Theor Pop Biol 61 531 544
10. CharlesworthB
BartonN
2004 Genome size: Does bigger mean worse? Curr Biol 14 R233 R235
11. DaubinV
MoranNA
2004 Comment on “The origins of genome complexity”. Science 306 978a
12. KooninEV
2009 Evolution of genome architecture. Int J Biochem Cell Biol 41 298 306
13. PrithamEJ
2009 Transposable elements and factors influencing their success in eukaryotes. J Hered 100 648 655
14. YiSV
2006 Non-adaptive evolution of genome complexity. Bioessays 28 979 982
15. FelsensteinJ
1985 Phylogenies and the comparative method. Am Nat 125 1 15
16. GarlandTJr
BennettAF
RezendeEL
2005 Phylogenetic approaches in comparative physiology. J Exp Biol 208 3015 3035
17. HarveyPH
PagelMD
1991 The comparative method in evolutionary biology. Oxford Oxford University Press
18. GarlandT
MidfordPE
IvesAR
1999 An introduction to phylogenetically based statistical methods, with a new method for confidence intervals on ancestral values. Am Zool 39 374 388
19. WhitneyKD
BaackEJ
HamrickJL
GodtMJW
BarringerBC
2010 A role for nonadaptive processes in plant genome size evolution? Evolution 64 2097 2109
20. KuoCH
MoranNA
OchmanH
2009 The consequences of genetic drift for bacterial genome complexity. Genome Res 19 1450 1454
21. YiS
StreelmanJT
2005 Genome size is negatively correlated with effective population size in ray-finned fish. Trends Genet 21 643 646
22. GregoryTR
WittJDS
2008 Population size and genome size in fishes: a closer look. Genome 51 309 313
23. DrakeJW
CharlesworthB
CharlesworthD
CrowJF
1998 Rates of spontaneous mutation. Genetics 148 1667 1686
24. LynchM
2010 Rate, molecular spectrum, and consequences of human mutation. Proc Natl Acad Sci USA 107 961 968
25. MaddisonWP
MaddisonDR
2009 Mesquite: a modular system for evolutionary analysis. Version 2.71. http://mesquiteproject.org
26. GuptaRS
2000 The phylogeny of proteobacteria: relationships to other eubacterial phyla and eukaryotes. FEMS Microbiol Rev 24 367 402
27. MaddisonDR
SchulzK-S
2007 The Tree of Life Web Project. http://tolweb.org
28. SongJ
XuQK
OlsenR
LoomisWF
ShaulskyG
2005 Comparing the Dictyostelium and Entamoeba genomes reveals an ancient split in the Conosa lineage. PLoS Comp Biol 1 e71 doi:10.1371/journal.pcbi.0010071
29. MaddisonWP
1991 Squared-change parsimony reconstructions of ancestral states for continuous-valued characters on a phylogenetic tree. Syst Zool 40 304 314
30. LavinSR
KarasovWH
IvesAR
MiddletonKM
GarlandT
2008 Morphometrics of the avian small intestine compared with that of nonflying mammals: A phylogenetic approach. Physiol Biochem Zool 81 526 550
31. GarlandT
IvesAR
2000 Using the past to predict the present: Confidence intervals for regression equations in phylogenetic comparative methods. Am Nat 155 346 364
32. BlombergSP
GarlandT
IvesAR
2003 Testing for phylogenetic signal in comparative data: Behavioral traits are more labile. Evolution 57 717 745
33. HutcheonJM
GarlandT
2004 Are megabats big? J Mamm Evol 11 257 276
34. MidfordPE
GarlandTJr
MaddisonW
2002 PDAP:PDTREE package for Mesquite, version 1.00. http://mesquiteproject.org/pdap_mesquite/
35. GarlandT
HarveyPH
IvesAR
1992 Procedures for the analysis of comparative data using phylogenetically independent contrasts. Syst Biol 41 18 32
Štítky
Genetika Reprodukční medicínaČlánek vyšel v časopise
PLOS Genetics
2010 Číslo 8
Nejčtenější v tomto čísle
- Identification of the Bovine Arachnomelia Mutation by Massively Parallel Sequencing Implicates Sulfite Oxidase (SUOX) in Bone Development
- Common Inherited Variation in Mitochondrial Genes Is Not Enriched for Associations with Type 2 Diabetes or Related Glycemic Traits
- A Model for Damage Load and Its Implications for the Evolution of Bacterial Aging
- Did Genetic Drift Drive Increases in Genome Complexity?