-
Články
Top novinky
Reklama- Vzdělávání
- Časopisy
Top články
Nové číslo
- Témata
Top novinky
Reklama- Videa
- Podcasty
Nové podcasty
Reklama- Kariéra
Doporučené pozice
Reklama- Praxe
Top novinky
ReklamaDNA Methylation Dynamics in Human Induced Pluripotent Stem Cells over Time
Epigenetic reprogramming is a critical event in the generation of induced pluripotent stem cells (iPSCs). Here, we determined the DNA methylation profiles of 22 human iPSC lines derived from five different cell types (human endometrium, placental artery endothelium, amnion, fetal lung fibroblast, and menstrual blood cell) and five human embryonic stem cell (ESC) lines, and we followed the aberrant methylation sites in iPSCs for up to 42 weeks. The iPSCs exhibited distinct epigenetic differences from ESCs, which were caused by aberrant methylation at early passages. Multiple appearances and then disappearances of random aberrant methylation were detected throughout iPSC reprogramming. Continuous passaging of the iPSCs diminished the differences between iPSCs and ESCs, implying that iPSCs lose the characteristics inherited from the parent cells and adapt to very closely resemble ESCs over time. Human iPSCs were gradually reprogrammed through the “convergence” of aberrant hyper-methylation events that continuously appeared in a de novo manner. This iPS reprogramming consisted of stochastic de novo methylation and selection/fixation of methylation in an environment suitable for ESCs. Taken together, random methylation and convergence are driving forces for long-term reprogramming of iPSCs to ESCs.
Published in the journal: . PLoS Genet 7(5): e32767. doi:10.1371/journal.pgen.1002085
Category: Research Article
doi: https://doi.org/10.1371/journal.pgen.1002085Summary
Epigenetic reprogramming is a critical event in the generation of induced pluripotent stem cells (iPSCs). Here, we determined the DNA methylation profiles of 22 human iPSC lines derived from five different cell types (human endometrium, placental artery endothelium, amnion, fetal lung fibroblast, and menstrual blood cell) and five human embryonic stem cell (ESC) lines, and we followed the aberrant methylation sites in iPSCs for up to 42 weeks. The iPSCs exhibited distinct epigenetic differences from ESCs, which were caused by aberrant methylation at early passages. Multiple appearances and then disappearances of random aberrant methylation were detected throughout iPSC reprogramming. Continuous passaging of the iPSCs diminished the differences between iPSCs and ESCs, implying that iPSCs lose the characteristics inherited from the parent cells and adapt to very closely resemble ESCs over time. Human iPSCs were gradually reprogrammed through the “convergence” of aberrant hyper-methylation events that continuously appeared in a de novo manner. This iPS reprogramming consisted of stochastic de novo methylation and selection/fixation of methylation in an environment suitable for ESCs. Taken together, random methylation and convergence are driving forces for long-term reprogramming of iPSCs to ESCs.
Introduction
DNA methylation is an important epigenetic modification and is a key component in normal differentiation, development and disease [1]–[3]. Expression of tissue-specific genes, such as Oct-4 [4], Nanog [5], Sry (sex determining region on Y chromosome) [6] and MyoD [7], are induced by spatio-temporal demethylation during development. DNA methylation therefore specifically varies depending on tissue types and cell linage [2], indicating that information regarding cell type-specific DNA methylation profiles can enable the identification and validation of cell types. Transformation of iPSCs from somatic cells requires a process of epigenetic reprogramming promoted by transient ectopic expression of defined transcription factors expressed in ESCs [8]–[11]. Human iPSCs are considered to be powerful resources in regenerative medicine because of their potential of pluripotency and avoidance of rejection of their derivatives by the immune system, and for ethical issues as well [12]. Although iPSCs show pluripotency, they have different propensities for differentiation in mouse models [13]. Human iPSCs also exhibit donor cell-specific gene expression [14], [15]. Moreover, iPSCs possess inherited DNA methylation states as epigenetic memories from parent cells [15]–[17], suggesting that these memories influence different propensities of the iPSCs. On the other hand, continuous passaging of mouse iPSCs reduces differences from each other in gene expression profiles [15]. Epigenome-wide analysis started to be used in this field [18], [19], and differentially methylated regions have been identified among human iPSCs, their parent cells and ESCs [17], [20]. Aberrant epigenetic reprogramming has recently been reported in human iPSCs [21], [22]. However, these analyses were limited to the use of a small number of cells as a source for generation of iPS cells. Moreover, human iPSCs have only been analyzed at a single point of passage. Therefore, it has not been clarified whether human iPSCs generated from various types of cells are dissimilar from each other at different points during passage; how continuous passaging of human iPSCs influences the differences between iPSCs and ESCs; and how aberrant methylation in human iPSCs during passaging. To address these issues, we compared the epigenetic and transcriptional states of human iPSCs derived from five cell types of different origins during passage, and found random aberrant hyper-methylation at different points of adaptation into ESCs.
Results
Establishment of human iPSCs
Human iPSCs derived from fetal lung fibroblasts (MRC5), amnion (AM), endometrium (UtE), placental artery endothelium (PAE) and menstrual blood cells (Edom) were independently established in our laboratory by retroviral infection of 4 genes (OCT-3/4, SOX2, c-MYC, and KLF4) (Figure 1A, 1B and Table S1). These cells clearly showed human ES-like characters in terms of morphology; cell-surface antigens; gene expression of stem cell markers; teratoma formation in which these cells differentiated to various tissues including neural tissues (ectoderm), cartilage (mesoderm), and epithelial tissues (endoderm); growth (more than 20 passages); and DNA methylation patterns at OCT-3/4 and NANOG promoter regions (Figures S1, S2, S3). Short tandem repeat (STR) analysis showed clonality between the respective iPSC lines and their parent cells (Table S2). Silencing of transgenes and normal karyotypes of iPSCs were also confirmed (Figure S4 and Table S3).
Fig. 1. Pluripotent stem cells are significantly more hyper-methylated than their parent cells. 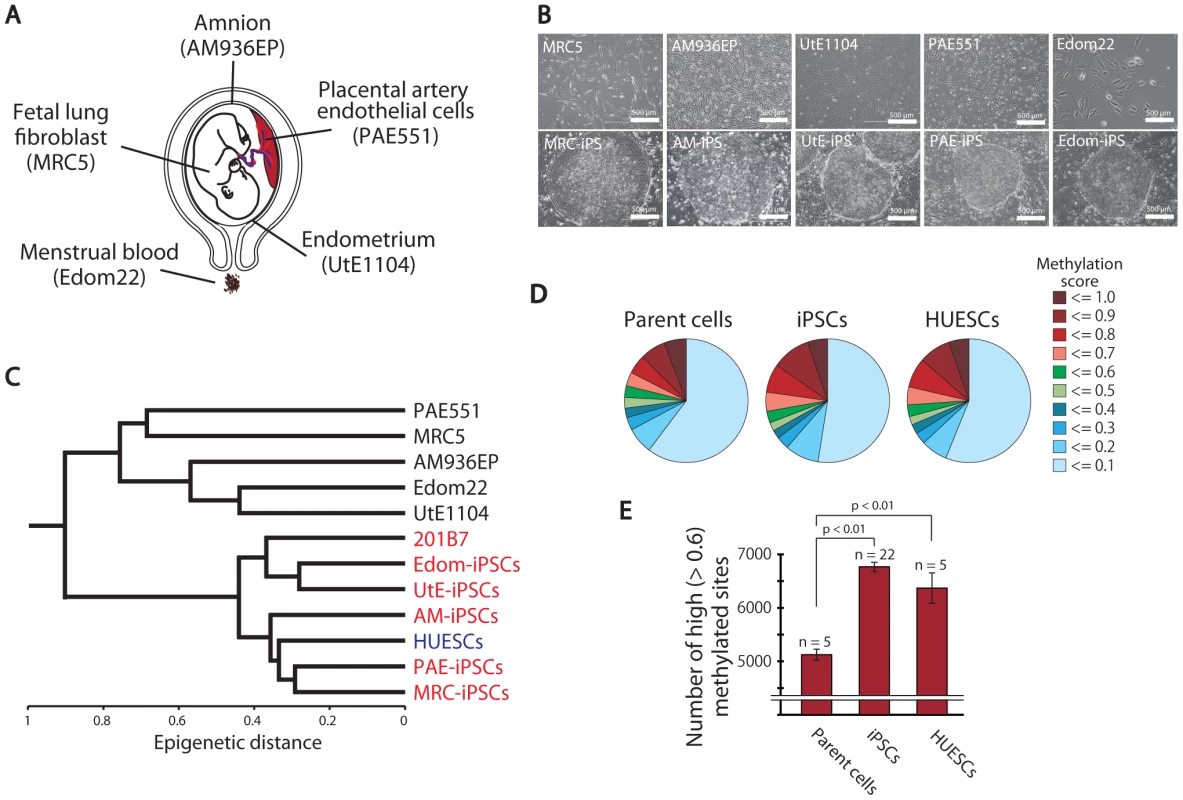
(A) The human cell origins used for generation of iPSCs. (B) Morphology of the parent cells (upper panels) and iPSCs (lower panels). (C) Unsupervised hierarchical clustering analysis based on DNA methylation. (D) Distribution of 24,273 CpG sites with their methylation scores in the parent cells, iPSCs and ESCs. (E) The average number of high (>0.6) methylated CpG sites. The iPSCs have more highly methylated sites than the parent cells. Analysis of DNA methylation profiles
To investigate the dynamics of DNA methylation in pluripotent stem cells, we examined 5 ESC lines (HUESCs) [23], [24], 22 iPSC lines, their parent cells and 201B7, using Illumina's Infinium HumanMethylation27 BeadChip. In total, 24,273 CpG sites in 13,728 genes were analyzed, along with 33 human cell lines (Table S1). The iPSC line “201B7” was generated from human skin fibroblasts [8]. Quantitative scores of DNA methylation levels were obtained as β-values determined from the Illumina analysis, ranging from “0”, for completely unmethylated, to “1”, for completely methylated. We also performed genome-wide gene expression analysis using the Agilent Whole Human Genome Microarray chips. As assessed by unsupervised hierarchical clustering analysis and scatter plot of DNA methylation and gene expression data, human iPSCs could be clearly discriminated from their parent cells and were similar to ESCs (Figure 1C and Figure S5). The distribution of DNA methylation levels shows that the degree of global methylation in pluripotent stem cells was higher compared to the parent cells (Figure 1D, 1E), suggesting that a global gain of DNA methylation occurs during reprogramming.
Identification of stem cell-specific differentially methylated regions (DMRs)
For further analysis, we defined DMR as representing a CpG site whose score differed 0.3 points or more from the β-value between the two groups. By comparison among ESCs (average from 5 lines), iPSCs (average from 22 lines), and parent cells (average from 5 lines), about 90% of the CpG sites (17,572 sites) examined did not show differential methylation among ESCs, iPSCs and parent cells (Figure 2A), suggesting that only a small number of the CpG sites is affected during reprogramming. The number of the CpG sites has been reported to be larger by genome-wide analysis [21].
Fig. 2. Defining stem cell-specific DMRs as novel epigenetic iPS markers. 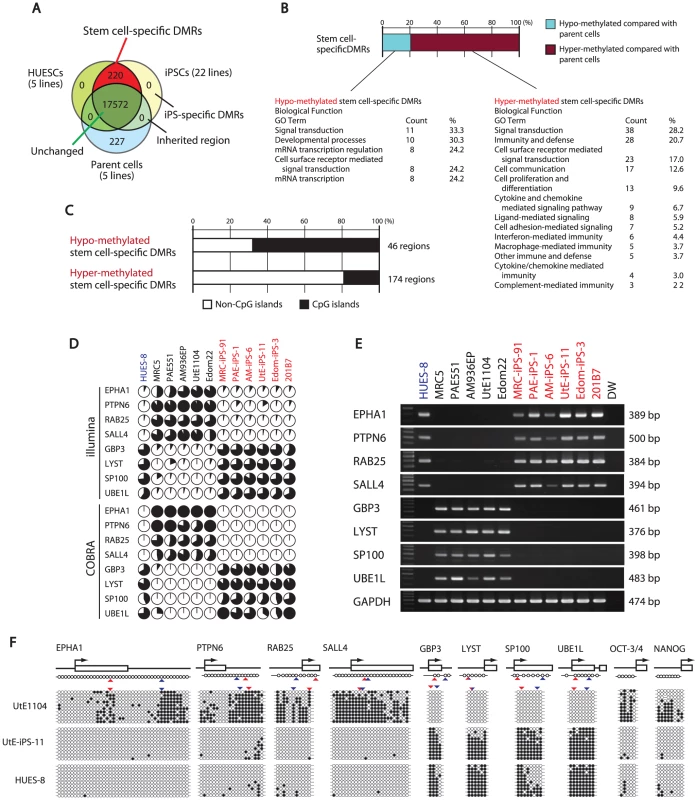
(A) Venn-like diagram showing overlapping CpG sites among ESCs, iPSCs and their parent cells. The 220 overlapping sites are stem cell-specific differentially methylated regions (DMRs). Notably, neither overlapping iPSCs-specific DMRs nor inherited regions in iPSCs from the parent cells were observed. (B) Proportion of the hyper- and hypo-methylated stem cell-specific DMRs and GO analysis. Approximately 80% of the regions were hyper-methylated in iPSCs, compared with that of the parent cells. (C) Proportion of the regions associated with CpG islands and non-CpG islands in the hypo-methylated stem cell-specific DMRs. The hypo-methylated regions were biased to CpG islands, whereas the hyper-methylated regions were biased to non-CpG islands. (D) DNA methylation levels in the 8 representative genes determined by Illumina Infinium HumanMethylation27 assay and Bio-COBRA. These 8 genes were defined as SS-DMRs with significant changes of expression and were described in Table S6. The relative amount of methylated and unmethylated DNA ratio is indicated as the black and white area, respectively, in the pie chart. (E) Expression of the 8 genes. Expression of the 8 genes had an inverse correlation with DNA methylation level. (F) Bisulfite sequencing analysis of the 8 genes in endometrial cells (UtE1104), UtE-iPS-11 and HUES-8 cells. (Top) Schematic diagram of the genes. Arrows, open boxes and open circles represent transcription start site, first exon and position of CpG sites, respectively. (Bottom) Open and closed circles indicate unmethylated and methylated sites, respectively. Red and blue arrowheads represent the position of CpG sites in Infinium assay and COBRA assay, respectively. We then identified 220 sites that are pluripotent stem cell-specific DMRs (Figure 2A). The 174 sites (79.5%) of the stem cell-specific DMRs had significantly higher methylation levels in iPSCs/ESCs when compared to the parent cells (Figure 2B). Approximately 80% of the DMRs between the iPSCs and their parent cells changed to a “hyper-methylated” state from a “hypo-methylated” state in iPSCs. In contrast, 45 sites of the stem cell-specific DMRs are hypo-methylated in iPSCs/ESCs, compared with the parent cells. Gene ontology analysis indicates that the hypo-methylated stem cell-specific DMRs especially included genes related to mRNA transcription regulation (Figure 2B). Interestingly, the majority of the hypo-methylated stem cell-specific DMRs were located on CpG islands, whereas the majority of the hyper-methylated stem cell-specific DMRs were located on non-CpG islands (Figure 2C). No iPS-specific DMRs were detected. We extracted 3,123 sites that are differentially methylated in one or more parent-specific iPSCs, compared to their parent cells, because DMRs are dependent on parent cell types (Figure S6). These DMRs are here designated as stem cell-required DMRs. Distribution analysis of the stem cell-required DMRs revealed a dispersed pattern rather than specific localization on the genome (Figure S7A).
From the combined gene expression and DNA methylation data, we chose 27 genes in the stem cell-specific DMRs showing more than a 5-fold change in expression of human iPSCs/ESCs, as compared with those in the parent cells (Table S4). Nine genes with hypo-methylated stem cell-specific DMRs were found in the group “genes significantly expressed in iPSCs/ESCs,” and 17 genes with hypo-methylated stem cell-specific DMRs belonged to the category “low expression or silenced in iPSCs/ESCs”. In addition, the methylation state and gene expression in EPHA1, PTPN6, RAB25, SALL4, GBP3, LYST, SP100 and UBE1L were confirmed by quantitative combined bisulfite restriction analysis (COBRA) [25] (Figure 2D), RT-PCR (Figure 2E) and bisulfite sequencing (Figure 2F).
We also extracted genes with stem cell-required DMRs exhibiting high expression or suppression in human iPSCs/ESCs (Tables S5, S6). Interestingly, gene ontology analysis of the genes with stem cell-required DMRs showed that genes in the transcription factor category were detected only in the hypo-methylated stem cell-required DMRs (Table S7). The top 20 transcription factor genes with hypo-methylated stem cell-required DMRs exhibiting high expression in human iPSCs are summarized in Table 1 and include OCT-4/3 (also known as POU5F1), SALL4, SOX8, ZIC5, and FOXD1.
Tab. 1. List of the top 20 out of 82 transcription factor genes with hypo-methylated stem cell-required DMRs exhibiting “high” expression in human iPS cells. 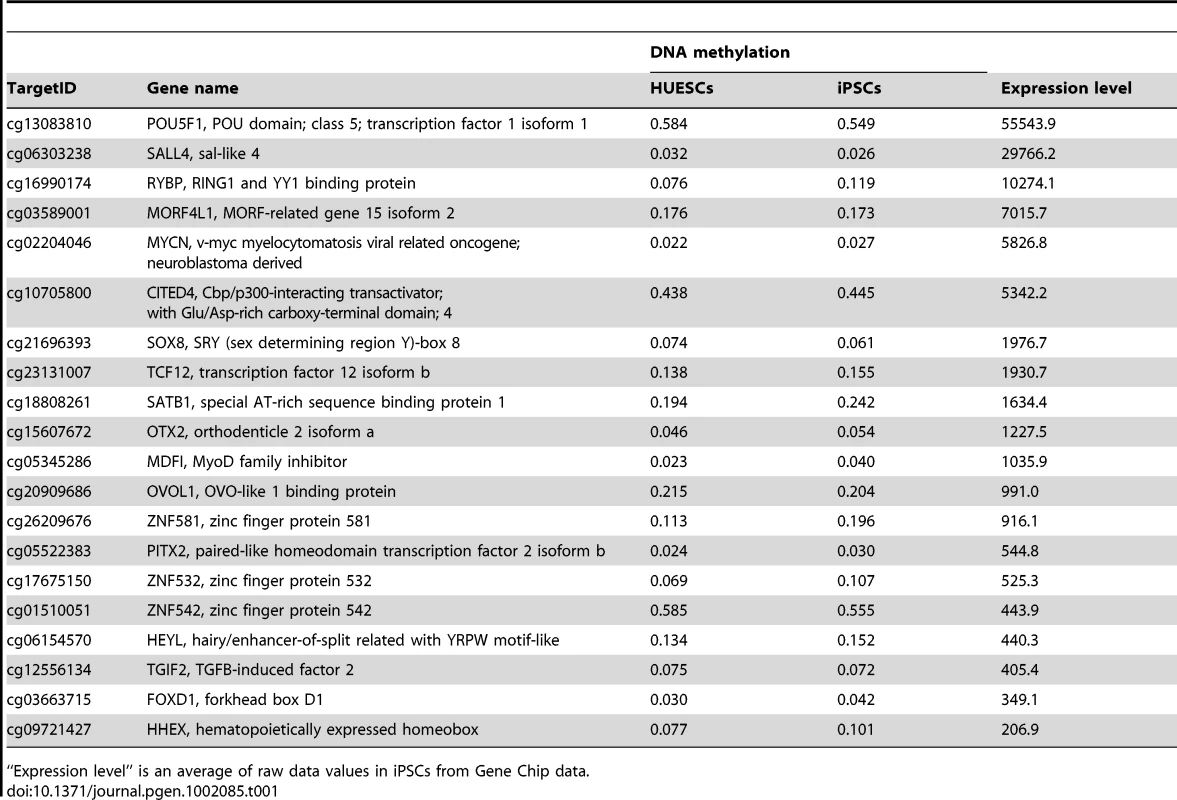
“Expression level” is an average of raw data values in iPSCs from Gene Chip data. Aberrant and inherited methylation in iPSCs
Few changes in DNA methylation were detected between iPS and ES cells and these were not consistent among the different iPS lines (Figure 2A, Figures S6, S7). In further analyses, we compared the DNA methylation states of each iPSC line or each parent cell line with that of ESCs (averaged value) (Figure 3A). For the whole genome, the number of DMRs between ESCs and iPSCs (ES-iPS-DMRs) varied in the 22 iPSC lines (Figure 3B). A comprehensive analysis of methylation in ESCs and iPSCs identified 1,459 ES-iPS-DMRs covering 1,260 genes that were differentially methylated in one or more iPSC lines. ES-iPS-DMRs are composed of aberrant (iPS-specific) methylation sites, in comparison with ESCs and inherited methylation sites from the parent cells. The number of inherited sites as well as aberrant sites varied among iPSCs. Analysis of the ES-iPS-DMRs on each chromosome showed a characteristic distribution of the ES-iPS-DMRs on the X chromosome in XX-iPSCs (Figure 3B and Figure S8). Female XX-iPSCs demonstrate a tendency to carry a large number of ES-iPS-DMRs on the X chromosome, but male XY-iPSCs had few ES-iPS-DMRs on the X chromosome (Figure 3B, lower panel). While no ES-iPS-DMRs overlapped for all the iPSCs (Figure 2A), 20 ES-iPS-DMRs overlapped in more than 15 out of 22 lines (Figure 3C, inset). These 20 ES-iPS-DMRs include the genes for MPG (N-methylpurine-DNA glycosylase isoform b), FZD10 (frizzled 10), IREX2 (iroquois homeobox protein 2) and ZNF248 (zinc finger protein 248), which are highly associated with aberrant methylation during reprogramming. Distribution analysis of the ES-iPS-DMRs across the genome did not show any specific localization (Figure S9). We further compared overlapping ES-iPS-DMRs in reference to a genome-wide methylation analysis [21], and found that 72 gene promoters overlapped between our data and that of Lister et al..
Fig. 3. Aberrant methylation in human iPSCs. 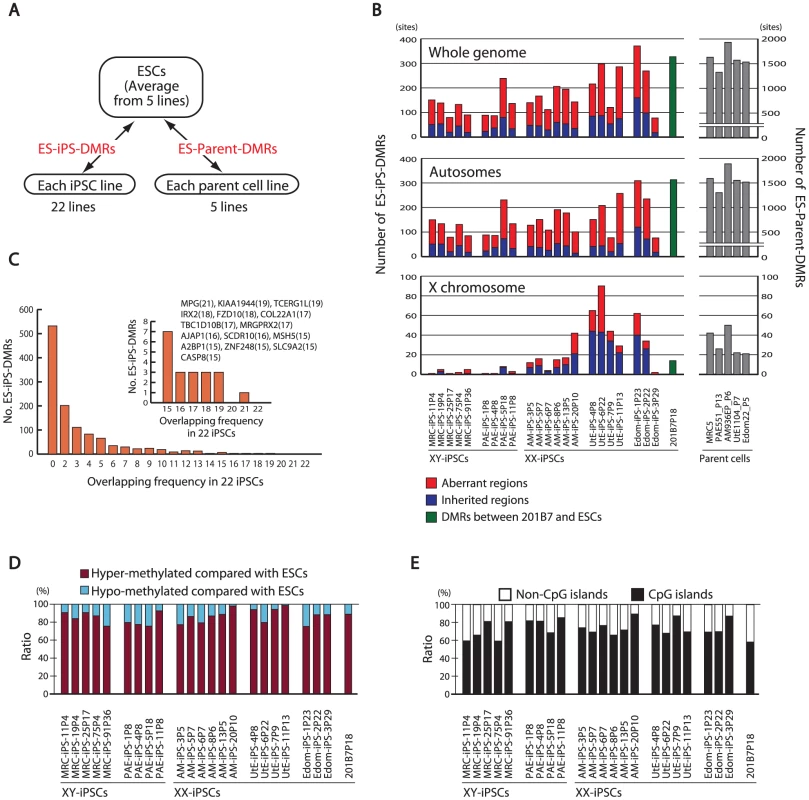
(A) Comparison of DNA methylation states of each iPSC line or each parent cell line with that of ESCs. The DMRs between ESCs and iPSCs are designated as ES-iPS-DMRs, and the DMRs between ESCs and parent cells are designated as ES-parent-DMRs. (B) The number of ES-iPS-DMRs and ES-parent-DMRs on whole genome (top), autosomes (middle) and X chromosome (bottom). Ratios of number of inherited regions in iPSCs from parent cells (blue) and aberrant regions in iPSCs that differ from ESCs and parent cells (red) in the ES-iPS-DMRs are shown in bars. Female iPSCs were demonstrated to carry high number of EiP-DMRs on X chromosome. (C) Number of overlapped ES-iPS-DMRs frequency in iPSCs. No overlapping ES-iPS-DMRs in all 22 iPSC lines. (Inlet) A small number of overlapping ES-iPS-DMRs of the frequency from 15 to 22. Overlapping frequency of each gene is indicated in parentheses. (D) Proportion of the hyper- and hypo-methylated ES-iPS-DMRs. More than 75% of the ES-iPS-DMRs were hyper-methylated in iPSCs. (E) Proportion of the ES-iPS-DMRs associated with CpG islands and non-CpG islands in ach iPSC line. ES-iPS-DMRs were biased to CpG islands. More than 70% of the ES-iPS-DMRs were hyper-methylated in each iPSC (Figure 3D), indicating that the iPSC genome is more methylated than the ESC genome. In addition, the majority of the ES-iPS-DMRs were located on CpG islands (Figure 3E), suggesting that aberrant methylation is biased towards CpG islands.
Effect of long-term culture on DNA methylation status in iPSCs
We investigated the effect of continuous passaging on the DNA methylation profile of human iPSCs. To address the effect, we subjected 7 iPSC lines to additional rounds of passaging under identical culture conditions, and obtained genomic DNA and RNA at passage 4 (P4) to P40 for DNA methylation and gene expression. The number of the ES-iPS-DMRs ranged from 80 in MRC-iPS-25 to 286 in UtE-iPS-11 at early passage (P10 to P20), whereas the number of the ES-iPS-DMRs dramatically decreased in all lines at late passage (P30 to P40) (Figure 4A, upper-left panel). The number of inherited and aberrant sites decreased to 30 and 70, respectively, at P30 to P40 (Figure 4A, upper-center and right panels). These decreases in the numbers of ES-iPS-DMRs indicate that iPSCs have become closer to ESCs in their DNA methylation profiles. In particular, XX-iPSC lines (AM-iPS-8, UtE-iPS-4 and -11, and Edom-iPS-2) showed decreases in the number of ES-iPS-DMRs with passaging. The XY-iPSC lines, such as MRC-iPS-25 and PAE-iPS-1, had only a small number of ES-iPS-DMRs. The number of ES-iPS-DMRs continued to decrease to approximately 100 ES-iPS-DMRs containing 30 inherited sites. Intriguingly, few ES-iPS-DMRs on the X chromosome were detected in XY-iPSCs throughout the passaging. In contrast, the number of ES-iPS-DMRs in XX-iPSCs ranged from 10 to 70 at the early passage (P4 to P20), and decreased to zero after P30 (Figure 4A, lower panels). We also investigated the effect of continuous passaging on the DNA methylation profile of the parent cells (UtE1104 and Edom22) (Figure 4B). The number of the DMRs between ESCs and parent cells (ES-parent-DMRs) increased with passaging. In addition, we also confirmed that the transgenes were silenced at each passage (Figure 4C and Figure S4), indicating that the decreasing number of the ES-iPS-DMRs in iPSCs occurred in the transgene-independent phase.
Fig. 4. Effect of long-term cultivation on ES-iPS-DMRs. 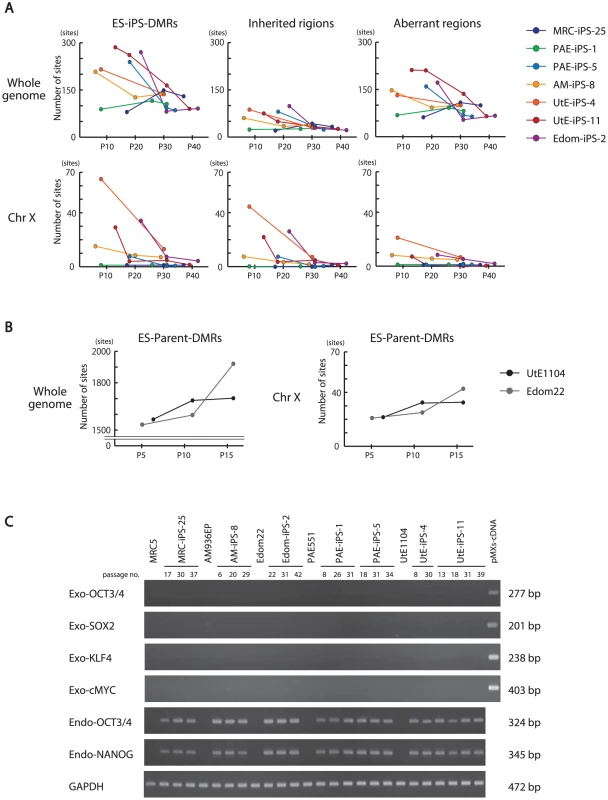
(A) Decrease in the number of the ES-iPS-DMRs with continuous passaging. Upper panels show change of the number of the ES-iPS-DMRs (left), the inherited regions (middle) and aberrant regions (right) on whole genome. Lower panels show change in the number of the ES-iPS-DMRs (left), inherited regions (middle) and aberrant regions (right) on X chromosome. The number of the ES-iPS-DMRs in XX-iPSCs approached zero with continuous passaging on X chromosome. In contrast, XY-iPSCs had few ES-iPS-DMRs on X chromosome throughout the passages. (B) The number of the ES-parent-DMRs with continuous passaging. (C) No expression of the transgenes in iPSCs at each passage was detected by RT-PCR. Comparative analysis of ES-iPS-DMRs dynamics
We then compared each ES-iPS-DMRs with passaging. The UtE-iPS-11 had 286 ES-iPS-DMRs at P13, 194 sites at P18, 110 sites at P31, and 55 sites at P39. The ES-iPS-DMRs detected at P13 decreased with passaging (blue bars in upper-left panel in Figure 5A). Interestingly, 66 de novo ES-iPS-DMRs appeared at P18, while at P13 these sites showed no differences between UtE-iPS-11 and ESCs (orange bars in upper-left panel in Figure 5A). These 66 ES-iPS-DMRs also decreased with passaging (P31 and P39). The 29 additional ES-iPS-DMRs at P31 also appeared and decreased with passaging (P39) (green bars in upper-left panel in Figure 5A) and 16 ES-iPS-DMRs at P39 (red bar in upper-left panel in Figure 5A) appeared. Rapid appearance and gradual disappearance of ES-iPS-DMRs was a recurring theme, but the number of newly-appearing ES-iPS-DMRs decreased with passaging (Figure 5A, upper-left panel). The same change in ES-iPS-DMRs occurred on the X chromosome, but the number of the ES-iPS-DMRs approached zero at early passages (Figure 5A, upper-center panel). Intriguingly, this change also occurred at inherited sites, which was contrary to our expectations. The inherited sites also repeatedly appeared and disappeared, and the number of newly-appearing inherited sites decreased with passaging (Figure 5A, upper-right panel). The term “inherited” is here used to mean the same methylation state found in iPSCs and their parent cells, but the “inherited” regions behaved like “aberrant” regions that had multiple appearances and disappearances. These multiple appearances/disappearances of ES-iPS-DMRs were observed in all iPSC lines regardless of parental cell type. The ES-parent-DMRs were also analyzed. The de novo ES-parent-DMRs appeared as well as the ES-iPS-DMRs, but did not decrease with passaging (Figure 5B).
Fig. 5. Number of the ES-iPS-DMRs and ES-parent-DMRs with passaging. 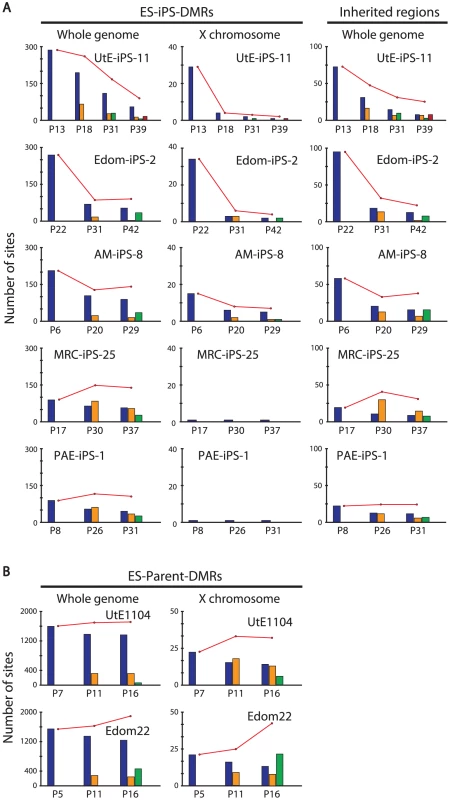
(A) Number of the ES-iPS-DMRs with passaging. Red line plots indicate total number of the ES-iPS-DMRs. Blue bars indicate the number of the ES-iPS-DMRs that appeared at the earliest passage. Orange, green and red bars indicate the number of the ES-iPS-DMRs that appeared secondarily at later passages. Appearance/disappearance of the ES-iPS-DMRs and inherited regions were repeated, but the number of newly-appeared ES-iPS-DMRs was decreased with passaging. (B) Number of the ES-parent-DMRs with passaging. Blue bars indicate the number of the ES-parent-DMRs at P5 (or P7). Orange and green bars indicate de novo ES-parent-DMRs at P11 and P16, respectively. Most ES-iPS-DMRs were hyper-methylated in iPSCs
ES-iPS-DMRs can be categorized into two groups: a, hyper-methylated and b, hypo-methylated sites in iPSCs, as compared with ESCs. ES-iPS-DMRs that disappeared at the last passage (P39) (blue bars in Figure 5) in both UtE-iPS-11 and Edom-iPS-2 were extracted, and each methylation score of the extracted ES-iPS-DMRs is shown (Figure 6, upper and middle panels). To compare methylation scores, a “difference value” was estimated by subtracting the scores of ESCs from those of each cell (Figure 6, lower panels). Positive and negative difference values indicate that these sites are hyper - and hypo-methylated, respectively, when compared with ESCs. Difference values of the ES-iPS-DMRs showing aberrant methylation states in iPSCs at the early passage approached zero with passaging. It should be noted that the almost all difference values became largely positive in iPSCs at early passage (P13 or P22), even though they were negative in the parent cells, and then approached zero upon further passaging. This transiently-induced hyper-methylation was observed at each passage in all iPSC lines examined. The observed transient hypermethylation patterns during iPS reprogramming did not correspond to methyflated CpGs in the parental cells. However, this observation does not rule out that transient aberrant methylation could also be observed in some cases on sites that were methylated in the parental cells.
Fig. 6. Hyper-methylation in the ES-iPS-DMRs and ES-parent-DMRs. 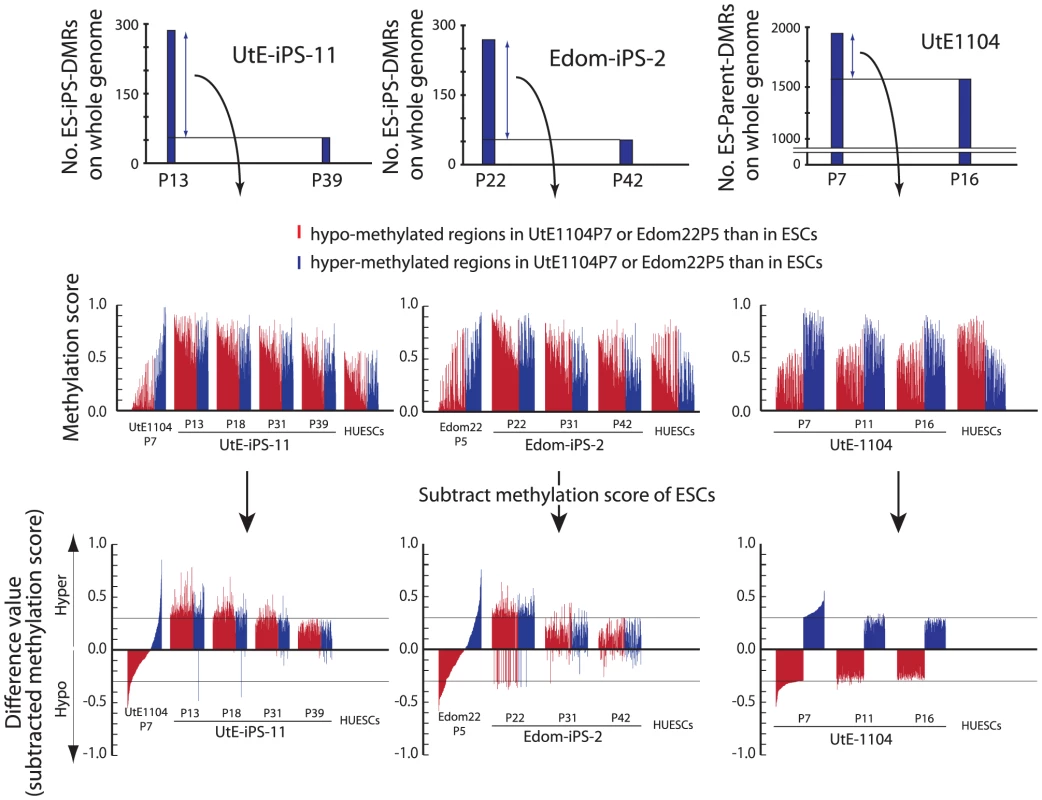
ES-iPS-DMRs that disappeared in UtE-iPS-11 and Edom-iPS-2 at the latest passage (upper) were analyzed and the methylation score of each ES-iPS-DMR was plotted on bar graph (middle). To clearly compare methylation scores, difference value were estimated by subtracting the scores of ESCs from that of each sample (lower). Red and blue bars represent hypo- and hyper-methylated regions, respectively, in the parent cells, compared with ESCs. Notably, almost all the regions, even though their difference values were hypo-methylated in the parent cells, became hyper-methylated in iPSCs at the early passage, and then their methylation levels were adjusted to the level of ESCs with passaging, i.e. subtracted methylation score became close to zero. This transiently-induced hyper-methylation was not detected in parent cells. Discussion
Identification of novel epigenetic iPS markers
OCT-4/3 and NANOG have been used as epigenetic markers for iPSCs [8]–[10], [26], [27]. We previously showed candidate epigenetic markers by analyzing 6 iPS lines [17]. Here we identified 8 novel epigenetic markers more closely by defining 9 genes with the hypo-methylated stem cell-specific DMRs and significantly higher expression, and 17 genes with the hyper-methylated stem cell-specific DMRs and significantly lower expression in iPSCs/ESCs from 22 iPS lines. DNA methylation and expression of these genes, especially the 8 genes, SALL4, EPHA1, PTPN6, RAB25, GBP4, LYST, SP100 and UBE1L, can now be used as epigenetic markers for pluripotent stem cells. Among these 8 genes, SALL4 has been used as an expression marker, and is revealed for the first time as an epigenetic marker. These epigenetic changes during reprogramming can be detected by 3 different methods (Illumina assay, COBRA and bisulfite sequencing), and is evident, i.e. CpG sites are methylated or unmethylated in an all-or-none fashion. The identification of these novel epigenetic markers can be another tool for the validation of pluripotent stem cells that are iPSCs and ESCs.
The hypo-methylated stem cell-required DMRs may have an important role for reprogramming as do the stem cell-specific DMRs, because reprogramming is dependent on the type of parent cells. In fact, genes associated with the hypo-methylated stem cell-required DMRs include a large number of transcription factors that are involved in pluripotency. Establishment of the stem cell-required DMRs database in iPSCs derived from different types of parent cells can help to generate human iPSCs in a fast and easy manner. Hypo-methylated stem cell-specific regions have been reported to be abundant in CpG islands [28]–[30]. In this study, the hypo-methylated stem cell-specific DMRs were significantly biased towards CpG islands, whereas the hyper-methylated stem cell-specific DMRs were biased to non-CpG islands, suggesting that genes with CpG islands have a propensity to be demethylated during reprogramming towards pluripotent stem cells. The higher number of the hyper-methylated stem cell-specific DMRs in iPSCs indicates that the Yamanaka factors activate only limited numbers of stem cell-specific/associated genes through demethylation of the specific DMRs shown in this study on the genome in parallel with methylating most genes associated with tissue-specific function during reprogramming.
Multiple appearances/disappearances of aberrant hyper-methylation
Continuous passaging of iPSCs reduces differences among clones in gene expression profiles in mouse [15] and in human [31] cells. Here we detected multiple appearances and disappearances of aberrant hyper-methylation throughout iPSC reprogramming. Furthermore, human iPSCs were gradually reprogrammed through the “convergence” of periodic aberrant hyper-methylation upon continuous passaging (Figure 7). The term “convergence” is used here to mean that amplitude of aberrant hyper-methylation (or number of ES-iPS-DMRs) decreases. The decrease of aberrant methylation suggests that iPSCs lose the characteristics inherited from the parent cells and adapt to ESCs. This aberrant and stochastic hyper-methylation and their convergence may be a direct cause of the transgene-independent phases of iPS reprogramming [15]. Aberrant hyper-methylation, for which the mechanism remains unclear, can possibly be attributed, at least in part, to up-regulation of DNMT3B, a de novo methyltransferase, at the early stages of reprogramming.
Fig. 7. Model of mechanism for transgene-independent reprogramming. 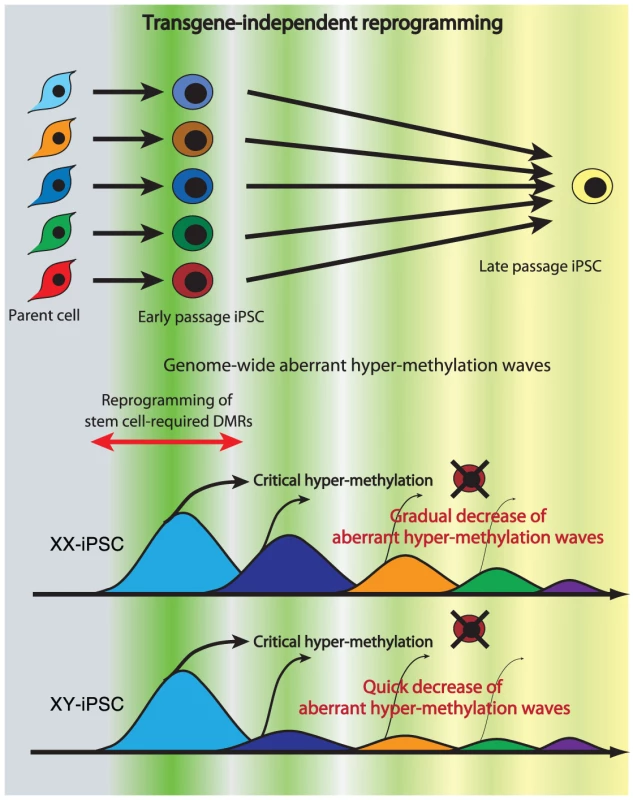
During reprogramming from somatic cells to iPSCs, the cells undergo dynamic change of methylation of SS-DMRs and genome. The cells with incomplete reprogramming or excessive hyper-methylation of the genome fail to maintain pluripotency at early passages. Human iPSCs are transgene-independently reprogrammed gradually through “convergence” of periodic aberrant hyper-methylation and become closer to ESCs upon continuous passaging. Due to the sensitivity to aberrant methylation on X chromosome, XY-iPSCs become close to ESCs faster than XX-iPSCs do. Maintenance of an epigenetic memory of their parent cells at early passage of human iPSCs (Figure 4A) is consistent with recent reports involving mouse iPSCs [15]–[17]. However, most inherited sites from the parent cells in iPSCs were inconsistent among iPSC clones from the same parent cells on the genome, and these sites showed periodic aberrant hyper-methylation during passaging, as well as aberrant sites. Inherited methylation is non-synchronous and stochastic, much like aberrant methylation, rather than deterministic. The inherited sites thus comprise a portion of all aberrant methylation observed in the clones.
Mouse female iPSCs as well as mouse female ESCs carry two active X chromosomes [32], but inactivation of the X chromosome in human female ESCs is variable [22], [33]–[35]. It has been reported recently that human female iPSCs show a variable state of X-inactivation as is seen in human female ESCs [22], [36]. In this study, human iPSCs exhibited a dynamic epigenetic state on the X chromosome. The ES-iPS-DMRs on the X chromosome in XY-iPSCs were rare and the average number of ES-iPS-DMRs in XY-iPSCs was significantly lower than in XX-iPSCs, suggesting that iPSCs are prone to aberrant hyper-methylation on the inactive X chromosome. A recent report showed that X inactivation in human ESCs is sensitive to the level of oxygen through culture in vitro [35]. Therefore, analysis of aberrant methylation in iPSCs that are established and cultured in low oxygen condition would be help to understand physiological relevance of X inactivation and reprogramming.
Incomplete adaptation of iPSCs to ESCs
The number of passages for “convergence” of the aberrant hyper-methylation seems be dependent on parental cell types and their sex. Disappearance of iPSCs in culture within 10 passages is occasionally observed, regardless of the cell of origin. This instability may be due to an excess of aberrant hyper-methylation at early passages in addition to the “partial reprogramming” theory [15]. The late-passage iPSCs, like the early-passage iPSCs, retained the ability to differentiate into cell types found in all three germ layers. iPSCs showed reduced aberrant methylation during adaptation to ESCs; however, iPSCs retained approximately 100 aberrant sites on autosomes, implying that iPSCs do not become identical to ESCs, although they become very close. The remaining aberrant sites were inconsistent among iPSC clones with different parent cell types, but the numbers were consistent among iPSC clones after a 42-week cultivation. The quantity (or number) of ES-iPS-DMRs would be another validation index for iPSC identity as well as quality analysis (or methylation ratio) of pluripotent stem cell-specific methylation.
Abnormalities of imprint genes, MEG3 genes, and H19 genes in human iPSCs
Genomic imprinting of H19, IGF2 and MEG3 has been reported to be unstable in human ESCs [37], [38]. The Dlk1-Dio3 genes were aberrantly silenced in most of the mouse iPSC lines. But mouse iPSCs without MEG3 expression still have the ability to differentiate into cell type of three germ layers in vitro [39]. In humans, IG-DMR and MEG3-DMR are relevant to upd(14)pat-like and upd(14)mat-like phenotypes [40]. In this study, only MEG3 and H19, out of 87 imprinted genes examined showed aberrant methylation in human iPSCs (Figure S10). Six out of 15 human iPSC lines were aberrantly methylated at MEG3-DMR. MEG3 expression was silenced in those six lines regardless of their parent cell type, although all parent cells showed about 50% methylation at MEG3-DMR and expression of MEG3 (Figure S10A, S10B). However, MEG3-negative iPS lines are almost indistinguishable from MEG3-positive iPS lines in DNA methylation and gene expression in human. Continuous passaging did not resolve the aberrant hyper-methylation at MEG3-DMR, suggesting that these abnormalities occur at early passage and are fixed at later stages. In addition, aberrant hyper-methylation at H19 in all iPSCs and ESCs was observed (Figure S10C), and H19 was not expressed in all iPSCs and their parent cells.
We revealed that transgene-independent reprogramming is a convergence of periodic hyper-methylation. The aberrant hyper-methylation in iPSCs occurs stochastically throughout the genome. Early-stage iPSC clones with different propensities due to stochastic hyper-methylation may be used after selection of desirable phenotypes to treat a wide range of target diseases using cell-based therapy, and would thus have advantages for clinical use. In this sense, the number of ES-iPS-DMRs and methylation states of the stem cell-specific DMRs are useful epigenetic indices for evaluating human iPSCs in therapeutic applications.
Materials and Methods
Ethics statement
Human endometrium, amnion, placental artery endothelium and menstrual blood cells were collected by scraping tissues from surgical specimens, under signed informed consent, with ethical approval of the Institutional Review Board of the National Institute for Child Health and Development, Japan. Signed informed consent was obtained from donors, and the surgical specimens were irreversibly de-identified. All experiments handling human cells and tissues were performed in line with Tenets of the Declaration of Helsinki.
Human cell culture
Endometrium (UtE1104), amnion (AM936EP), placental artery endothelium (PAE551) and menstrual blood cell (Edom22) cell lines were independently established in our laboratory [41], [42]. UtE1104, AM936EP, Edom22, and MRC-5 [43] cells were maintained in the POWEREDBY10 medium (MED SHIROTORI CO., Ltd, Tokyo, Japan). PAE551 cells were cultured in EGM-2MV BulletKit (Lonza, Walkersville, MD, USA) containing 5% FBS. Human iPSCs were generated in our laboratory, via procedures described by Yamanaka and colleagues [8] with slight modification [17], [41], [44]–[46]. The human cells were infected with retroviruses produced from the retroviral vector pMXs, which encodes the cDNA for human OCT3/4, SOX2, c-MYC, and KLF4. Human iPSCs were established from MRC-5, AM936EP, UtE1104, and PAE551, which were designated as MRC-iPSCs, AM-iPSCs, UtE-iPSCs and PAE-iPSCs [17], [41], [44]–[46]. Edom - iPSCs were established from Edom22 in this study. Human iPSCs were maintained on irradiated MEFs in 0222 medium (MED SHIROTORI CO., Ltd, Tokyo, Japan) supplemented with 10 ng/ml recombinant human basic fibroblast growth factor (bFGF, Wako Pure Chemical Industries, Ltd., Osaka, Japan). The 201B7 human iPSC line [8] that was generated from human skin fibroblasts by retroviral transfection with 4 transcription factors was also used. Frozen pellets of human ESCs (HUESCs) [23], [24] were kindly gifted from Drs. C. Cowan and T. Tenzan (Harvard Stem Cell Institute, Harvard University, Cambridge, MA).
DNA methylation analysis
DNA methylation analysis was performed using the Illumina infinium assay with the HumanMethylation27 BeadChip (Illumina) and the BeadChip was scanned on a BeadArray Reader (Illumina), according to the manufacturer's instructions. Methylated and unmethylated signals were used to compute a β-value, which was a quantitative score of DNA methylation levels, ranging from “0”, for completely unmethylated, to “1”, for completely methylated. On the HumanMethylation27 BeadChip, oligonucleotides for 27,578 CpG sites covering more than 14,000 genes are mounted, mostly selected from promoter regions. CpG sites with ≥0.05 “Detection p value” (computed from the background based on negative controls) were eliminated from the data for further analysis, leaving 24,273 CpGs (13,728 genes) valid for use with the 51 samples tested. Average of methylation was calculated from HUESCs, MRC-iPSCs, AM-iPSCs, UtE-iPSCs, PAE-iPSCs and Edom-iPSCs, in which DMRs among each line in the each set were removed. Analyzed data sets (list of stem cell-specific DMRs and stem cell-required DMRs) can be obtained from http://www.nch.go.jp/reproduction/e/thdmds.html.
Gene expression analysis
Gene expression analysis was performed using the Agilent Whole Human Genome Microarray chips G4112F (Agilent, Santa Clara, CA), which contains over 41,000 probes. Raw data were normalized and analyzed by GeneSpringGX11 software (Silicon Genetics, Redwood City, CA). For RT-PCR, an aliquot of total RNA was reverse-transcribed using Random Hexamer primers. The cDNA template was amplified using specific primers for EPHA1, PTPN6, RAB25, SALL4, GBP3, LYST, SP100, UBE1L, OCT3/4 and NANOG. For detecting RNA derived from transgenes, specific primer sets, FY-11 and OCT3/4-SR, FY-11 and SOX2-SR, KLF4-SF and FY-12, cMYC-SF and FY-12, were used. Expression of glyceraldehyde-3-phosphate dehydrogenase (GAPDH) was used as a control. Primers used in this study are summarized in Table S8.
Quantitative combined bisulfite restriction analysis (COBRA) and bisulfite sequencing
To confirm the DNA methylation state, bisulfite PCR-mediated restriction mapping (known as the COBRA method) was performed. Sodium bisulfite treatment of genomic DNA was carried out using EZ DNA Methylation-Gold kit (Zymo Research). PCR amplification was performed using BIOTAQ HS DNA polymerase (Bioline Ltd; London, UK) with specific primers for EPHA1, PTPN6, RAB25, SALL4, GBP3, LYST, SP100, and UBE1L. Primers used in this study are summarized in Table S8. After digestion with restriction enzymes, HpyCH4IV or Taq I, quantitative-COBRA coupled with the Shimadzu MCE-202 MultiNA Microchip Electrophoresis System (Shimadzu, Japan) was carried out for quantitative DNA methylation level. To determine the methylation state of individual CpG sites, the PCR product was gel extracted and subcloned into pGEM T Easy vector (Promega, Madison, WI), and then sequenced. The promoter regions of the OCT3/4 and NANOG [41], [44] were also amplified and sequenced. Methylation sites were visualized and quality control was carried out by the web-based tool, “QUMA” (http://quma.cdb.riken.jp/) [47].
Web tools
The following web tools were used in this study: NIA Array [48] (http://lgsun.grc.nia.nih.gov/ANOVA/) for hierarchical clustering, DAVID Bioinformatics Resources [49] (http://david.abcc.ncifcrf.gov/home.jsp), PANTHER Classification System [50] (http://www.pantherdb.org/).
Accession numbers
NCBI GEO: HumanMethylation27 BeadChip data and gene expression microarray data have been submitted under accession number GSE 20750, GSE24676 and GSE24677.
Supporting Information
Zdroje
1. LiE 2002 Chromatin modification and epigenetic reprogramming in mammalian development. Nat Rev Genet 3 662 673
2. ReikW 2007 Stability and flexibility of epigenetic gene regulation in mammalian development. Nature 447 425 432
3. FengSJacobsenSEReikW 2010 Epigenetic reprogramming in plant and animal development. Science 330 622 627
4. HattoriNNishinoKKoYGOhganeJTanakaS 2004 Epigenetic control of mouse Oct-4 gene expression in embryonic stem cells and trophoblast stem cells. J Biol Chem 279 17063 17069
5. HattoriNImaoYNishinoKOhganeJYagiS 2007 Epigenetic regulation of Nanog gene in embryonic stem and trophoblast stem cells. Genes Cells 12 387 396
6. NishinoKHattoriNTanakaSShiotaK 2004 DNA methylation-mediated control of Sry gene expression in mouse gonadal development. J Biol Chem 279 22306 22313
7. ZinggJMPedraza-AlvaGJostJP 1994 MyoD1 promoter autoregulation is mediated by two proximal E-boxes. Nucleic Acids Res 22 2234 2241
8. TakahashiKTanabeKOhnukiMNaritaMIchisakaT 2007 Induction of pluripotent stem cells from adult human fibroblasts by defined factors. Cell 131 861 872
9. YuJVodyanikMASmuga-OttoKAntosiewicz-BourgetJFraneJL 2007 Induced pluripotent stem cell lines derived from human somatic cells. Science 318 1917 1920
10. ParkIHZhaoRWestJAYabuuchiAHuoH 2008 Reprogramming of human somatic cells to pluripotency with defined factors. Nature 451 141 146
11. WoltjenKMichaelIPMohseniPDesaiRMileikovskyM 2009 piggyBac transposition reprograms fibroblasts to induced pluripotent stem cells. Nature 458 766 770
12. ParkIHAroraNHuoHMaheraliNAhfeldtT 2008 Disease-specific induced pluripotent stem cells. Cell 134 877 886
13. MiuraKOkadaYAoiTOkadaATakahashiK 2009 Variation in the safety of induced pluripotent stem cell lines. Nat Biotechnol 27 743 745
14. GhoshZWilsonKDWuYHuSQuertermousT 2010 Persistent donor cell gene expression among human induced pluripotent stem cells contributes to differences with human embryonic stem cells. PLoS ONE 5 e8975 doi:10.1371/journal.pone.0008975
15. PoloJMLiuSFigueroaMEKulalertWEminliS 2010 Cell type of origin influences the molecular and functional properties of mouse induced pluripotent stem cells. Nat Biotechnol 28 848 855
16. KimKDoiAWenBNgKZhaoR 2010 Epigenetic memory in induced pluripotent stem cells. Nature
17. NishinoKToyodaMYamazaki-InoueMMakinoHFukawataseY 2010 Defining Hypo-Methylated Regions of Stem Cell-Specific Promoters in Human iPS Cells Derived from Extra-Embryonic Amnions and Lung Fibroblasts. PLoS ONE 5 e13017 doi:10.1371/journal.pone.0013017
18. FazzariMJGreallyJM 2004 Epigenomics: beyond CpG islands. Nat Rev Genet 5 446 455
19. FazzariMJGreallyJM 2010 Introduction to epigenomics and epigenome-wide analysis. Methods Mol Biol 620 243 265
20. DoiAParkIHWenBMurakamiPAryeeMJ 2009 Differential methylation of tissue - and cancer-specific CpG island shores distinguishes human induced pluripotent stem cells, embryonic stem cells and fibroblasts. Nat Genet 41 1350 1353
21. ListerRPelizzolaMKidaYSHawkinsRDNeryJR 2011 Hotspots of aberrant epigenomic reprogramming in human induced pluripotent stem cells. Nature 471 68 73
22. BockCKiskinisEVerstappenGGuHBoultingG 2011 Reference Maps of Human ES and iPS Cell Variation Enable High-Throughput Characterization of Pluripotent Cell Lines. Cell 144 439 452
23. CowanCAKlimanskayaIMcMahonJAtienzaJWitmyerJ 2004 Derivation of embryonic stem-cell lines from human blastocysts. N Engl J Med 350 1353 1356
24. OsafuneKCaronLBorowiakMMartinezRJFitz-GeraldCS 2008 Marked differences in differentiation propensity among human embryonic stem cell lines. Nat Biotechnol 26 313 315
25. BrenaRMAuerHKornackerKPlassC 2006 Quantification of DNA methylation in electrofluidics chips (Bio-COBRA). Nat Protoc 1 52 58
26. TakahashiKYamanakaS 2006 Induction of pluripotent stem cells from mouse embryonic and adult fibroblast cultures by defined factors. Cell 126 663 676
27. HuangfuDOsafuneKMaehrRGuoWEijkelenboomA 2008 Induction of pluripotent stem cells from primary human fibroblasts with only Oct4 and Sox2. Nat Biotechnol 26 1269 1275
28. FouseSDShenYPellegriniMColeSMeissnerA 2008 Promoter CpG methylation contributes to ES cell gene regulation in parallel with Oct4/Nanog, PcG complex, and histone H3 K4/K27 trimethylation. Cell Stem Cell 2 160 169
29. MeissnerAMikkelsenTSGuHWernigMHannaJ 2008 Genome-scale DNA methylation maps of pluripotent and differentiated cells. Nature 454 766 770
30. SatoSYagiSAraiYHirabayashiKHattoriN 2010 Genome-wide DNA methylation profile of tissue-dependent and differentially methylated regions (T-DMRs) residing in mouse pluripotent stem cells. Genes Cells 15 607 618
31. ChinMHPellegriniMPlathKLowryWE 2010 Molecular analyses of human induced pluripotent stem cells and embryonic stem cells. Cell Stem Cell 7 263 269
32. MaheraliNSridharanRXieWUtikalJEminliS 2007 Directly reprogrammed fibroblasts show global epigenetic remodeling and widespread tissue contribution. Cell Stem Cell 1 55 70
33. HallLLByronMButlerJBeckerKANelsonA 2008 X-inactivation reveals epigenetic anomalies in most hESC but identifies sublines that initiate as expected. J Cell Physiol 216 445 452
34. ShenYMatsunoYFouseSDRaoNRootS 2008 X-inactivation in female human embryonic stem cells is in a nonrandom pattern and prone to epigenetic alterations. Proc Natl Acad Sci U S A 105 4709 4714
35. LengnerCJGimelbrantAAErwinJAChengAWGuentherMG 2010 Derivation of pre-X inactivation human embryonic stem cells under physiological oxygen concentrations. Cell 141 872 883
36. TchieuJKuoyEChinMHTrinhHPattersonM 2010 Female human iPSCs retain an inactive X chromosome. Cell Stem Cell 7 329 342
37. Rugg-GunnPJFerguson-SmithACPedersenRA 2005 Epigenetic status of human embryonic stem cells. Nat Genet 37 585 587
38. Rugg-GunnPJFerguson-SmithACPedersenRA 2007 Status of genomic imprinting in human embryonic stem cells as revealed by a large cohort of independently derived and maintained lines. Hum Mol Genet 16 Spec No. 2 R243 251
39. StadtfeldMApostolouEAkutsuHFukudaAFollettP 2010 Aberrant silencing of imprinted genes on chromosome 12qF1 in mouse induced pluripotent stem cells. Nature 465 175 181
40. KagamiMSekitaYNishimuraGIrieMKatoF 2008 Deletions and epimutations affecting the human 14q32.2 imprinted region in individuals with paternal and maternal upd(14)-like phenotypes. Nat Genet 40 237 242
41. NagataSToyodaMYamaguchiSHiranoKMakinoH 2009 Efficient reprogramming of human and mouse primary extra-embryonic cells to pluripotent stem cells. Genes Cells 14 1395 1404
42. CuiCHUyamaTMiyadoKTeraiMKyoS 2007 Menstrual blood-derived cells confer human dystrophin expression in the murine model of Duchenne muscular dystrophy via cell fusion and myogenic transdifferentiation. Mol Biol Cell 18 1586 1594
43. JacobsJPJonesCMBailleJP 1970 Characteristics of a human diploid cell designated MRC-5. Nature 227 168 170
44. MakinoHToyodaMMatsumotoKSaitoHNishinoK 2009 Mesenchymal to embryonic incomplete transition of human cells by chimeric OCT4/3 (POU5F1) with physiological co-activator EWS. Exp Cell Res 315 2727 2740
45. SaitoSOnumaYItoYTatenoHToyodaM 2010 Potential linkages between the inner and outer cellular states of human induced pluripotent stem cells. BMC Bioinformatics in press
46. ToyodaMYamazaki-InoueMItakuraYKunoAOgawaT 2010 Lectin microarray analysis of pluripotent and multipotent stem cells. Genes Cells in press
47. KumakiYOdaMOkanoM 2008 QUMA: quantification tool for methylation analysis. Nucleic Acids Res 36 W170 175
48. SharovAADudekulaDBKoMS 2005 A web-based tool for principal component and significance analysis of microarray data. Bioinformatics 21 2548 2549
49. Huang daWShermanBTLempickiRA 2009 Systematic and integrative analysis of large gene lists using DAVID bioinformatics resources. Nat Protoc 4 44 57
50. MiHLazareva-UlitskyBLooRKejariwalAVandergriffJ 2005 The PANTHER database of protein families, subfamilies, functions and pathways. Nucleic Acids Res 33 D284 288
Štítky
Genetika Reprodukční medicína
Článek vyšel v časopisePLOS Genetics
Nejčtenější tento týden
2011 Číslo 5
-
Všechny články tohoto čísla
- Structural and Functional Differences in the Long Non-Coding RNA in Mouse and Human
- Identification, Replication, and Functional Fine-Mapping of Expression Quantitative Trait Loci in Primary Human Liver Tissue
- A −436C>A Polymorphism in the Human Gene Promoter Associated with Severe Childhood Malaria
- A Decline in p38 MAPK Signaling Underlies Immunosenescence in
- The Operon Balances the Requirements for Vegetative Stability and Conjugative Transfer of Plasmid R388
- Novel and Conserved Protein Macoilin Is Required for Diverse Neuronal Functions in
- Ixr1 Is Required for the Expression of the Ribonucleotide Reductase Rnr1 and Maintenance of dNTP Pools
- Genome of Strain SmR1, a Specialized Diazotrophic Endophyte of Tropical Grasses
- A Deficiency of Ceramide Biosynthesis Causes Cerebellar Purkinje Cell Neurodegeneration and Lipofuscin Accumulation
- A Latent Pro-Survival Function for the Mir-290-295 Cluster in Mouse Embryonic Stem Cells
- Association of Genetic Variants in Complement Factor H and Factor H-Related Genes with Systemic Lupus Erythematosus Susceptibility
- DNA Methylation Dynamics in Human Induced Pluripotent Stem Cells over Time
- Prion Formation and Polyglutamine Aggregation Are Controlled by Two Classes of Genes
- Integrated Genome-Scale Prediction of Detrimental Mutations in Transcription Networks
- Post-Embryonic Nerve-Associated Precursors to Adult Pigment Cells: Genetic Requirements and Dynamics of Morphogenesis and Differentiation
- A Novel Mouse Synaptonemal Complex Protein Is Essential for Loading of Central Element Proteins, Recombination, and Fertility
- STAT Is an Essential Activator of the Zygotic Genome in the Early Embryo
- A Genetic and Structural Study of Genome Rearrangements Mediated by High Copy Repeat Ty1 Elements
- A Missense Mutation in Causes a Major QTL Effect on Ear Size in Pigs
- A Flurry of Folding Problems: An Interview with Susan Lindquist
- Meiotic Recombination Intermediates Are Resolved with Minimal Crossover Formation during Return-to-Growth, an Analogue of the Mitotic Cell Cycle
- A Nervous Origin for Fish Stripes
- The ISWI Chromatin Remodeler Organizes the hsrω ncRNA–Containing Omega Speckle Nuclear Compartments
- The Telomerase Subunit Est3 Binds Telomeres in a Cell Cycle– and Est1–Dependent Manner and Interacts Directly with Est1
- Nodal-Dependent Mesendoderm Specification Requires the Combinatorial Activities of FoxH1 and Eomesodermin
- SHINE Transcription Factors Act Redundantly to Pattern the Archetypal Surface of Arabidopsis Flower Organs
- Characterizing Genetic Risk at Known Prostate Cancer Susceptibility Loci in African Americans
- PLOS Genetics
- Archiv čísel
- Aktuální číslo
- Informace o časopisu
Nejčtenější v tomto čísle- Nodal-Dependent Mesendoderm Specification Requires the Combinatorial Activities of FoxH1 and Eomesodermin
- SHINE Transcription Factors Act Redundantly to Pattern the Archetypal Surface of Arabidopsis Flower Organs
- Association of Genetic Variants in Complement Factor H and Factor H-Related Genes with Systemic Lupus Erythematosus Susceptibility
- STAT Is an Essential Activator of the Zygotic Genome in the Early Embryo
Kurzy
Zvyšte si kvalifikaci online z pohodlí domova
Současné možnosti léčby obezity
nový kurzAutoři: MUDr. Martin Hrubý
Všechny kurzyPřihlášení#ADS_BOTTOM_SCRIPTS#Zapomenuté hesloZadejte e-mailovou adresu, se kterou jste vytvářel(a) účet, budou Vám na ni zaslány informace k nastavení nového hesla.
- Vzdělávání


