
Whole Blood Gene Expression Profiles to Assess Pathogenesis and Disease Severity in Infants with Respiratory Syncytial Virus Infection
Background:
Respiratory syncytial virus (RSV) is the leading cause of viral lower respiratory tract infection (LRTI) and hospitalization in infants. Mostly because of the incomplete understanding of the disease pathogenesis, there is no licensed vaccine, and treatment remains symptomatic. We analyzed whole blood transcriptional profiles to characterize the global host immune response to acute RSV LRTI in infants, to characterize its specificity compared with influenza and human rhinovirus (HRV) LRTI, and to identify biomarkers that can objectively assess RSV disease severity.
Methods and Findings:
This was a prospective observational study over six respiratory seasons including a cohort of infants hospitalized with RSV (n = 135), HRV (n = 30), and influenza (n = 16) LRTI, and healthy age - and sex-matched controls (n = 39). A specific RSV transcriptional profile was identified in whole blood (training cohort, n = 45 infants; Dallas, Texas, US) and validated in three different cohorts (test cohort, n = 46, Dallas, Texas, US; validation cohort A, n = 16, Turku, Finland; validation cohort B, n = 28, Columbus, Ohio, US) with high sensitivity (94% [95% CI 87%–98%]) and specificity (98% [95% CI 88%–99%]). It classified infants with RSV LRTI versus HRV or influenza LRTI with 95% accuracy. The immune dysregulation induced by RSV (overexpression of neutrophil, inflammation, and interferon genes, and suppression of T and B cell genes) persisted beyond the acute disease, and immune dysregulation was greatly impaired in younger infants (<6 mo). We identified a genomic score that significantly correlated with outcomes of care including a clinical disease severity score and, more importantly, length of hospitalization and duration of supplemental O2.
Conclusions:
Blood RNA profiles of infants with RSV LRTI allow specific diagnosis, better understanding of disease pathogenesis, and assessment of disease severity. This study opens new avenues for biomarker discovery and identification of potential therapeutic or preventive targets, and demonstrates that large microarray datasets can be translated into a biologically meaningful context and applied to the clinical setting.
Please see later in the article for the Editors' Summary
Published in the journal:
. PLoS Med 10(11): e32767. doi:10.1371/journal.pmed.1001549
Category:
Research Article
doi:
https://doi.org/10.1371/journal.pmed.1001549
Summary
Background:
Respiratory syncytial virus (RSV) is the leading cause of viral lower respiratory tract infection (LRTI) and hospitalization in infants. Mostly because of the incomplete understanding of the disease pathogenesis, there is no licensed vaccine, and treatment remains symptomatic. We analyzed whole blood transcriptional profiles to characterize the global host immune response to acute RSV LRTI in infants, to characterize its specificity compared with influenza and human rhinovirus (HRV) LRTI, and to identify biomarkers that can objectively assess RSV disease severity.
Methods and Findings:
This was a prospective observational study over six respiratory seasons including a cohort of infants hospitalized with RSV (n = 135), HRV (n = 30), and influenza (n = 16) LRTI, and healthy age - and sex-matched controls (n = 39). A specific RSV transcriptional profile was identified in whole blood (training cohort, n = 45 infants; Dallas, Texas, US) and validated in three different cohorts (test cohort, n = 46, Dallas, Texas, US; validation cohort A, n = 16, Turku, Finland; validation cohort B, n = 28, Columbus, Ohio, US) with high sensitivity (94% [95% CI 87%–98%]) and specificity (98% [95% CI 88%–99%]). It classified infants with RSV LRTI versus HRV or influenza LRTI with 95% accuracy. The immune dysregulation induced by RSV (overexpression of neutrophil, inflammation, and interferon genes, and suppression of T and B cell genes) persisted beyond the acute disease, and immune dysregulation was greatly impaired in younger infants (<6 mo). We identified a genomic score that significantly correlated with outcomes of care including a clinical disease severity score and, more importantly, length of hospitalization and duration of supplemental O2.
Conclusions:
Blood RNA profiles of infants with RSV LRTI allow specific diagnosis, better understanding of disease pathogenesis, and assessment of disease severity. This study opens new avenues for biomarker discovery and identification of potential therapeutic or preventive targets, and demonstrates that large microarray datasets can be translated into a biologically meaningful context and applied to the clinical setting.
Please see later in the article for the Editors' Summary
Introduction
Lower respiratory tract infections (LRTIs) are associated with significant morbidity and mortality in children worldwide [1]. The implementation of vaccination with conjugate vaccines against the most common causes of bacterial LRTI, Haemophilus influenzae type b and Streptococcus pneumoniae, has clearly shown a protective effect in children [2],[3]. On the other hand, respiratory viruses account for a large proportion of LRTIs in children, greater than previously estimated [4],[5]. Respiratory syncytial virus (RSV) is the most common cause of viral LRTI leading to hospitalization in young children worldwide [6]–[8]. Despite the disease burden, there is no available vaccine, and treatment remains symptomatic. In addition, in the clinical setting it is impossible to predict, based on the physical examination and available diagnostic tools, which patients will progress to worse disease requiring hospitalization and which patients can be discharged home. Hence, there is a clear need to better understand the immune response to RSV and how it relates to disease pathogenesis, progression, and severity.
Through analyzing whole blood RNA transcriptional profiles, the major goals of this study were (1) to characterize the global host response to acute RSV LRTI in infants, (2) to define the specific profile of RSV infection compared with other common respiratory viruses including human rhinovirus (HRV) and influenza, and (3) to identify specific biomarkers that objectively assess RSV disease severity.
Methods
Ethics Statement
Our study complied with the guidelines of the Declaration of Helsinki. As such, the institutional review boards of University of Texas Southwestern Medical Center (#0802-447), Baylor Research Institute (#002-141), Turku University Hospital (#21.11.2006-492), and Nationwide Children's Hospital (#10-00028) approved the study. Written informed consent was obtained from legal guardians.
Patient Characteristics
This was a prospective cohort study involving a convenience sample of children <2 y old hospitalized at Children's Medical Center (Dallas, Texas, US), Turku University Hospital (Turku, Finland), or Nationwide Children's Hospital (Columbus, Ohio, US) with RSV (n = 135), HRV (n = 30), or influenza A (n = 16) LRTI during six respiratory seasons (2006–2011). Samples from 39 healthy age-, race-, and sex-matched controls, and 1-mo follow-up samples from 21 children with RSV LRTI were also obtained (Table S1). Race (African American, White, Asian, Other) and ethnicity (Hispanic and non-Hispanic) were defined according to US National Institutes of Health criteria, and were captured by the research team via direct interview with caregivers. In addition to gender and age, race/ethnicity information was gathered to control for the influence of basic demographic characteristics between patients and controls when performing the analyses. RSV, influenza, and HRV infections were diagnosed by hospital standard methods (rapid antigen, direct fluorescent antibody, or PCR) [9].
Monday through Friday, patients were identified using the daily virology laboratory report. Those with confirmed RSV, influenza, or HRV infection underwent screening. We excluded children with documented bacterial co-infections (including bacteremia, urinary tract infection, meningitis, acute gastroenteritis, or any bacterial pathogen isolated from a sterile site) or viral co-infections. We also excluded children with congenital heart disease, chronic lung disease, immunodeficiency, prematurity (<36 wk), and systemic steroid treatment within 2 wk before presentation. Patients fulfilling inclusion criteria were enrolled, and blood samples for microarray analyses were collected at a median time of (interquartile range [IQR]) 48 (24–72) h after admission. Control samples were obtained from healthy children undergoing elective surgery not involving the respiratory tract, or at routine outpatient visits. For the healthy control group, a clinical questionnaire was used, and those children with co-morbidities, use of systemic steroids, or presence of any illness within 2 wk prior to enrollment were excluded. Lastly, to exclude viral co-infections, respiratory samples were tested by viral culture or PCR in 94% of patients and controls. Overall, our patient recruitment rates varied from 70% to 80% and 50% to 60% for patients with viral LRTI and healthy matched controls, respectively. The most frequent reasons for lack of participation reported by parents included lack of parental interest or no parental availability to sign the consent. In addition to the patients that did not participate, as mentioned above, we excluded from the analysis those already enrolled but who were found to have a bacterial or viral co-infection (∼20%) and those in whom the quantity or quality of RNA was insufficient. Despite these limitations, patients were enrolled in the study with various degrees of disease severity, over different respiratory seasons, and from different geographical locations, and are most likely a good representation of the patients that are cared for with RSV LRTI in hospitals.
Study Design
For analysis purposes patients were classified as follows. (1) To define and validate the systemic host response to RSV, patients were divided in four groups: training and test sets enrolled at Children's Medical Center (Dallas, Texas), a second validation set (validation A) enrolled at Turku University Hospital (Turku, Finland), and a third validation set (validation B) enrolled at Nationwide Children's Hospital (Columbus, Ohio). (2) To define the specificity of the RSV biosignature, RSV transcriptional profiles were compared with those from children with HRV and influenza LRTI. (3) To characterize the differences in host responses to RSV according to age, transcriptional profiles were compared between infants <6 mo old versus those 6–24 mo of age. (4) To define how RSV disease severity was reflected at the transcriptional level, we compared transcriptional profiles from children with various degrees of disease severity based on a clinical disease severity score (CDSS) assessed at the time of sample collection [10],[11]. This clinical score was modified from the score originally described by Tal et al. [12] and comprises five parameters (respiratory rate, auscultation, transcutaneous O2 saturation, retractions, and level of activity, mainly assessed by feeding difficulty). Each parameter ranks from 0 (normal) to 3 (most abnormal). Using this score, patients were classified as having mild (0–5), moderate (6–10), or severe (11–15) RSV LRTI. The clinicians that collected the clinical information and the bioinformaticians that analyzed the data were blinded to the transcriptional and clinical data, respectively. The number of patients included in each analysis is displayed in Figure 1.

Sample Collection
Blood samples (1–3 ml) were collected in Tempus tubes (Applied Biosystems) and stored at −20°C. Whole blood RNA was processed and hybridized into Illumina Human WG-6 v3 (for training, test, and validation A cohorts; 49,576 probes) or Human HT-12 v4 (for validation B cohort; 47,323 probes) beadchips and scanned on an Illumina Beadstation 500 system [13],[14]. The two Illumina beadchips shared 39,426 probes, with >95% probe compatibility. The data are deposited in the NCBI Gene Expression Omnibus (GEO accession number: GSE38900).
Microarray Data and Statistical Analysis
Illumina BeadStudio/GenomeStudio software was used to subtract background and scale average samples' signal intensity, and GeneSpring GX 7.3 software was used to perform further normalization and analyses (Figure 2) [13],[15],[16].

Data import and normalization
First, all signal intensity values less than ten fluorescent units were set to equal ten. Next, per-gene normalization was applied by dividing the signal intensity of each probe in each sample by the median intensity for that probe across the median of each control group, except for the classifier analysis, where signals were normalized to the median intensity of that probe across all samples. These normalized data were used for all downstream analyses except for the identification of classifier genes, for which we used non-normalized data, and the assessment of molecular distance to health, for which we used raw data (Figure 2). Transcripts were first selected if they were present in ≥10% (PAL10%) of all samples, had a signal precision <0.01, and had a minimum of 2-fold expression up or down (2xUDALO) change compared with the median intensity across all samples [13]. Thus, the PAL10_2xUDALO, or quality control, gene list composed of 15,530 transcripts was used as the starting point for the downstream analysis (Figure S1: n = 241 samples; RSV, n = 156 [acute, n = 135; follow-up, n = 21], influenza, n = 16, HRV, n = 30, and healthy controls, n = 39). Then, we followed the strategy outlined below.
Data analysis
For supervised analysis (comparative analyses between predefined sample groups), we used GeneSpring software to perform Mann-Whitney or Kruskal-Wallis tests (p<0.01) for comparisons across study groups, followed by Benjamini-Hochberg multiple test correction (false discovery rate set at 1%) and a ≥1.25-fold change filter in expression level relative to the control group [13],[17]–[19]. The list of transcripts generated using the statistical filtering and class comparisons detailed above were then used for hierarchical clustering (of genes and patient samples). Unsupervised clustering (unbiased grouping of samples based on their molecular profile without prior knowledge of sample classification) was applied to the independent validation sets A and B [13]. For hierarchical clustering of genes, we used the Pearson correlation similarity measure with an average-linkage-clustering algorithm implemented in GeneSpring that organizes vertically all transcripts according to their trend of expression across all samples. The vertical expression profiles so generated were then hierarchically clustered by participant sample, on the basis of the similarity of their expression profiles and without prior knowledge of their classification, which now grouped participant samples into horizontally presented clusters on the basis of the similarity of their expression profiles. For this stage, we used the Spearman's rank correlation/distance similarity measure. By examining the cluster membership we could both assess whether the samples were grouping according to known factors (disease status, infecting virus, demographic features) and discover whether there were unknown subclasses within the dataset [14],[20].
Class prediction using the k-nearest neighbor (K-NN) algorithm, one of the tools available in GeneSpring, with seven neighbors and a p-value ratio cutoff of 0.5 was applied to identify the top-ranked genes that best discriminated among the three viral infections. For the class prediction analyses, we first generated a gene list composed of the transcripts differentially expressed (Kruskal-Wallis p<0.01 and Benjamini-Hochberg false discovery rate) among the three viral infections included in the training set. Using those transcripts a prediction model was refined by cross-validation on the training set. This model was then used to predict the classification of samples in the independent test set. Where no prediction was made, this was recorded as an indeterminate result. p-Values were determined using the two-sided Fisher's exact test [13],[15].
Functional analyses were performed using modular analysis. This is a systems scale strategy for microarray analysis that has identified transcriptional modules formed by genes coordinately expressed across multiple disease datasets, thus allowing functional interpretation of the microarray data into biologically useful information. A detailed account of this module-based mining analysis strategy has been reported elsewhere [13],[14],[21],[22].
Ingenuity Pathways Analysis (IPA) (Ingenuity Systems) was used to identify the top canonical pathways and networks. The significance of the association between the dataset and the canonical pathway was measured using Fisher's exact test. This program was also used to map the canonical network and overlay it with expression data from the dataset.
Molecular distance to health (MDTH), a metric that converts the global transcriptional perturbation of each sample into an objective score indicating the degree of transcriptional perturbation of a given sample compared with a healthy baseline, was calculated and correlated with parameters of disease severity. This analysis essentially consists of carrying out outlier analyses on a gene-by-gene basis, where the dispersion of the expression values found in the baseline samples (controls) is used to determine whether the expression value of a given sample (i.e., RSV patient) lies inside or outside two standard deviations of the mean value for the healthy controls, as described elsewhere [13],[14],[23].
Statistical analyses of other continuous and categorical variables were performed using Graph Pad Prism version 5. The Bonferroni correction was used to account for multiple statistical comparisons across all analyses. For sample size calculation, best practices in the microarray field dictate utilization of at least two independent sets of samples for the purpose of validating candidate signatures (or profiles). In previous studies in individuals with acute infections, others and we obtained robust profiles using groups with at least 20–30 participants each for the training and test sets [15],[20],[21],[24].
Results
Blood RSV Transcriptional Profile Is Characterized by Overexpression of Neutrophil and Myeloid Genes and Suppression of B and T Cell Genes
To define the systemic host immune response to RSV infection, patients were divided into training, test, and validation sets (Table 1). Statistical group comparisons identified 2,317 differentially regulated transcripts between 45 infants with RSV and 14 healthy matched controls in the first group of patients in Dallas, Texas (training set; Figure 3A). Fifty-nine percent of transcripts were underexpressed, and 41% overexpressed. While the top ten overexpressed genes included genes related to interferon (IFI27) and neutrophil function (DEFA1 and ELA2), the top underexpressed gene was related to immunosuppression (COAS2) (Table S2). This signature was validated in a second independent group of 46 infants with RSV and 13 controls enrolled in Dallas, Texas (test set; Figure 3B). Patients' demographic and clinical characteristics were comparable in both sets (Tables 1 and 2). A third group of 16 infants with RSV and four matched controls (validation set A) were enrolled in Turku, Finland. Unsupervised hierarchical clustering of the 2,317 transcripts previously identified was applied to this cohort, and the analysis grouped 15 of 16 infants with RSV together. The infant who clustered with the healthy control group was the only child in this cohort of 107 RSV-infected infants that was diagnosed as an outpatient and did not require hospitalization (Figure 3C). Lastly, we enrolled a fourth cohort (validation set B) composed of 28 infants with RSV LRTI and eight matched controls in Columbus, Ohio. These patients were analyzed using a different microarray chip from that used in the other cohorts, and yet, unsupervised hierarchical clustering of the signature identified in the training set grouped all but one RSV patient together (Figure 3D).


To characterize the biological significance of the blood RSV signature, we applied an analytical framework of 62 transcriptional modules (Figure 3G) [14],[21],[22]. Module maps were derived independently for the training (Figure 3E) and test (Figure 3F) sets, using their respective healthy control groups as reference. Patients with RSV LRTI demonstrated significant overexpression of modules related to inflammation, erythrocytes, platelets, cell cycle, and innate immunity including interferon, monocyte, neutrophil, and innate immune response genes. Conversely, genes regulating adaptive immunity involving T cells, B cells, lymphoid lineage, cytotoxic/natural killer (NK) cells, and antimicrobial response were significantly underexpressed. These findings were validated in the test set, as demonstrated by a significant correlation of module expression between both sets (r = 0.90, p<0.0001; Figure 3H). The interferon module (overexpressed) and the antimicrobial response module (underexpressed) were the most highly correlated modules. IPA confirmed the over - and underexpression of the innate and adaptive immune responses, respectively (Figure 4).

RSV Induces a Unique Transcriptional Profile in Peripheral Blood
To determine whether the systemic host immune response to RSV infection was specific we applied a K-NN class prediction algorithm. This algorithm yielded 70 classifier genes that best discriminated RSV from HRV and influenza LRTI in two independent cohorts of patients (Tables 3 and 4). Using the 70 classifier genes, leave-one-out cross-validation of the training set correctly classified 67 of 68 samples (98% accuracy; Figure 5A). In the validation analysis (test set), classifier genes correctly categorized 63 of 69 new patient samples (91% accuracy; Figure 5B). Thus, the K-NN algorithm demonstrated a sensitivity of 94% (95% CI 87%–98%) and a specificity of 98% (95% CI 88%–99%) (Table 5).


To further define the differences in immune profiles among these viruses, we compared the modular fingerprint derived from patients with RSV, influenza, and HRV and from a cohort of healthy matched controls for each viral infection. Although influenza, RSV, and HRV shared common pathways, both the degree of activation/suppression and the expression of specific immune-related genes were markedly different among them. HRV induced milder activation of innate and adaptive immune responses while influenza stimulated a stronger activation of interferon (qualitatively and quantitatively; Table S3), inflammation, monocyte, and innate immune response genes compared with RSV and HRV. Neutrophil-related genes were significantly overexpressed in patients with RSV, followed by patients with HRV, and were at a lower level in patients with influenza LRTI. Lastly, RSV was associated with marked suppression of B cell, T cell, lymphoid lineage, and antimicrobial response genes; this suppression was significantly milder or absent in children with influenza and HRV LRTI (Figure 5C).
Blood Host Immune Profiles Remain Altered 1 mo after Acute RSV LRTI
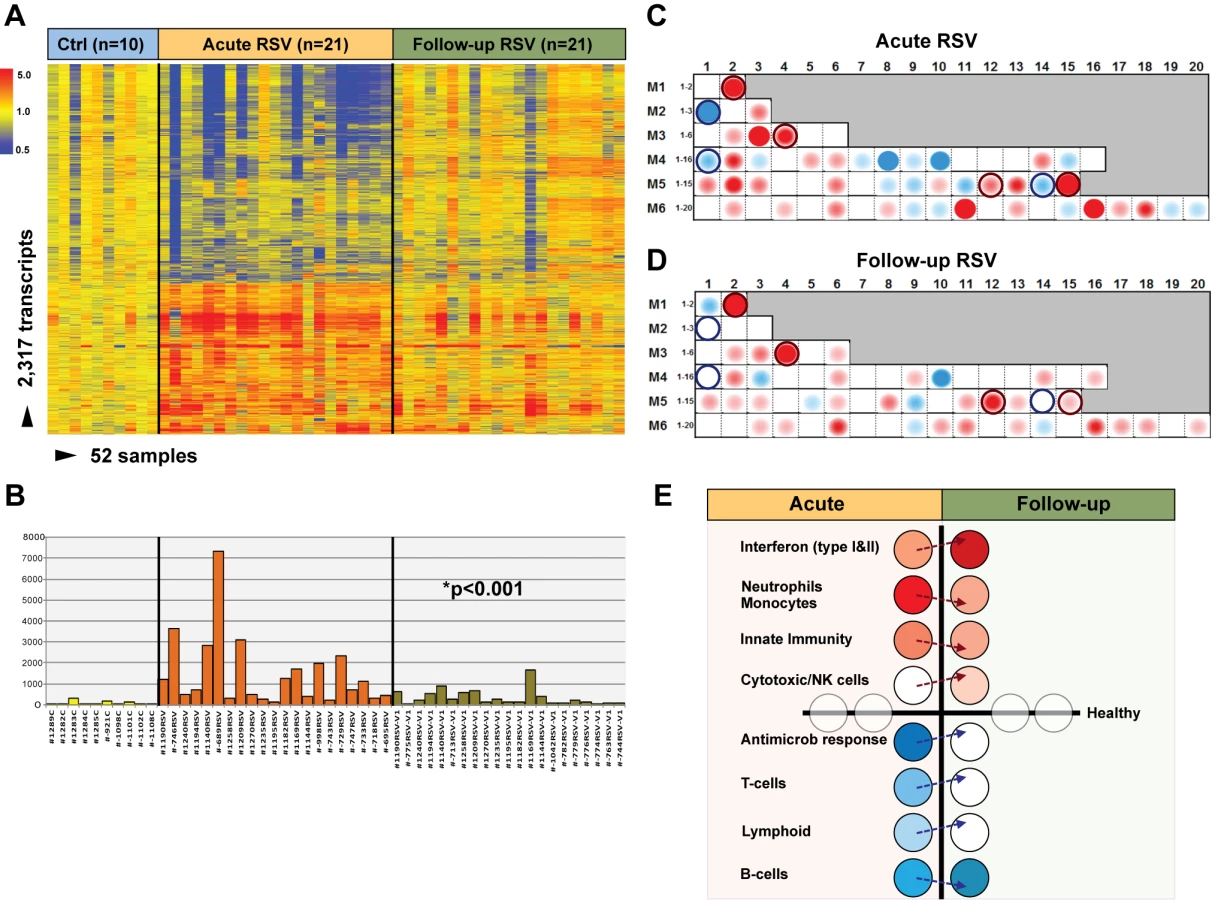
To determine whether and how the blood RSV signature evolved over time, samples from 21 infants (median age [IQR] 2.4 [0.9–7.1] mo) with mild (n = 14), moderate (n = 5), or severe disease (n = 2) were obtained median (IQR) 1.1 (0.9–2.1) mo after hospitalization. Analysis of these samples reflected the heterogeneity observed in those same patients during the acute disease (Figure 6A). MDTH scores [13],[23] were significantly decreased at follow-up visits compared with those elicited during the acute disease (p<0.001; Figure 6B). Although most of the patients followed had a relatively mild course during the acute hospitalization, modular analysis at follow-up revealed significant overexpression of interferon genes, at an even greater level than that observed during hospitalization (p<0.001). The overexpression of neutrophil, monocyte, and innate immunity genes observed during the acute disease faded over time. On the other hand, T cell, lymphoid lineage, and antimicrobial response genes, which were suppressed during the acute phase, reached expression levels comparable to those of controls at follow-up. B cell genes were persistently underexpressed during the acute and follow-up visits (Figure 6C–6E).
Age Influences the Systemic Host Immune Response to RSV
Next, we examined whether age influenced the systemic host response to RSV. To exclude the possibility that the differences observed were driven by demographic or clinical factors, we selected 20 infants <6 mo old with RSV LRTI who were matched for race, sex, and disease severity with 17 children 6–24 mo old with RSV LRTI and with nine healthy controls per age group (Table 6). We identified 1,212 significantly differentially expressed genes in children <6 mo (63% present in the RSV signature), and 2,176 significantly differentially expressed genes in children 6–24 mo (58% present in the RSV signature) compared with controls (Figure 7A–7C). Overall, the proportion of underexpressed genes was significantly greater in younger infants compared with the 6–24-mo age group (78% versus 49%; p<0.001). This greater suppression was demonstrated qualitatively and quantitatively at the modular level (Figure 7D and 7E). The overall activation of innate immunity and inflammation genes was less pronounced in infants <6 mo, and the adaptive immune response was further suppressed compared with older children. Differences in median expression values of the significant modules between age groups are shown in Figure 7F. Data regarding age differences in children with HRV and influenza LRTI are shown in Figure S2.


RSV Disease Severity Is Associated with Suppression of the Systemic Host Immune Response
To identify specific components of the host immune response that best correlated with the differences observed in RSV disease severity, we performed a comparative analysis according to clinical presentation. Children with RSV LRTI, matched for age, sex, and race, were classified as having mild (n = 20), moderate (n = 17), or severe disease (n = 16) using a CDSS (Table 7) [10].

Modular analysis of children with severe RSV disease showed a significantly greater proportion of underexpressed modules than for children with moderate or mild disease (p<0.01; Figure 8A and 8B). The overexpression of neutrophil, inflammation, and erythrocyte genes increased significantly with disease severity. On the other hand, overexpression of interferon and innate immunity genes was similar in children with moderate and severe RSV LRTI, but greater than in children with mild disease (Figure 8C). B cell genes were consistently underexpressed in patients with mild, moderate, and severe RSV LRTI, while children with severe RSV LRTI demonstrated significantly greater underexpression of T cell, cytotoxic/NK cell, and plasma cell genes (Figure 8D); this was also confirmed by IPA (Figure S3).

MDTH Scores Correlate with Clinical RSV Disease Severity
We investigated whether blood transcriptional markers could help classifying RSV patients based on disease severity. Kruskal-Wallis tests (p<0.01) followed by multiple comparisons tests identified 1,536 significantly differentially expressed transcripts between children with mild, moderate, or severe disease and ten healthy controls. Hierarchical clustering of those genes demonstrated a higher proportion of underexpressed genes in children with severe RSV that gradually declined in patients with moderate and mild RSV disease, confirming the observations derived from the modular analysis (Figure 9A). Using those 1,536 transcripts, we calculated the MDTH scores. MDTH scores were higher in children with severe disease than in children with mild or moderate disease (p<0.001) (Figure 9B and 9C). In addition, the genomic MDTH score significantly correlated with the CDSS, the total length of hospitalization, and the duration of supplemental O2 in the overall RSV cohort (n = 91), and in the training (n = 45) and test sets (n = 41) when calculated separately (Figure 9D).

Discussion
Despite the global impact of RSV, our understanding of the immunopathogenesis of this infection and how the different components of the host response relate to the clinical manifestations of the disease remains incomplete. Using an unbiased analytical strategy we found that the host systemic response to RSV (RSV biosignature) was robust, as it was validated in different patient populations from different countries and with diverse genetic backgrounds. We also found that the blood RSV biosignature was specific compared with those induced by influenza and HRV, and demonstrated that the immune dysregulation induced by RSV persisted beyond the acute disease, and it was greatly impaired in younger infants. Lastly, we identified a genomic score that significantly correlated with clinical indices of disease severity. We believe that this is the first study that provides a comprehensive analysis of whole blood gene expression profiles in infants with RSV LRTI, and that describes a significant association between gene expression profiles and clinical disease severity in the context of an acute viral LRTI.
To better understand the immunopathogenesis of RSV infection, investigators have performed gene expression analyses of cells in vitro [25]–[27] and in animal models [28]–[30]. Data in children are limited to two small studies. In the first study, gene expression profiles were characterized from cord blood samples in five infants at birth [31] and at the time of RSV hospitalization 3 mo later [32]. In a more recent study, whole blood gene profiles from 21 children with mild-to-moderate RSV bronchiolitis (median age of 6 mo) were characterized upon presentation to the emergency department [33]. Despite the paucity of data, and the known effect of the viral nonstructural proteins NS1/NS2 in counteracting interferon responses, activation of interferon-related genes was a common finding in those studies and was also found in our cohort of 135 infants with RSV infection. In the present study, we were also able to follow 21 infants with RSV infection and found an even greater activation of interferon-related genes in samples obtained at a follow-up visit 4–6 wk after the acute disease than in samples obtained during the acute disease from those same exact patients, suggesting that acute RSV infection partially inhibits interferon responses.
The systemic activation of common immune pathways in response to respiratory viral infections has been reported recently [34]. Zaas et al. experimentally challenged adult volunteers with RSV, influenza, and HRV and identified a blood gene expression signature that differentiated symptomatic infected individuals from uninfected individuals with 95% accuracy [35]. They found that interferon-related genes such as RSAD2, LAMP3, IFI44L, and OAS1 were significantly differentially expressed in individuals with symptomatic RSV, influenza, or HRV infection. In agreement with those findings, the interferon signature and those specific genes (included in module M1.2) were overexpressed in our cohort of infants naturally infected with those viruses.
Studies have shown that influenza triggers a more robust immune response than RSV, with greater production of respiratory and systemic cytokines [36]–[38]. Our recent studies using human primary airway respiratory epithelial cells confirmed that RSV induced a less robust interferon and cytokine response than influenza at the mucosal level. Moreover, we found that the antiviral response of these cells to influenza and RSV correlated with the interferon signature derived from peripheral blood mononuclear cells isolated from patients with acute influenza or RSV bronchiolitis [27]. While peripheral blood responses may just reflect a leakage of immune cells or soluble factors originally activated by RSV in the respiratory tract, they could also be representative of a circulating subset of immune cells that do not contribute directly to the lung pathology but are involved in disease pathogenesis. In a study conducted in children with RSV or influenza LRTI who died, Welliver et al. showed the presence of an extensive antigen load with near absence of CD8+ cells and NK cells in the lungs. These findings partially support our results in whole blood, where we found greater underexpression of genes related to T cells and cytotoxic/NK cells in the most severe forms of RSV LRTI [38].
In the present study we also showed that systemic whole blood immune responses to RSV, influenza, and HRV were quantitatively and qualitatively different. RSV induced significant overexpression of neutrophil genes, which were less expressed, or even suppressed, in children with influenza or HRV infection. Although children with RSV LRTI had illnesses comparable with those of children with HRV or influenza in terms of the severity score or duration of hospitalization, RSV induced a more profound suppression of the adaptive immune response, as shown by the greater underexpression of T and B cell genes that mirrored the severity of the disease. It is remarkable that the suppression of B cell genes was still present when patients' samples were analyzed 1 mo after the acute infection. This profound suppression of B cells may explain, at least in part, the lack of protective antibody responses after acute RSV infection. Our results also indicate that RSV suppressed both the adaptive and innate responses more effectively in younger infants. These observations will require confirmation and further analysis using other approaches, as they may have implications for RSV vaccine development.
Our study has limitations. Study samples were obtained after laboratory confirmation of viral LRTI, a median of 2 d after hospital admission, which may in fact reflect a time point after the immune response and cytokine peak had occurred. In addition, the signatures were derived only from infants requiring hospitalization, which represents the tip of the iceberg of the disease spectrum caused by RSV. Nevertheless, it serves as a reference, and warrants future research including studies with earlier, sequential samples as well as samples from infants with milder RSV infection who are managed as outpatients. A great proportion of children in this study were of Hispanic background, which could limit the generalizability of the results. However, we validated the RSV signature in two independent cohorts of patients with different ethnic backgrounds enrolled in Finland and Ohio. Lastly, profiles were derived from peripheral whole blood and not from the respiratory mucosa, which may not necessarily reflect what is occurring in the lungs, the primary site of infection.
In conclusion, this study provides evidence of the profound systemic dysregulation of both the innate and adaptive immune response induced by RSV infection in children, and confirms the value of gene expression profiling as a practical and powerful strategy to objectively stratify children with acute RSV LRTI. Although this is a small study that will need to be replicated in a larger number of patients, we showed that the genomic scores derived from patients enrolled a median of 48 h after hospitalization correlated with total length of hospitalization and duration of supplemental oxygen. The practicality of using this molecular disease severity score for RSV bronchiolitis may have implications in the clinical setting. On one hand, it may help in triaging patients when they first present to the emergency department or pediatric office, but it could also be useful for monitoring clinical changes during the course of the disease, with the ultimate goal of predicting clinical outcomes. Indeed, there are novel and affordable PCR-based tools with faster turnaround time currently under development that will facilitate the application of transcriptional profiles in “real time” in the clinical setting. Ultimately, this study demonstrates that a large amount of microarray data can be translated into a biologically meaningful context that can be correlated with disease severity and applied in the relevant clinical setting.
Supporting Information
Zdroje
1. BryceJ, Boschi-PintoC, ShibuyaK, BlackRE (2005) WHO estimates of the causes of death in children. Lancet 365 : 1147–1152.
2. MulhollandK, HiltonS, AdegbolaR, UsenS, OparaugoA, et al. (1997) Randomised trial of Haemophilus influenzae type-b tetanus protein conjugate vaccine [corrected] for prevention of pneumonia and meningitis in Gambian infants. Lancet 349 : 1191–1197.
3. KlugmanKP, MadhiSA, HuebnerRE, KohbergerR, MbelleN, et al. (2003) A trial of a 9-valent pneumococcal conjugate vaccine in children with and those without HIV infection. N Engl J Med 349 : 1341–1348.
4. MadhiSA, KlugmanKP (2004) A role for Streptococcus pneumoniae in virus-associated pneumonia. Nat Med 10 : 811–813.
5. BerkleyJA, MunywokiP, NgamaM, KazunguS, AbwaoJ, et al. (2010) Viral etiology of severe pneumonia among Kenyan infants and children. JAMA 303 : 2051–2057.
6. HallCB, WeinbergGA, IwaneMK, BlumkinAK, EdwardsKM, et al. (2009) The burden of respiratory syncytial virus infection in young children. N Engl J Med 360 : 588–598.
7. NairH, NokesDJ, GessnerBD, DheraniM, MadhiSA, et al. (2010) Global burden of acute lower respiratory infections due to respiratory syncytial virus in young children: a systematic review and meta-analysis. Lancet 375 : 1545–1555.
8. GarciaCG, BhoreR, Soriano-FallasA, TrostM, ChasonR, et al. (2010) Risk factors in children hospitalized with RSV bronchiolitis versus non-RSV bronchiolitis. Pediatrics 126: e1453–e1460.
9. NolteFS, MarshallDJ, RasberryC, SchievelbeinS, BanksGG, et al. (2007) MultiCode-PLx system for multiplexed detection of seventeen respiratory viruses. J Clin Microbiol 45 : 2779–2786.
10. GarciaC, Soriano-FallasA, LozanoJ, LeosN, GomezAM, et al. (2012) Decreased innate immune cytokine responses correlate with disease severity in children with respiratory syncytial virus and human rhinovirus bronchiolitis. Pediatr Infect Dis J 31 : 86–89.
11. MellaC, Suarez-ArrabalMC, LopezS, StephensJ, FernandezS, et al. (2013) Innate immune dysfunction is associated with enhanced disease severity in infants with severe respiratory syncytial virus bronchiolitis. J Infect Dis 207 : 564–573.
12. TalA, BavilskiC, YohaiD, BearmanJE, GorodischerR, et al. (1983) Dexamethasone and salbutamol in the treatment of acute wheezing in infants. Pediatrics 71 : 13–18.
13. BerryMP, GrahamCM, McNabFW, XuZ, BlochSA, et al. (2010) An interferon-inducible neutrophil-driven blood transcriptional signature in human tuberculosis. Nature 466 : 973–977.
14. BanchereauR, Jordan-VillegasA, ArduraM, MejiasA, BaldwinN, et al. (2012) Host immune transcriptional profiles reflect the variability in clinical disease manifestations in patients with Staphylococcus aureus infections. PLoS ONE 7: e34390 doi:10.1371/journal.pone.0034390
15. RamiloO, AllmanW, ChungW, MejiasA, ArduraM, et al. (2007) Gene expression patterns in blood leukocytes discriminate patients with acute infections. Blood 109 : 2066–2077.
16. AllantazF, ChaussabelD, StichwehD, BennettL, AllmanW, et al. (2007) Blood leukocyte microarrays to diagnose systemic onset juvenile idiopathic arthritis and follow the response to IL-1 blockade. J Exp Med 204 : 2131–2144.
17. BenjaminiY, HochbergY (1995) Controlling the false discovery rate: a practical and powerful approach to multiple testing. J R Stat Soc Series B Stat Methodol 57 : 289–300.
18. WittkowskiKM, SongT (2010) Nonparametric methods for molecular biology. Methods Mol Biol 620 : 105–153.
19. WittkowskiKM, LeeE, NussbaumR, ChamianFN, KruegerJG (2004) Combining several ordinal measures in clinical studies. Stat Med 23 : 1579–1592.
20. ArduraMI, BanchereauR, MejiasA, Di PucchioT, GlaserC, et al. (2009) Enhanced monocyte response and decreased central memory T cells in children with invasive Staphylococcus aureus infections. PLoS ONE 4: e5446 doi:10.1371/journal.pone.0005446
21. ChaussabelD, QuinnC, ShenJ, PatelP, GlaserC, et al. (2008) A modular analysis framework for blood genomics studies: application to systemic lupus erythematosus. Immunity 29 : 150–164.
22. ObermoserG, PresnellS, DomicoK, XuH, WangY, et al. (2013) Systems scale interactive exploration reveals quantitative and qualitative differences in response to influenza and pneumococcal vaccines. Immunity 38 : 831–844.
23. PanklaR, BuddhisaS, BerryM, BlankenshipDM, BancroftGJ, et al. (2009) Genomic transcriptional profiling identifies a candidate blood biomarker signature for the diagnosis of septicemic melioidosis. Genome Biol 10: R127.
24. ShiL, CampbellG, JonesWD, CampagneF, WenZ, et al. (2010) The MicroArray Quality Control (MAQC)-II study of common practices for the development and validation of microarray-based predictive models. Nat Biotechnol 28 : 827–838.
25. HuangYC, LiZ, HyseniX, SchmittM, DevlinRB, et al. (2008) Identification of gene biomarkers for respiratory syncytial virus infection in a bronchial epithelial cell line. Genomic Med 2 : 113–125.
26. MartinezI, LombardiaL, Garcia-BarrenoB, DominguezO, MeleroJA (2007) Distinct gene subsets are induced at different time points after human respiratory syncytial virus infection of A549 cells. J Gen Virol 88 : 570–581.
27. IoannidisI, McNallyB, WilletteM, PeeplesME, ChaussabelD, et al. (2012) Plasticity and virus specificity of the airway epithelial cell immune response during respiratory virus infection. J Virol 86 : 5422–5436.
28. BhojVG, SunQ, BhojEJ, SomersC, ChenX, et al. (2008) MAVS and MyD88 are essential for innate immunity but not cytotoxic T lymphocyte response against respiratory syncytial virus. Proc Natl Acad Sci U S A 105 : 14046–14051.
29. JanssenR, PenningsJ, HodemaekersH, BuismanA, van OostenM, et al. (2007) Host transcription profiles upon primary respiratory syncytial virus infection. J Virol 81 : 5958–5967.
30. PenningsJL, SchuurhofA, HodemaekersHM, BuismanA, de RondLC, et al. (2011) Systemic signature of the lung response to respiratory syncytial virus infection. PLoS ONE 6: e21461 doi:10.1371/journal.pone.0021461
31. FjaerliHO, BukholmG, SkjaeretC, HoldenM, NakstadB (2007) Cord blood gene expression in infants hospitalized with respiratory syncytial virus bronchiolitis. J Infect Dis 196 : 394–404.
32. FjaerliHO, BukholmG, KrogA, SkjaeretC, HoldenM, et al. (2006) Whole blood gene expression in infants with respiratory syncytial virus bronchiolitis. BMC Infect Dis 6 : 175.
33. BucasasKL, MianAI, Demmler-HarrisonGJ, CavinessAC, PiedraPA, et al. (2013) Global gene expression profiling in infants with acute respiratory syncytial virus broncholitis demonstrates systemic activation of interferon signaling networks. Pediatr Infect Dis J 32: e68–e76.
34. SmithSB, DampierW, TozerenA, BrownJR, Magid-SlavM (2012) Identification of common biological pathways and drug targets across multiple respiratory viruses based on human host gene expression analysis. PLoS ONE 7: e33174 doi:10.1371/journal.pone.0033174
35. ZaasAK, ChenM, VarkeyJ, VeldmanT, HeroAO3rd, et al. (2009) Gene expression signatures diagnose influenza and other symptomatic respiratory viral infections in humans. Cell Host Microbe 6 : 207–217.
36. GarofaloRP, HintzKH, HillV, PattiJ, OgraPL, et al. (2005) A comparison of epidemiologic and immunologic features of bronchiolitis caused by influenza virus and respiratory syncytial virus. J Med Virol 75 : 282–289.
37. GillMA, LongK, KwonT, MunizL, MejiasA, et al. (2008) Differential recruitment of dendritic cells and monocytes to respiratory mucosal sites in children with influenza virus or respiratory syncytial virus infection. J Infect Dis 198 : 1667–1676.
38. WelliverTP, GarofaloRP, HosakoteY, HintzKH, AvendanoL, et al. (2007) Severe human lower respiratory tract illness caused by respiratory syncytial virus and influenza virus is characterized by the absence of pulmonary cytotoxic lymphocyte responses. J Infect Dis 195 : 1126–1136.
Štítky
Interní lékařstvíČlánek vyšel v časopise
PLOS Medicine
2013 Číslo 11
- Alternativní léčebné možnosti u hypercholesterolemie při intoleranci statinů
- Vliv kombinace nutraceutik na remodelaci levé komory srdeční u osob s metabolickým syndromem
- Nutraceutika a jejich ovlivnění mírného kardiometabolického rizika
- Princip účinku medu v léčbě chronických i infikovaných ran
- Superoxidovaný roztok a jeho využití v léčbě ran
Nejčtenější v tomto čísle
- A Brief Patient-Reported Outcomes Quality of Life (PROQOL) Instrument to Improve Patient Care
- Burden of Depressive Disorders by Country, Sex, Age, and Year: Findings from the Global Burden of Disease Study 2010
- From Ideals to Tools: Applying Human Rights to Maternal Health
- Role of DNA Methylation and Epigenetic Silencing of in Endometrial Cancer Development