
Causal Relationship between Obesity and Vitamin D Status: Bi-Directional Mendelian Randomization Analysis of Multiple Cohorts
Background:
Obesity is associated with vitamin D deficiency, and both are areas of active public health concern. We explored the causality and direction of the relationship between body mass index (BMI) and 25-hydroxyvitamin D [25(OH)D] using genetic markers as instrumental variables (IVs) in bi-directional Mendelian randomization (MR) analysis.
Methods and Findings:
We used information from 21 adult cohorts (up to 42,024 participants) with 12 BMI-related SNPs (combined in an allelic score) to produce an instrument for BMI and four SNPs associated with 25(OH)D (combined in two allelic scores, separately for genes encoding its synthesis or metabolism) as an instrument for vitamin D. Regression estimates for the IVs (allele scores) were generated within-study and pooled by meta-analysis to generate summary effects.
Associations between vitamin D scores and BMI were confirmed in the Genetic Investigation of Anthropometric Traits (GIANT) consortium (n = 123,864). Each 1 kg/m2 higher BMI was associated with 1.15% lower 25(OH)D (p = 6.52×10⁻²⁷). The BMI allele score was associated both with BMI (p = 6.30×10−62) and 25(OH)D (−0.06% [95% CI −0.10 to −0.02], p = 0.004) in the cohorts that underwent meta-analysis. The two vitamin D allele scores were strongly associated with 25(OH)D (p≤8.07×10−57 for both scores) but not with BMI (synthesis score, p = 0.88; metabolism score, p = 0.08) in the meta-analysis. A 10% higher genetically instrumented BMI was associated with 4.2% lower 25(OH)D concentrations (IV ratio: −4.2 [95% CI −7.1 to −1.3], p = 0.005). No association was seen for genetically instrumented 25(OH)D with BMI, a finding that was confirmed using data from the GIANT consortium (p≥0.57 for both vitamin D scores).
Conclusions:
On the basis of a bi-directional genetic approach that limits confounding, our study suggests that a higher BMI leads to lower 25(OH)D, while any effects of lower 25(OH)D increasing BMI are likely to be small. Population level interventions to reduce BMI are expected to decrease the prevalence of vitamin D deficiency.
Please see later in the article for the Editors' Summary
Published in the journal:
. PLoS Med 10(2): e32767. doi:10.1371/journal.pmed.1001383
Category:
Research Article
doi:
https://doi.org/10.1371/journal.pmed.1001383
Summary
Background:
Obesity is associated with vitamin D deficiency, and both are areas of active public health concern. We explored the causality and direction of the relationship between body mass index (BMI) and 25-hydroxyvitamin D [25(OH)D] using genetic markers as instrumental variables (IVs) in bi-directional Mendelian randomization (MR) analysis.
Methods and Findings:
We used information from 21 adult cohorts (up to 42,024 participants) with 12 BMI-related SNPs (combined in an allelic score) to produce an instrument for BMI and four SNPs associated with 25(OH)D (combined in two allelic scores, separately for genes encoding its synthesis or metabolism) as an instrument for vitamin D. Regression estimates for the IVs (allele scores) were generated within-study and pooled by meta-analysis to generate summary effects.
Associations between vitamin D scores and BMI were confirmed in the Genetic Investigation of Anthropometric Traits (GIANT) consortium (n = 123,864). Each 1 kg/m2 higher BMI was associated with 1.15% lower 25(OH)D (p = 6.52×10⁻²⁷). The BMI allele score was associated both with BMI (p = 6.30×10−62) and 25(OH)D (−0.06% [95% CI −0.10 to −0.02], p = 0.004) in the cohorts that underwent meta-analysis. The two vitamin D allele scores were strongly associated with 25(OH)D (p≤8.07×10−57 for both scores) but not with BMI (synthesis score, p = 0.88; metabolism score, p = 0.08) in the meta-analysis. A 10% higher genetically instrumented BMI was associated with 4.2% lower 25(OH)D concentrations (IV ratio: −4.2 [95% CI −7.1 to −1.3], p = 0.005). No association was seen for genetically instrumented 25(OH)D with BMI, a finding that was confirmed using data from the GIANT consortium (p≥0.57 for both vitamin D scores).
Conclusions:
On the basis of a bi-directional genetic approach that limits confounding, our study suggests that a higher BMI leads to lower 25(OH)D, while any effects of lower 25(OH)D increasing BMI are likely to be small. Population level interventions to reduce BMI are expected to decrease the prevalence of vitamin D deficiency.
Please see later in the article for the Editors' Summary
Introduction
The prevalence of obesity has increased in the last two decades and it is presently the most common and costly nutritional problem [1]–[4]. In the United States, one-third of the population is affected by obesity, according to the National Health and Nutrition Examination Survey [5]. Despite a known genetic contribution, the increase in obesity prevalence has been largely attributed to lifestyle changes, which means that it is amenable to modification through public health and other interventions [6].
Vitamin D deficiency is another increasingly prevalent public health concern in developed countries [7]–[9], and there is evidence that vitamin D metabolism, storage, and action both influence and are influenced by adiposity. Observational studies have reported an increased risk of vitamin D deficiency in those who are obese; however, the underlying explanations and direction of causality are unclear [10]. Active vitamin D (1,25-dihydroxyvitamin D) may influence the mobilisation of free fatty acids from the adipose tissue [11]. In vitro experiments in rats have also shown that large doses of vitamin D2 lead to increases in energy expenditure due to uncoupling of oxidative phosphorylation in adipose tissues [12]. However, randomized controlled trials (RCTs) testing the effect of vitamin D supplementation on weight loss in obese or overweight individuals have provided inconsistent findings [13]–[15]. It has also been suggested that obesity could result from an excessive adaptive winter response, and that the decline in vitamin D skin synthesis due to reduced sunlight exposure contributes to the tendency to increase fat mass during the colder periods of the year [16],[17]. However, vitamin D is stored in the adipose tissue and, hence, perhaps the most likely explanation for the association is that the larger storage capacity for vitamin D in obese individuals leads to lower circulating 25-hydroxyvitamin D [25(OH)D] concentrations, a marker for nutritional status [18].
In the Mendelian randomization (MR) approach, causality is inferred from associations between genetic variants that mimic the influence of a modifiable environmental exposure and the outcome of interest [19]. If lower vitamin D intake/status is causally related to obesity, a genetic variant associated with lower 25(OH)D concentrations should be associated with higher body mass index (BMI) (in proportion to the effect on 25(OH)D). Conversely, if obesity leads to lower vitamin D status, then genetic variants associated with higher BMI should be related to lower 25(OH)D concentrations. The genetic associations, unlike the directly observed associations for vitamin D intake/status, should be less prone to confounding by lifestyle and socio-economic factors and be free from reverse causation as genotypes are invariant and assigned at random before conception [20]. The use of multiple SNPs to index the intermediate exposure of interest increases power and reduces the risk of alternative biological pathways (pleiotropy) affecting the observed associations between the genotype and the outcome [21],[22].
In the present study, we investigated the relationship between BMI, a commonly used measure for monitoring the prevalence of obesity at the population level, and vitamin D status and we inferred causality by using genetic variants as instruments in bi-directional MR analyses. Meta-analysis included data from 21 studies comprising up to 42,024 individuals.
Methods
Ethics Statement
All participants provided written, informed consent, and ethical permission was granted by the local research ethics committees for all participating studies.
Participants
The collaboration investigating the association of vitamin D and the risk of cardiovascular disease and related traits (D-CarDia) consists of European ancestry cohorts from the United Kingdom (UK), United States (US), Canada, Finland, Germany, and Sweden. This study comprised a meta-analysis of directly genotyped and imputed SNPs from 21 cohorts totalling 42,024 individuals (Table 1). An expanded description of the participating studies is provided in the Text S2.

To replicate our findings on the association between the vitamin D-related SNPs and allele scores with BMI, we used the data from the genome-wide meta-analyses on BMI conducted as part of the Genetic Investigation of Anthropometric Traits (GIANT) consortium [23]. The GIANT meta-analyses consisted of 46 studies with up to 123,865 adults of European ancestry, including the 1958 British Birth Cohort, Framingham Heart study, Nurses' Health Study, Twins UK, UK Blood Services Common Control Collection, the Amish Family Osteoporosis Study, Health2000 GENMETS sub-sample, and Northern Finland Birth Cohort 1966, which were also part of the D-CarDia collaboration.
Genotyping
We selected 12 established BMI-related SNPs (fat mass and obesity-associated, [FTO] - rs9939609, melanocortin 4 receptor [MC4R] - rs17782313, transmembrane protein 18 [TMEM18] - rs2867125, SH2B adaptor protein 1 [SH2B1] - rs7498665, brain-derived neurotrophic factor [BDNF] - rs4074134, potassium channel tetramerisation domain containing 15 [KCTD15] - rs29941, ets variant 5 [ETV5] - rs7647305, SEC16 homolog B [SEC16B] - rs10913469, Fas apoptotic inhibitory molecule 2 [FAIM2] - rs7138803, neuronal growth regulator 1 [NEGR1] - rs3101336, mitochondrial carrier 2 [MTCH2] - rs10838738, and glucosamine-6-phosphate deaminase 2 [GNPDA2] - rs10938397) for our analysis based on the study by Li et al. [24] and previously published genome-wide association studies for obesity-related traits [23],[25],[26]. The four vitamin D-related SNPs (DHCR7 - rs12785878, CYP2R1 - rs10741657, GC - rs2282679, and CYP24A1 - rs6013897) were chosen on the basis of the recent genome-wide association study on 25(OH)D [27]. The studies that did not have genotyped data analysed imputed or proxy SNPs (r2 = 1) as available (with a call threshold of 0.9 for the SNPs imputed with Impute; for those imputed with MACH, a call threshold of 0.8 was used) [28]. The genetic data for most studies were obtained from genome-wide association platforms, but for some studies, variants were genotyped de novo (MRC Ely, the Canadian Multicentre Osteoporosis Study, the Hertfordshire cohort study) or obtained through metabochip custom array (MRC Ely). Five studies did not have all the BMI-related SNPs (Framingham Heart Study [one missing SNP], Hertfordshire cohort study [three missing SNPs], InCHIANTI [two missing SNPs], PIVUS [two missing SNPs], and ULSAM [three missing SNPs]) and were still included in the BMI allele score analysis. Table S1 shows the minor allele frequencies for the BMI and vitamin D SNPs that were included in the analysis. A detailed description of the genotyping methods is provided in Text S2.
Statistical Analysis
Analyses in each study were performed according to a standardized analysis plan. When used as outcome variables, 25(OH)D and BMI were natural log transformed to be more closely approximated by normal distributions. If multiplied by 100, coefficients from linear regression models with ln transformed outcomes can be interpreted as the percentage difference in the outcome [29]. Models with BMI as an outcome were adjusted for age, sex, geographical site, and/or principal components from population stratification analysis (depending on data available); models with 25(OH)D as the outcome were additionally adjusted for month of blood sample collection (as a categorical variable) to account for seasonal variation and laboratory batch, where relevant. To assess the BMI relationship with 25(OH)D and vice versa, each study ran linear regression models adjusting for the covariates listed for each outcome, and the models were repeated stratifying by sex.
For the BMI SNPs, the effect allele was the BMI raising allele as established by Speliotes et al. [23]. We created a weighted score in each study [30], by multiplying each SNP (coded as 0–2) by a weight based on its effect size with BMI in the meta-analysis by Speliotes et al. [23]. The weighted BMI allele score was rescaled over the sum of weights for the available SNPs in each study to facilitate interpretation [30]. For the vitamin D SNPs, the effect allele was the 25(OH)D lowering allele as established by the SUNLIGHT Consortium [27]. As external weights were not available and the use of internal weights could bias the instrumental variable (IV) results [31], we performed an unweighted allele score analysis for the vitamin D SNPs. Vitamin D SNPs were used to form two separate allele scores [32]: a “synthesis” allele score, created by summing the risk alleles in DHCR7 and CYP2R1, and a “metabolism” allele score, created by summing the risk alleles in GC and CYP24A1 (Figure S1). Synthesis allele score was not created for the LURIC study (one missing SNP) and both synthesis and metabolism allele scores were not created for the MRC Ely study (two missing SNPs). The synthesis allele score included the SNPs that contribute directly to the production of 25(OH)D, and hence, for which the association with the outcome can be readily estimated based on the magnitude of the association between the score and 25(OH)D [32]. All analyses were done separately for the “metabolism” SNPs that are involved in the clearance or transport of 25(OH)D (with possible influences on bioavailability [33]) as the quantification of the association with the outcome based on the observed SNP-25(OH)D association is more difficult [32]. We also evaluated the joint contribution of synthesis and metabolism scores on BMI by including both vitamin D scores as separate variables in a multiple regression model. To examine the strength of the allele scores as instruments, the F-statistic was approximated from the proportion of variation in the respective phenotype (R2) explained by the allele score, [F-stat = (R2×(n−2))/(1−R2)] [34].
To confirm our findings on the association between the vitamin D-related SNPs and allele scores with BMI in a larger sample, we used the summary statistics for the four vitamin D-related SNPs from the GIANT consortium. These SNPs were combined into synthesis and metabolism allele scores using an approximation method as previously described [35]. The individual SNP association with BMI is then weighted according to its predefined effect size and meta-analysed using the inverse-variance method with the other SNPs in the score [35]. The formal MR analyses to estimate the possible causal effect of BMI on 25(OH)D (and vice versa) were done using the IV ratio method [20],[36]. To estimate the IV ratio for the BMI effect on 25(OH)D, the meta-analysed association of the BMI allele score with 25(OH)D was divided by the association of BMI allele score with BMI. The variance for the IV ratio was estimated using a Taylor expansion [36]. The corresponding calculation was done to establish the 25(OH)D effect on BMI, with the IV ratio method applied separately for the two vitamin D allele scores. The joint contribution of the two vitamin D scores on BMI was assessed by multivariate meta-analysis [37], which incorporated the covariance matrix as estimated by study specific analyses.
In the presence of heterogeneity of association between the studies, random effects meta-analyses [38] were run, otherwise fixed effects models were used. Univariate meta-regression models were run to assess differences in the observed associations by study level factors of sex, average BMI (BMI≤25 kg/m2 versus >25 kg/m2), the average age of participants (≤40, 41–60, and ≥61 y old), continent (North America versus Europe), and vitamin D assay (radio-immunoassay, enzyme-linked radio-immunoassay, and mass spectrometry). Power calculations for IV regression were performed by simulation [32] on the basis of associations observed between the phenotypes and their genetic proxies. For comparability across instruments/outcomes, power was determined for 0.02 log unit increase/decrease by decile, approximately corresponding to the association observed between BMI and 25(OH)D. To evaluate the ability to detect weaker effects on BMI using the synthesis and metabolism scores, power was also calculated for a 50% weaker effect (0.01 log unit increase/decrease). All meta-analyses and power calculations were performed at the Institute of Child Health (University College London, London) using STATA version 12 [39].
Results
Phenotypic Association between BMI and 25(OH)D Concentrations
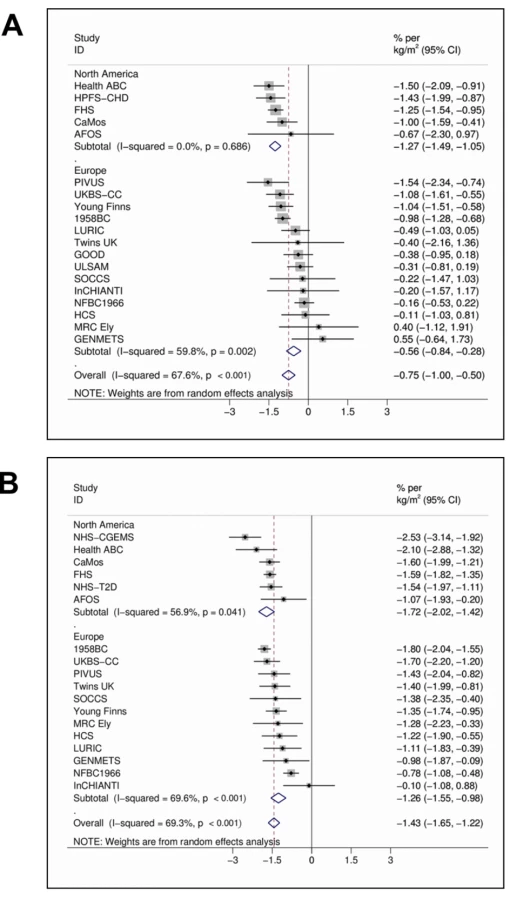
In the meta-analyses of 21 studies, each unit (kg/m2) increase in BMI was associated with 1.15% (95% CI 0.94%–1.36%, p = 6.52×10⁻²⁷) lower concentrations of 25(OH)D after adjusting for age, sex, laboratory batch, month of measurement, and principal components. The inverse association between BMI and 25(OH)D was stronger among the studies from North America than those from Europe (−1.58% [−1.81% to −1.36%], p = 1.01×10−43 versus −0.91% [−1.18% to −0.64%], p = 4.55×10⁻¹¹; pmeta-regression = 0.004) and for women than men (−1.43% [−1.65% to −1.22%], p = 1.13×10−38 versus −0.75% [−1.00% to −0.50%], p = 3.89×10⁻⁹; pmeta-regression = 4.10×10⁻⁴) while no variation was seen by average age (pmeta-regression = 0.78) or BMI (pmeta-regression = 0.48) (Figure 1A and 1B).
Evaluation of Causal Association Using MR Approach
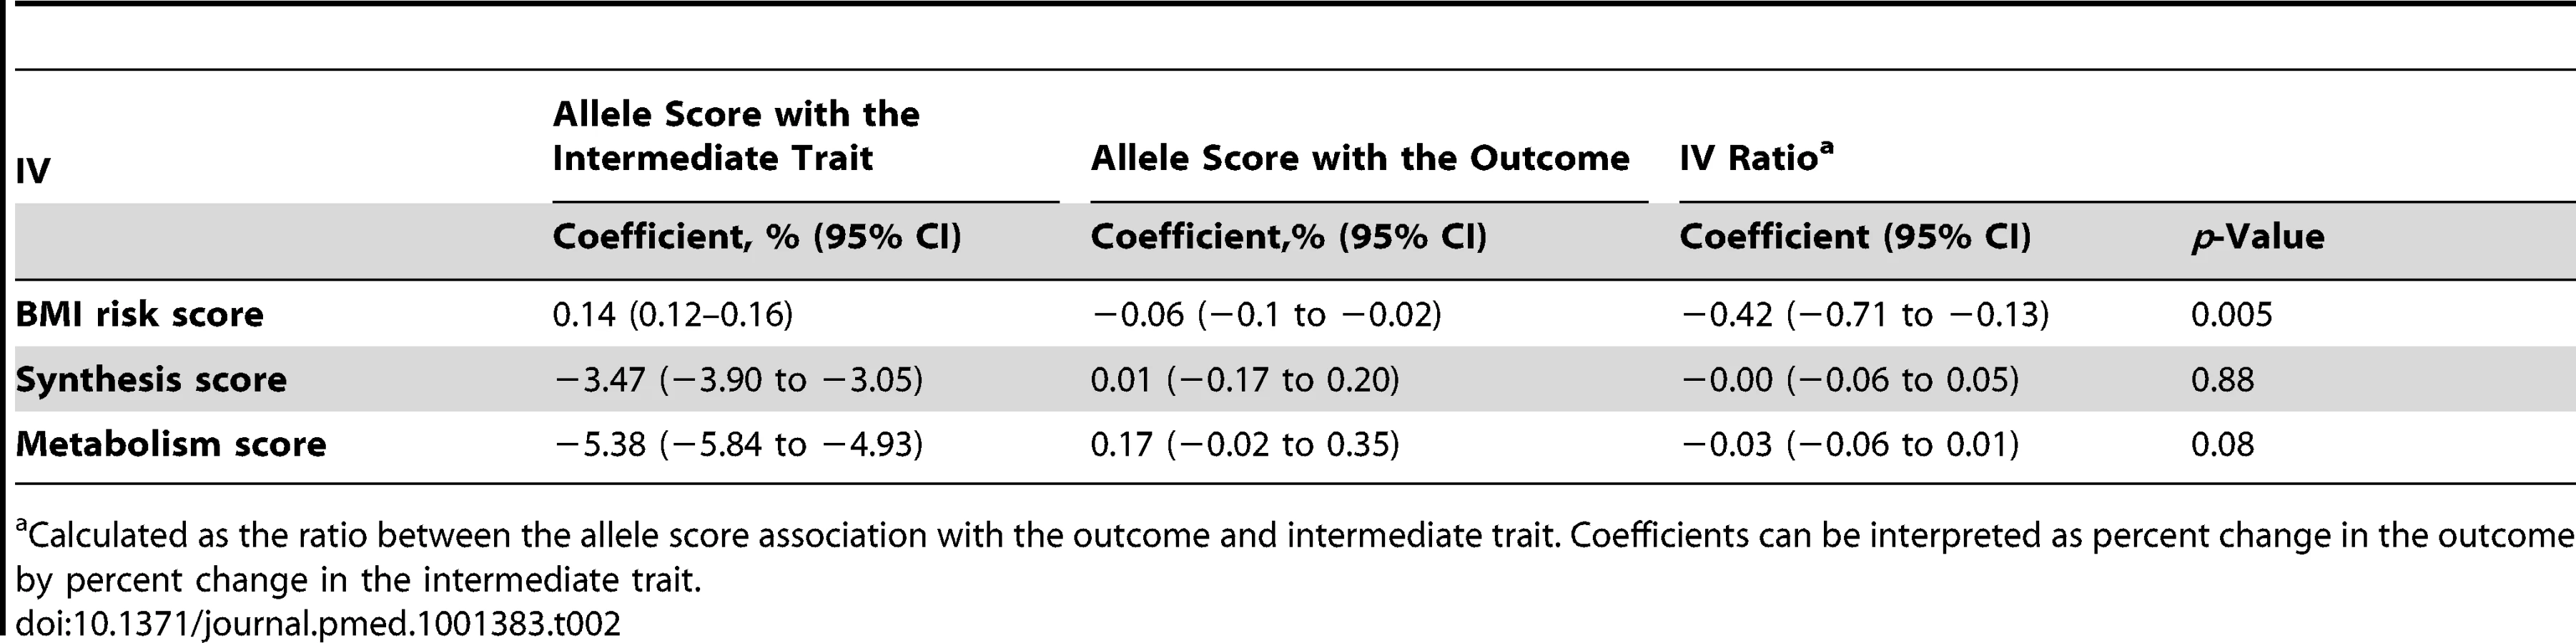
The BMI allele score created from the 12 BMI-related SNPs showed a positive dose-response association with BMI (per unit increase 0.14% [0.12%–0.16%], p = 6.30×10−62), and both vitamin D allele scores showed the expected strong associations with 25(OH)D (per allele in synthesis score: −3.47% [−3.90% to −3.05%], p = 8.07×10−57; metabolism allele score: −5.38% [−5.84% to −4.93%], p = 1.07×10−118) (Figures 2, S2, and S3). The BMI allele score was also associated with 25(OH)D concentrations (per unit increase −0.06%, [−0.10% to −0.02%], p = 0.004) (Figure 3), while no association with BMI was seen for either the vitamin D synthesis or metabolism allele scores (per allele in synthesis score: 0.01% [−0.17% to 0.20%], p = 0.88, metabolism allele score: 0.17% [−0.02% to 0.35%], p = 0.08]) (Figure 4A and 4B). Analyses of joint effects by synthesis and metabolism scores provided no evidence for an association between 25(OH)D and BMI (per allele in synthesis score −0.03% [−0.23% to 0.16%] and metabolism score 0.17% [−0.04% to 0.37%], joint contribution p = 0.26).


In the analyses to establish the direction and causality of BMI–25(OH)D association by the use of the IV ratio, BMI was associated with 25(OH)D: each 10% increase in BMI lead to a 4.2% decrease in 25(OH)D concentrations (−7.1% to −1.3%; p = 0.005). However, the IV ratio analyses provided little evidence for a causal effect of 25(OH)D on BMI (p≥0.08 for both). We have summarised the coefficients for the MR analyses in Table 2.
The lack of association of the vitamin D allele scores with BMI was further confirmed using the GIANT consortium including 123,864 individuals in 46 studies [23]: neither the synthesis nor the metabolism allele score showed any evidence for an association with BMI (p≥0.57 for both) (Table 3).

Additional Analyses
Validation of the genetic instruments
The BMI SNPs and the vitamin D SNPs were all individually associated with BMI and 25(OH)D, respectively (Figures S4 and S5). The exception was KCTD15 SNP, which despite previous evidence for an association [25], was not associated with BMI in our meta-analyses. Across the studies, the 12 BMI SNPs combined as the BMI allele score explained 0.97% of the variation in BMI (F-statistic = 316; n = 32,391). The synthesis allele score explained 0.64% (F-statistic = 230; n = 35,873) and the metabolism allele score 1.26% (F statistic = 489; n = 38,191) of the variation in 25(OH)D. There was no evidence for variation in the BMI allele score–BMI association by continent (pmeta-regression = 0.15) or BMI (pmeta-regression = 0.83). However, the BMI allele score–BMI association was slightly weaker in studies with older compared to younger participants (−0.03% [−0.05% to −0.002%], pmeta-regression = 0.03). The vitamin D allele score–25(OH)D association did not vary by age, BMI, continent, or assay (pmeta-regression≥0.09 for all comparisons).
Evaluation of the genetic outcome associations
Of the 12 individual BMI SNPs, the SNP for FTO was the only one that showed evidence of a univariate association with 25(OH)D (p = 0.050) (Figure S6). None of the four 25(OH)D SNPs were individually associated with BMI (p≥0.10) (Figure S7). The lack of association of the four vitamin D SNPs with BMI was further confirmed using the summary data from the GIANT consortium (p>0.30 for all the SNPs) (Table 3).
The association between BMI allele score and 25(OH)D did not vary by study level factors, including age (pmeta-regression = 0.40), BMI (pmeta-regression = 0.18), continent of study (pmeta-regression = 0.78), or vitamin D assay (pmeta-regression = 0.23). Similarly, there was no evidence for variation in the vitamin D allele score–BMI association by age (pmeta-regression≥0.25 for both scores), or continent (pmeta-regression≥0.50 for both scores). There was also no strong evidence for variation in the vitamin D allele score–BMI association by average BMI of the study (≤25 kg/m2 versus ≥25 kg/m2), although for the synthesis score the meta-regression coefficient was of borderline significance (pmeta-regression = 0.053, Figure S8; pmeta-regression = 0.78 for metabolism score).
Power comparison
Illustrative power calculations are presented in Figure S9. In theory, we had greater power to detect an association between 25(OH)D and BMI using the metabolism score as an instrument, compared with an equal sized association between BMI and 25(OH)D using the BMI risk score. However, if the size of the association between 25(OH)D and BMI was only half that seen between BMI and 25(OH)D, our study would not have been adequately powered even with the inclusion of the GIANT results.
Discussion
Obesity, and perhaps vitamin D deficiency, are among the most important modifiable risk factors for a number of chronic diseases. Obesity and vitamin D status are known to be associated but the direction of the association and whether it is causal has been uncertain. We have presented genetic evidence that higher BMI leads to lower vitamin D status. Conversely, our analyses provided no evidence for a causal role of vitamin D in the development of obesity, although our study was not powered to detect very small effects. These results suggest that although increases in vitamin D status are not likely to help with weight regulation, increased risk of vitamin D deficiency could contribute to the adverse health effects associated with obesity.
The association between obesity and vitamin D status was remarkably consistent across the different populations included in our meta-analyses, being apparent both in men and in women, and in the young and older cohorts alike. Interestingly, the association between obesity and 25(OH)D concentrations appeared stronger for populations in North America compared to Europe, possibly reflecting differences in the distribution of BMI across the continents. Recent intervention studies have shown that obese individuals need higher vitamin D dosages than lean individuals to achieve the same 25(OH)D concentrations [40],[41]. Given that North America has one of the highest rates of obesity in the world [42], our study highlights the importance of considering obesity as a risk factor for vitamin D deficiency with implications on the dosage requirements and possible targeting of relevant health promotion strategies.
The lack of any suggestion for an association between the vitamin D SNPs and BMI in the GIANT consortium (n = 123,864) alongside our own large meta-analyses provides a strong case against linear increases in 25(OH)D having a substantive influence on BMI. This conclusion is in accordance with a recent study on Chinese women (n = 7,000), which also failed to observe evidence for an association with BMI for genetic variants in the vitamin D pathway [43]. Although a recent RCT (n = 77) suggested greater loss in fat mass for women receiving vitamin D [15], previous trials have failed to show any evidence for an effect despite larger treatment groups (n = 200–445), use of higher vitamin D dosages, and equal duration of treatment (12 mo) [13],[14]. Dilution related to the greater volume of distribution has been recently proposed as the most likely explanation for the lower 25(OH)D concentrations in obese individuals [44]. In that study, no evidence was found for reduced bioavailability through increased sequestration of vitamin D in the adipose tissue, which had previously been suggested to contribute to the low 25(OH)D concentrations in obesity [18]. In contrast, intact parathyroid hormone (iPTH) levels [45], which stimulate the 1-α-hydroxylase (CYP27B1) enzyme that converts 25(OH)D to 1,25-dihydroxyvitamin D (the active hormonal form), have been found to be elevated in obesity [46], which could to some extent also contribute to the lower 25(OH)D concentrations in obese individuals. It is also possible that differences in lifestyle could contribute to lower 25(OH)D concentrations in obese compared to normal weight individuals, although the association between obesity and low 25(OH)D concentrations has been found to only modestly attenuate after adjustment for vitamin D-related lifestyle and dietary factors [9].
The main strengths of this study are the large sample size and the individual level population-based data from North America and Europe. We used a bi-directional MR approach to investigate the causal directions between obesity and vitamin D deficiency, observing evidence for reductions in 25(OH)D by BMI but not vice versa. However, based on the biological pathways proposed, a possible effect of 25(OH)D on BMI could be expected to be weaker than the effect of BMI on 25(OH)D. Despite including data from the large GIANT consortium to narrow the range of effects compatible with the data, we are unable to exclude very small effects. Furthermore, while the MR approach enables the approximation of life-long differences in average concentrations, with genetic markers it is not possible to examine the influences arising from the extremes of non-linear distributions [20]. Consequently, we cannot discount a possible effect of severe vitamin D deficiency on BMI due to evidence of non-linearity seen in some studies [47]. In contrast, associations between BMI and 25(OH)D within levels in the obesity range were consistently linear in studies included in our analyses (unpublished data), hence the observed association between higher BMI and lower 25(OH)D is likely to be informative in the context of obesity.
One of the methodological challenges of the MR approach relates to the large sample size requirement, arising from the availability of relatively weak instruments for most exposures [22],[31]. This aspect of the MR approach is also reflected in our study, notably in the relatively small amount of variation explained by all the instruments used. We used the IV ratio method on meta-analyzed coefficients since all studies were not able to share individual level participant data. This method assumes linear relationships and may have less power to detect an effect than other IV methods [48]. However, as shown by the clear outcome of these analyses, we were able to overcome these issues by combining several cohorts with comparable information, allowing us to achieve the large numbers required (maximum n = 42,024) [31]. To confirm the lack of association between vitamin D-related genetic variations and BMI, we were able to expand the analyses by using data from the large GIANT meta-analyses (n = 123,864) [23]. However, this cannot be considered an independent replication, as eight of the studies that were part of the D-CarDia Collaboration were also included in GIANT. The F-statistic is used to measure the strength of an instrument, and an instrument that has a value greater than 10 is considered strong enough to use in IV analyses [49]. In our analyses, the F-statistic was greater than 200 for all instruments used due to our large sample size.
Combining large population-based studies from North America and Europe could lead to confounding by population stratification; however, we adjusted for geographical variation/principal components in all analyses, which appeared adequate, as there was no evidence for heterogeneity by continent for the allele score meta-analyses. An important benefit of the MR approach is that it helps to overcome problems of confounding and reverse causality, which limit the ability to draw causal inferences in non-genetic observational studies [19],[20]. However, it could be argued that as the biological function for some of the BMI SNPs is yet to be established, there could be alternative biological pathways explaining their association with BMI. Using multiple SNPs to index BMI, we were able to minimise the risk of pleiotropic effects, as the effects of alternative pathways reflected by individual SNPs would be expected to be strongly diluted when combined in a multi marker score [21],[22].
In conclusion, we demonstrated that the association between BMI and lower 25(OH)D concentrations in Caucasian populations from North America and Europe can be seen across different age groups and in both men and women. We also show that higher BMI leads to lower vitamin D status, providing evidence for the role of obesity as a causal risk factor for the development of vitamin D deficiency. Together with the suggested increases in vitamin D requirements in obese individuals [45],[50], our study highlights the importance of monitoring and treating vitamin D deficiency as a means of alleviating the adverse influences of excess adiposity on health. Our findings suggest that population level interventions to reduce obesity would be expected to lead to a reduction in the prevalence of vitamin D deficiency.
Supporting Information
Zdroje
1. BaskinML, ArdJ, FranklinF, AllisonDB (2005) Prevalence of obesity in the United States. Obes Rev 6 : 5–7.
2. OgdenCL, CarrollMD, CurtinLR, LambMM, FlegalKM (2010) Prevalence of high body mass index in US children and adolescents, 2007–2008. JAMA 303 : 242–249.
3. BerghoferA, PischonT, ReinholdT, ApovianCM, SharmaAM, et al. (2008) Obesity prevalence from a European perspective: a systematic review. BMC Public Health 8 : 200.
4. ZhengW, McLerranDF, RollandB, ZhangX, InoueM, et al. (2011) Association between body-mass index and risk of death in more than 1 million Asians. N Engl J Med 364 : 719–729.
5. FlegalKM, CarrollMD, KitBK, OgdenCL (2012) Prevalence of obesity and trends in the distribution of body mass index among US adults, 1999–2010. JAMA 307 : 491–497.
6. VimaleswaranKS, LoosRJ (2010) Progress in the genetics of common obesity and type 2 diabetes. Expert Rev Mol Med 12: e7.
7. GindeAA, LiuMC, CamargoCAJr (2009) Demographic differences and trends of vitamin D insufficiency in the US population, 1988–2004. Arch Intern Med 169 : 626–632.
8. Lanham-NewSA, ButtrissJL, MilesLM, AshwellM, BerryJL, et al. (2011) Proceedings of the Rank Forum on vitamin D. Br J Nutr 105 : 144–156.
9. HyppönenE, PowerC (2007) Hypovitaminosis D in British adults at age 45 y: nationwide cohort study of dietary and lifestyle predictors. Am J Clin Nutr 85 : 860–868.
10. EarthmanCP, BeckmanLM, MasodkarK, SibleySD (2012) The link between obesity and low circulating 25-hydroxyvitamin D concentrations: considerations and implications. Int J Obes (Lond) 36 : 387–396.
11. ShiH, NormanAW, OkamuraWH, SenA, ZemelMB (2001) 1alpha,25-Dihydroxyvitamin D3 modulates human adipocyte metabolism via nongenomic action. Faseb J 15 : 2751–2753.
12. FassinaG, MaragnoI, DorigoP, ContessaAR (1969) Effect of vitamin D2 on hormone-stimulated lipolysis in vitro. Eur J Pharmacol 5 : 286–290.
13. SneveM, FigenschauY, JordeR (2008) Supplementation with cholecalciferol does not result in weight reduction in overweight and obese subjects. Eur J Endocrinol 159 : 675–684.
14. ZittermannA, FrischS, BertholdHK, GottingC, KuhnJ, et al. (2009) Vitamin D supplementation enhances the beneficial effects of weight loss on cardiovascular disease risk markers. Am J Clin Nutr 89 : 1321–1327.
15. SalehpourA, ShidfarF, HosseinpanahF, VafaM, RazaghiM, et al. (2012) Vitamin D3 and the risk of CVD in overweight and obese women: a randomised controlled trial. Br J Nutr 1–8.
16. SoaresMJ, MurhadiLL, KurpadAV, Chan She Ping-DelfosWL, PiersLS (2012) Mechanistic roles for calcium and vitamin D in the regulation of body weight. Obes Rev 13 : 592–605.
17. FossYJ (2009) Vitamin D deficiency is the cause of common obesity. Med Hypotheses 72 : 314–321.
18. WortsmanJ, MatsuokaLY, ChenTC, LuZ, HolickMF (2000) Decreased bioavailability of vitamin D in obesity. Am J Clin Nutr 72 : 690–693.
19. Davey SmithG, EbrahimS (2003) ‘Mendelian randomization’: can genetic epidemiology contribute to understanding environmental determinants of disease? Int J Epidemiol 32 : 1–22.
20. LawlorDA, HarbordRM, SterneJA, TimpsonN, Davey SmithG (2008) Mendelian randomization: using genes as instruments for making causal inferences in epidemiology. Stat Med 27 : 1133–1163.
21. Davey SmithG (2011) Random allocation in observational data: how small but robust effects could facilitate hypothesis-free causal inference. Epidemiology 22 : 460–463; discussion 467–468.
22. PalmerTM, LawlorDA, HarbordRM, SheehanNA, TobiasJH, et al. (2012) Using multiple genetic variants as instrumental variables for modifiable risk factors. Stat Methods Med Res 21 : 223–242.
23. SpeliotesEK, WillerCJ, BerndtSI, MondaKL, ThorleifssonG, et al. (2010) Association analyses of 249,796 individuals reveal 18 new loci associated with body mass index. Nat Genet 42 : 937–948.
24. LiS, ZhaoJH, LuanJ, LubenRN, RodwellSA, et al. (2010) Cumulative effects and predictive value of common obesity-susceptibility variants identified by genome-wide association studies. Am J Clin Nutr 91 : 184–190.
25. LoosRJ, LindgrenCM, LiS, WheelerE, ZhaoJH, et al. (2008) Common variants near MC4R are associated with fat mass, weight and risk of obesity. Nat Genet 40 : 768–775.
26. ThorleifssonG, WaltersGB, GudbjartssonDF, SteinthorsdottirV, SulemP, et al. (2009) Genome-wide association yields new sequence variants at seven loci that associate with measures of obesity. Nat Genet 41 : 18–24.
27. WangTJ, ZhangF, RichardsJB, KestenbaumB, van MeursJB, et al. (2010) Common genetic determinants of vitamin D insufficiency: a genome-wide association study. Lancet 376 : 180–188.
28. ZhengJ, LiY, AbecasisGR, ScheetP (2011) A comparison of approaches to account for uncertainty in analysis of imputed genotypes. Genet Epidemiol 35 : 102–110.
29. ColeTJ (2000) Sympercents: symmetric percentage differences on the 100 log(e) scale simplify the presentation of log transformed data. Stat Med 19 : 3109–3125.
30. LinX, SongK, LimN, YuanX, JohnsonT, et al. (2009) Risk prediction of prevalent diabetes in a Swiss population using a weighted genetic score–the CoLaus Study. Diabetologia 52 : 600–608.
31. PierceBL, AhsanH, VanderweeleTJ (2011) Power and instrument strength requirements for Mendelian randomization studies using multiple genetic variants. Int J Epidemiol 40 : 740–752.
32. BerryDJ, VimaleswaranKS, WhittakerJC, HingoraniAD, HypponenE (2012) Evaluation of genetic markers as instruments for mendelian randomization studies on vitamin D. PLoS One 7: e37465 doi:10.1371/journal.pone.0037465.
33. ChunRF, LauridsenAL, SuonL, ZellaLA, PikeJW, et al. (2010) Vitamin D-binding protein directs monocyte responses to 25-hydroxy - and 1,25-dihydroxyvitamin D. J Clin Endocrinol Metab 95 : 3368–3376.
34. Rice JA (1995) Expected values. Mathematical statistics and data analysis. 2nd edition. Pacific Grove (California): Duxbury Press.
35. EhretGB, MunroePB, RiceKM, BochudM, JohnsonAD, et al. (2011) Genetic variants in novel pathways influence blood pressure and cardiovascular disease risk. Nature 478 : 103–109.
36. ThomasDC, LawlorDA, ThompsonJR (2007) Re: Estimation of bias in nongenetic observational studies using “Mendelian triangulation” by Bautista et al. Ann Epidemiol 17 : 511–513.
37. WhiteIR (2009) Multivariate random-effects meta-analysis. The Stata Journal 9 : 40–56.
38. Borenstein M (2009) Introduction to meta-analysis. Chichester: John Wiley & Sons. xxviii.
39. StataCorp (2011). Stata Statistical Software: Release 12: College Station (Texas): StataCorp LP.
40. JordeR, SneveM, EmausN, FigenschauY, GrimnesG (2010) Cross-sectional and longitudinal relation between serum 25-hydroxyvitamin D and body mass index: the Tromso study. Eur J Nutr 49 : 401–407.
41. LeeP, GreenfieldJR, SeibelMJ, EismanJA (2009) Center JR (2009) Adequacy of vitamin D replacement in severe deficiency is dependent on body mass index. Am J Med 122 : 1056–1060.
42. BassettDRJr, PucherJ, BuehlerR, ThompsonDL, CrouterSE (2008) Walking, cycling, and obesity rates in Europe, North America, and Australia. J Phys Act Health 5 : 795–814.
43. DorjgochooT, ShiJ, GaoYT, LongJ, DelahantyR, et al. (2012) Genetic variants in vitamin D metabolism-related genes and body mass index: analysis of genome-wide scan data of approximately 7000 Chinese women. Int J Obes (Lond) 36 : 1252–1255.
44. DrincicAT, ArmasLA, Van DiestEE, HeaneyRP (2012) Volumetric dilution, rather than sequestration best explains the low vitamin D status of obesity. Obesity (Silver Spring) 20 : 1444–1448.
45. BellNH, EpsteinS, GreeneA, SharyJ, OexmannMJ, et al. (1985) Evidence for alteration of the vitamin D-endocrine system in obese subjects. J Clin Invest 76 : 370–373.
46. HolickMF (2007) Vitamin D deficiency. N Engl J Med 357 : 266–281.
47. HyppönenE, BerryD, Cortina-BorjaM, PowerC (2010) 25-Hydroxyvitamin D and pre-clinical alterations in inflammatory and hemostatic markers: a cross sectional analysis in the 1958 British Birth Cohort. PLoS One 5: e10801 doi:10.1371/journal.pone.0010801.
48. BurgessS, ThompsonSG, AndrewsG, SamaniNJ, HallA, et al. (2010) Bayesian methods for meta-analysis of causal relationships estimated using genetic instrumental variables. Stat Med 29 : 1298–1311.
49. StaigerD, StockJH (1997) Instrumental variables regression with weak instruments. Econometrica 65 : 557–586.
50. HuhSY, GordonCM (2008) Vitamin D deficiency in children and adolescents: epidemiology, impact and treatment. Rev Endocr Metab Disord 9 : 161–170.
Štítky
Interní lékařstvíČlánek vyšel v časopise
PLOS Medicine
2013 Číslo 2
- Alternativní léčebné možnosti u hypercholesterolemie při intoleranci statinů
- Vliv kombinace nutraceutik na remodelaci levé komory srdeční u osob s metabolickým syndromem
- Nutraceutika a jejich ovlivnění mírného kardiometabolického rizika
- Princip účinku medu v léčbě chronických i infikovaných ran
- Superoxidovaný roztok a jeho využití v léčbě ran
Nejčtenější v tomto čísle
- Prognosis Research Strategy (PROGRESS) 3: Prognostic Model Research
- Cardiovascular Risk of NSAIDs: Time to Translate Knowledge into Practice
- Prognosis Research Strategy (PROGRESS) 2: Prognostic Factor Research
- Whole Genome Sequencing versus Traditional Genotyping for Investigation of a Outbreak: A Longitudinal Molecular Epidemiological Study