
AA Genotype Exacerbates Effect of Diabetes on Dementia and Alzheimer Disease: A Population-Based Longitudinal Study
In a longitudinal study, Weili Xu and colleagues explore whether variants in two insulin pathway genes modify the association of type 2 diabetes with dementia and AD.
Published in the journal:
. PLoS Med 12(7): e32767. doi:10.1371/journal.pmed.1001853
Category:
Research Article
doi:
https://doi.org/10.1371/journal.pmed.1001853
Summary
In a longitudinal study, Weili Xu and colleagues explore whether variants in two insulin pathway genes modify the association of type 2 diabetes with dementia and AD.
Introduction
An increased risk of dementia and Alzheimer disease (AD) in people with type 2 diabetes has been found in numerous prospective population-based studies, including several meta-analyses using pooled data [1–3]. Older individuals with diabetes have on average a 50% greater risk of dementia compared to those without diabetes [2]. Even prediabetes has been found to be predictive of an increased risk of dementia and AD [4,5]. However, mechanisms for such an association remain unclear. In addition to vascular mechanisms, genetic background has been implicated in AD related to diabetes [6].
Insulin degrading enzyme (IDE) is the primary enzyme responsible for insulin clearance in cells. Changes in insulin metabolism are fundamental to insulin resistance. The gene encoding IDE is located on Chromosome 10 q23-q25 in humans, a region that includes IDE and HHEX (homeobox, hematopoietically expressed) [7]. The protease function of IDE is mediated by the exons of IDE, and the regulation of IDE gene expression is likely buried in the surrounding sequences of exons [7]. Overexpression of IDE in cells has been found to increase insulin degradation [8]. On the other hand, the injection of IDE-specific antibodies into cells inhibits the process of insulin degradation [9]. Variations in HHEX_23 may influence the expression of IDE [10].
IDE has also been shown to effectively degrade different forms of β-amyloid (Aβ) [7], which is involved in AD pathology. Linkage and association studies have shown evidence for an involvement of sequences near to the IDE region in AD [11]. Thus, IDE/HHEX genes could be candidate genes for both type 2 diabetes and AD [7]. Indeed, IDE/HHEX genes have been linked to type 2 diabetes and elevated blood glucose level [12,13]. Although genetic association studies on SNPs in the IDE/HHEX region and AD have produced both positive and negative findings [14], several studies have suggested that genetic variations within the IDE/HHEX gene region may impact both diseases, and thus underlie the association between diabetes and AD [7]. So far, no studies have examined the role of IDE/HHEX genes in such an association in humans.
Within the Kungsholmen Project (KP), we have previously reported an increased risk of dementia and AD in people with diabetes or prediabetes [4,15–18]. In a large population-based study of Swedish twins, we further observed that genetic background contributed to the diabetes–dementia association [18]. On the basis of these findings and other reports, we genotyped two SNPs located in the 276-kb haplotype block including the “tag” SNPs of HHEX_23 (rs1544210) and IDE_9 (rs1887922) that were previously reported to be associated with AD [11,19]. The prevalence of the A (G) allele of HHEX_23 and the T (C) allele of IDE_9 is 50.7% (49.4%) and 82.5% (17.4%), respectively, in the Swedish population [11,19] and 47%–51% (49%–53%) and 82%–84% (16%–18%) in the American and English populations [20], respectively. In the present study, we aimed to explore whether variations in HHEX_23 and IDE_9 play a role in the association of diabetes with dementia and AD using data from two population-based longitudinal studies and a structural MRI study.
Methods
Study Populations
The Kungsholmen Project
The KP is a community-based prospective study on aging and dementia [21]. All registered inhabitants who were living in the Kungsholmen district of Stockholm, Sweden, and were aged ≥75 y on October 1, 1987, were initially invited to participate in the project. At baseline (1987–1989), a two-phase survey that consisted of a screening phase and a clinical phase was implemented to identify prevalent dementia cases. The screening phase included a health interview and administration of the Mini-Mental State Examination (MMSE) in all participants. In the clinical phase, all participants who screened positive for impaired cognitive function (MMSE score ≤ 23) were invited to undertake a comprehensive physical, neurological, and psychiatric examination. After the baseline survey (screening and clinical phase), 225 of 1,700 participants were diagnosed as having prevalent dementia according to the criteria of the Diagnostic and Statistical Manual of Mental Disorders, Third Edition–Revised (DSM-III-R) [22], leaving 1,475 participants for the dementia-free cohort. Of them, two participants had mental disorders, and 172 refused to participate in the first follow-up examination (1991–1993) or had moved [16]. Of the remaining 1,301 dementia-free participants, 970 participants were left for the current study after excluding two individuals with type 1 diabetes and 329 with no blood samples or poor quality of DNA extraction.
During a 9-y follow-up, three clinical examinations were carried out at an average interval of 3 y until 1997–1998. Throughout the follow-up period, of the 970 participants, 346 participants died and 51 did not participate in the second or third follow-up exams.
The Swedish National Study on Aging and Care–Kungsholmen
The Swedish National Study on Aging and Care–Kungsholmen (SNAC-K) is a part of the Swedish National Study on Aging and Care, an ongoing longitudinal project focusing on the aging process and the Swedish care system [23]. The study population consisted of a random sample of all registered inhabitants who were aged ≥60 y living in the Kungsholmen district of Stockholm in March 2001. The sample was stratified by age cohort and year of assessment because of the more rapid changes in health and higher attrition rate among older age groups. In total, 11 age-specific cohorts were chosen with different time intervals of assessment: a 6-y interval in young cohorts (60, 66, and 72 y) and a 3-y interval in older cohorts (78, 81, 84, 87, 90, 93, 96, and ≥99 y). At baseline (2001–2004), among the 4,590 eligible persons, 3,363 (73.3%) participants were examined. Of them, 250 were diagnosed as having prevalent dementia (DSM-III-R), and 3,113 were identified as dementia-free after baseline examination. Of the dementia-free participants, 2,060 were left for the current analysis after excluding five individuals with type 1 diabetes and 1,048 individuals without blood samples or with poor quality of DNA extraction. During the 6-y follow-up period (until 2007–2008), of the 2,060 participants, 588 participants died and 76 refused participation.
SNAC-K MRI study
The MRI sample was a subpopulation of non-disabled and non-demented participants from SNAC-K measured during 2001–2004. In total, 552 consecutive participants received structural MRI scans on a 1.5T scanner (Philips Intera). Of them, 338 participants were included in the analysis after excluding participants with neurological disease (n = 20), suboptimal MRI quality (n = 9), or no genotyping data available (n = 185).
Written informed consent was received from all participants or from informants when the person was cognitively impaired. The Ethics Committee at the Karolinska Institutet approved all phases of the KP, the SNAC-K, and the MRI study.
Data Collection
In both the KP and SNAC-K, data on age, sex, and education were collected from participants at baseline following standardized protocols [20,23]. Education was measured as number of years of formal schooling and was dichotomized (≥8 versus <8 y) [24]. Global cognitive functioning was assessed with the MMSE. Weight and height were measured with a standard scale in light clothing and with no shoes, and body mass index (BMI) was calculated as weight (in kilograms) divided by the square of height (in meters). Arterial blood pressure (i.e., systolic Korotkoff phase I and diastolic phase V) was measured on the right arm with the participant in a sitting position after at least a 5-min rest.
Information on medical history was taken from the inpatient register system [25]. The International Classification of Diseases (ICD-8, ICD-9, and ICD-10) has been used in the system since 1969. Medical characteristics—including BMI, systolic blood pressure (SBP), diastolic blood pressure (DBP), heart disease (ischemic heart disease, heart failure or other myocardial insufficiency, and atrial fibrillation), stroke, and type 2 diabetes—were derived from the inpatient register database and clinical examinations. Medical drugs were coded according to the Anatomical Therapeutic Chemical Classification System [26]. Hypoglycemic drugs included hypoglycemic medications or insulin injection (ATC code A10).
Assessment of Type 2 Diabetes and Prediabetes
Blood samples were taken at the baseline survey. Random blood glucose was measured using a glucose oxidase procedure [27]. Type 2 diabetes was ascertained through medical examinations, inpatient register (ICD-8 and ICD-9 code: 250; ICD-10 codes E11–E14), use of hypoglycemic drugs (ACT code A10), or random blood glucose level ≥ 11.0 mmol/l [16,28]. Prediabetes was defined as a random blood glucose concentration of 7.8–10.99 mmol/l among participants not already diagnosed with diabetes [16,29].
SNP Selection and Genotyping
Genomic DNA was extracted from whole blood samples. We genotyped two markers including HHEX_23 (rs1544210) and IDE_9 (rs1887922) from the region surrounding IDE and spanning a 276-kb linkage disequilibrium block. These two markers were previously identified from 26 markers in the 480-kb region surrounding IDE and were found to be associated with AD by Prince et al. [11] (with linkage disequilibrium metrics) and Björk et al. [19] (based on several independent sets of the Swedish case–control analyses). Within this region, three SNPs—rs2251101 (IDE_7), rs12783634, and rs1999763—were additionally genotyped based on another report showing their possible association with AD in other populations [30].
Genotyping of SNPs was performed using matrix adsorbed laser desorption ionization–time of flight analysis on a Sequenom MassARRAY platform. To verify the polymorphisms of the SNPs, each was tested in a set of 16 Swedish control samples. APOE allelic status was determined using a microsequencing method (AffiGen APOE, Sangtec Medical) based on a polymerase chain reaction with biotinylated primers. The genotyped SNPs can be found at dbSNP (http://www.ncbi.nlm.nih.gov/SNP/). SNP genotyping success rate was >95%. For quality control of SNP genotyping, each 96-well plate contained three or more duplicate samples and a negative control. The concordance rate for genotyping was >99.5%.
Dementia and Alzheimer Disease Diagnosis
In both projects, at each follow-up, all participants underwent a comprehensive clinical examination and cognitive tests. Dementia was diagnosed following the DSM-III-R criteria, in which a validated three-step diagnostic procedure was used as previously reported [31]. In brief, two examining physicians independently made a preliminary diagnosis, and in the case of disagreement, a third opinion was sought to reach a consensus diagnosis. The diagnosis of AD required gradual onset, progressive deterioration, and lack of any other specific causes of dementia, according to the National Institute of Neurological and Communicative Disorders and Stroke–Alzheimer’s Disease and Related Disorders Association (NINCDS-ADRDA) criteria [32]. For the deceased participants, the diagnosis of dementia and its subtypes was made by two physicians through reviewing the medical records and death certificates. The physicians did not have access to the genetic data.
MRI Acquisition and Reading Protocol
The MRI protocol included an axial 3-D T1-weighted fast field echo, an axial proton density/T2 turbo spin echo run twice with a shift of 3 mm, and an axial turbo fluid-attenuated inversion recovery (FLAIR) sequence [33]. Total gray matter volume (GMV) and white matter volume (WMV) were calculated after automatic segmentation of the T1 images in native space using SPM12b software (http://www.fil.ion.ucl.ac.uk/spm/) implemented in Matlab (MathWorks) [34]. All gray matter, white matter, and cerebral spinal fluid (CSF) segments were individually scrutinized for verification of the segmentation accuracy. Hippocampal and lateral ventricular volumes were manually delineated on the T1 images following procedures described previously [35]. White matter hyperintensity (WMH) volumes were manually delineated on the FLAIR images. Intracranial volume (ICV) was obtained by summing up volumes of gray matter, white matter, and CSF. ICV was used to adjust the regional volumes [36], and the adjusted volumes were used in the following analysis.
Statistical Analysis
Statistical differences were examined with chi-square tests for categorical variables and one-way ANOVA for continuous variables, with post hoc comparison. Bonferroni corrections were used for multiple comparisons. Hardy–Weinberg equilibrium for individual loci was assessed using the Pearson chi-square statistic. Logistic regression was used to estimate the odds ratio (OR) and 95% confidence interval for the relation of diabetes to the IDE genes. Cox proportional hazards models were used to estimate the hazard ratio (HR) and 95% CI of incident dementia and AD. For non-demented participants, the follow-up time was calculated from the date of the baseline interview to the date of the last follow-up examination or death. For demented participants, the follow-up time was estimated as the time during which participants were free of dementia plus half of the follow-up time during which dementia developed, because of its insidious onset. The proportional hazards assumption was confirmed by graphs and tests based on Schoenfeld residuals, which showed that the hazards were generally proportional over the follow-up period among groups of participants by diabetes status and genotype of the IDE genes. The combined effect of two factors was assessed by creating dummy variables based on joint exposures to both factors. We examined statistical interaction by incorporating the two variables and their cross-product term in the same model. Age, sex, education, MMSE score, BMI, heart disease, stroke, SBP, DBP, APOE ε4, and follow-up survival status were considered as potential confounders. All dementia (including AD) and AD were used as separate outcomes in Cox and logistic regression analyses. Kaplan–Meier survival analysis was used to compare the cumulative probability of events among participants in different groups.
Multiple imputation by chained equation was used for missing values for blood glucose and genotypes, with 20 completed datasets generated. Age, sex, education, BMI, heart disease, stroke, SBP, DBP, MMSE score, and APOE ε4 were considered as covariates in the multiple imputation.
In the MRI data analysis, linear regression was performed to estimate β coefficients (95% CIs) for diabetes by IDE gene in relation to regional brain volumes, CSF volume, and WMH. All statistical analyses were performed using Stata SE 12.0 for Windows (StataCorp) and SPSS Statistics for Windows, version 22.0 (IBM).
Results
Population Characteristics
In the KP, 82 (8.4%) participants had diabetes and 32 (3.3%) had prediabetes among the 970 dementia-free participants at baseline. The prevalence of diabetes including prediabetes was 11.7% (114/970), which is comparable with that in an elderly Swedish population in 1987 [37]. In the SNAC-K, the prevalence of diabetes including prediabetes was 35.1% (725/2,060), which is similar to that in a Swedish population aged ≥60 y in 2001 [38].
The differences between observed and expected frequencies of HHEX_23 and IDE_9 genotypes were not significant, and Hardy–Weinberg equilibrium was met in both cohorts. The A allele of HHEX_23 was present in 50.6% and 50.7% of the participants in the KP and SNAC-K, respectively. The G allele was carried by 49.4% and 49.3% of the KP and SNAC-K populations, respectively. These frequencies are similar to those in the American English populations [20].
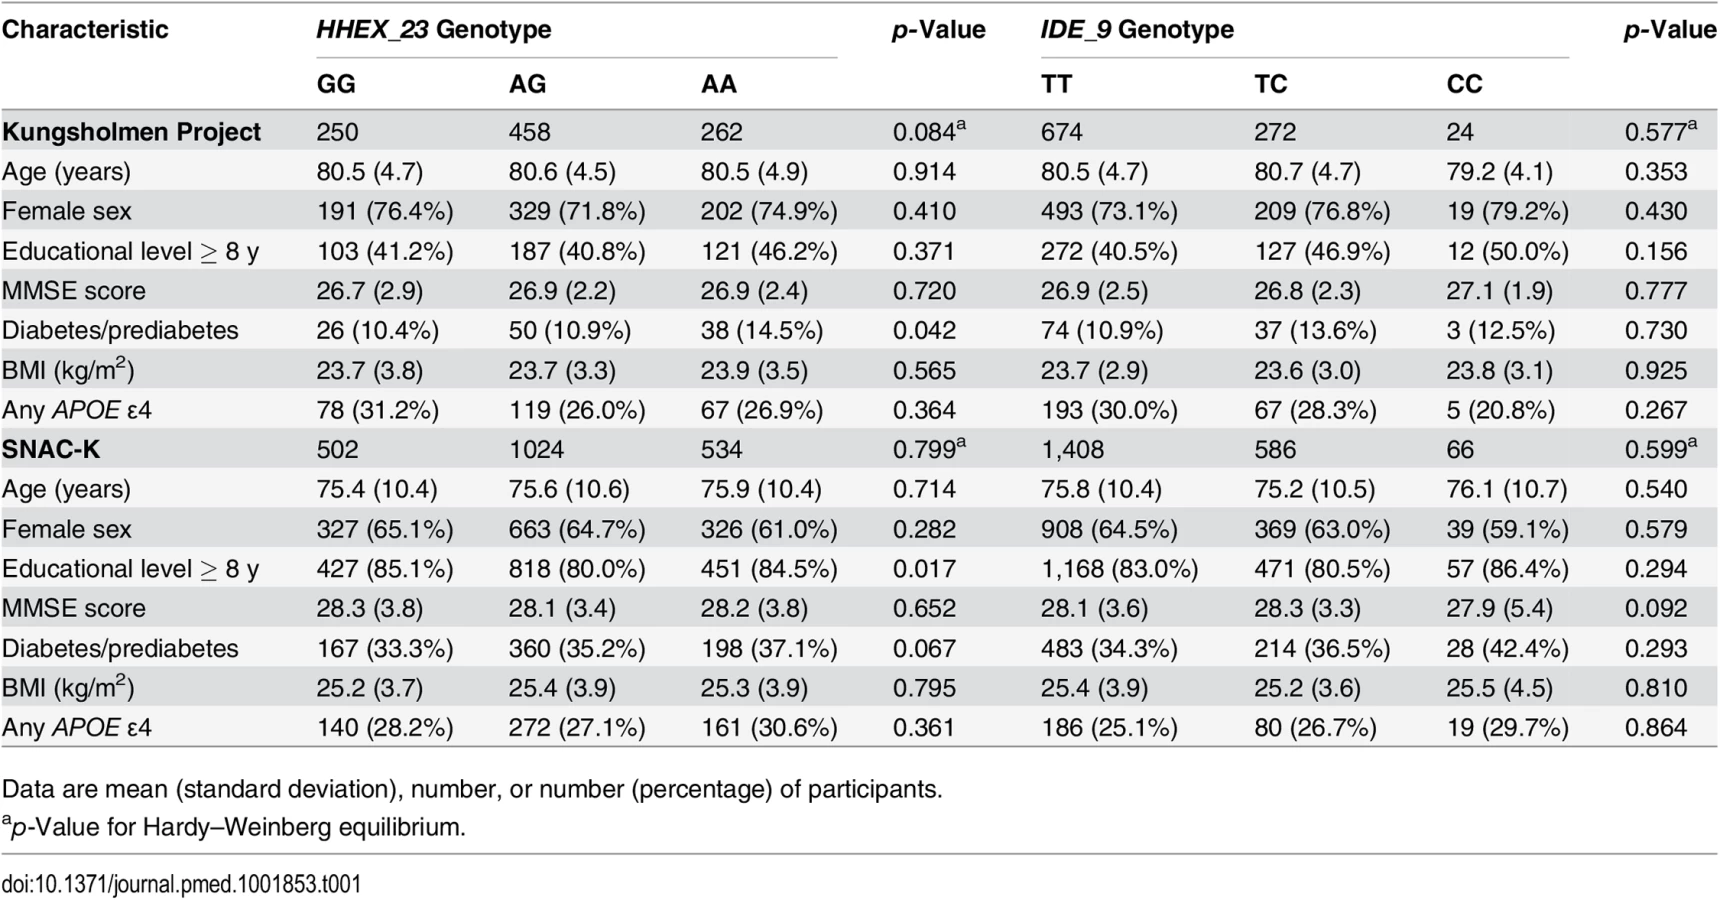
As the effect of diabetes and prediabetes on dementia and AD was similar to that shown in our previous studies [4,16], type 2 diabetes and prediabetes were combined together as “diabetes” in the following analysis. Characteristics of participants with different genotypes of HHEX_23 and IDE_9 were similar, except for the distribution of HHEX_23 variants with regard to education in the SNAC-K and the distribution of HHEX_23 variants with regard to diabetes in both cohorts (Table 1).
Compared to participants with complete data, dropouts and participants with no blood samples for genotyping were older (81.0 versus 80.5 y, p < 0.05, in the KP, and 83.9 versus 83.4 y, p < 0.05, in the SNAC-K) and had lower MMSE scores (26.7 versus 26.9, p = 0.049, in the KP, and 27.1 versus 27.3, p = 0.042, in the SNAC-K), but there were no significant differences in terms of gender, education, BMI, heart disease, stroke, SBP, DBP, or diabetes between these groups in either study population.
HHEX_23 in Relation to Diabetes and Dementia
In crude and multi-adjusted (age, sex, education, stroke, heart disease, SBP, DBP, BMI, and APOE ε4) logistic regression analysis, compared to the HHEX_23-GG genotype, the HHEX_23-AG genotype (adjusted OR 2.36, 95% CI 1.04–5.35 in the KP, and OR 2.13, 95% CI 1.16–3.97, in the SNAC-K) and the AA genotype (adjusted OR 2.41, 95% CI 1.01–5.78, in the KP, and OR 2.36, 95% CI 1.28–3.96, in the SNAC-K) were significantly associated with diabetes in the two cohorts (Table 2). Using the IDE_9-TT as referent group, the TC genotype (adjusted OR 1.08, 95% CI 0.65–1.87, in the KP, and OR 1.18, 95% CI 0.66–3.03, in the SNAC-K) and the CC genotype (adjusted OR 0.84, 95% CI 0.56–2.66, in the KP, and OR 0.78, 95% CI 0.70–3.21, in the SNAC-K) were not significantly associated with diabetes (Table 2).

Over the 9-y follow-up of the KP (5,485 person-years; median per person, 5.5 y; range, 0.03–10.5 y), 358 participants were diagnosed with dementia, including 271 with AD. In fully adjusted Cox regression analysis, diabetes was associated with a more than 60% increased risk of dementia (HR 1.73, 95% CI 1.19–2.32) and AD (HR 1.66, 95% CI 1.06–2.40) after controlling for age, sex, education, baseline MMSE score, BMI, heart disease, stroke, SBP, DBP, APOE ε4, and survival status. Compared to HHEX_23-GG, the AG (HR 0.96, 95% CI 0.74–1.25) and AA (HR 1.05, 95% CI 0.78–1.40) genotypes were not significantly associated with incident dementia. We also found no significant association between IDE_9-TC (HR 1.04, 95% CI 0.83–1.31) or IDE_9-CC (HR 0.68, 95% CI 0.30–1.54) (IDE_9-TT as reference) and dementia.
In the SNAC-K, during the 6-y follow-up (8,371 person-years; median per person, 5.9 y; range, 2.07–7.60 y), 166 people developed dementia, including 121 with AD. Multi-adjusted Cox regression showed results similar to those of the KP regarding the association of diabetes, HHEX_23, and IDE_9 with dementia and AD, adjusted for the confounders listed above. We found no significant association of HHEX_23 and IDE_9 genotypes with dementia and AD in either cohort (Table 3).

Joint Effect of HHEX_23 and Diabetes on Dementia and Alzheimer Disease
The joint effect of diabetes and different genotypes of HHEX_23 on the risk of dementia and AD was examined by creating dummy variables based on the joint exposures, and participants were divided into six groups. In the KP, multi-adjusted Cox regression analysis showed that the AA genotype in combination with diabetes was associated with a substantial risk of dementia (HR 5.54, 95% CI 2.40–7.18) and AD (HR 4.81, 95% CI 1.88–8.50) compared to the GG genotype without diabetes after controlling for age, sex, education, baseline MMSE score, BMI, heart disease, stroke, SBP, DBP, APOE ε4, and follow-up survival status. In the SNAC-K, the multi-adjusted HRs for dementia (4.87, 95% CI 1.91–5.66) and AD (4.01, 95% CI 1.72–6.37) were much greater among the HHEX–23-AA carriers with diabetes than among the HHEX_23-GG carriers without diabetes (Table 4).

In the KP, the HR for the statistical interaction between HHEX_23-AA and diabetes was 4.79 (95% CI 1.63–8.90, p = 0.013) for dementia and 3.55 (95% CI 1.45–9.91, p = 0.025) for AD after adjustment for age, sex, education, baseline MMSE score, follow-up survival status, BMI, heart disease, stroke, SBP, DBP, and APOE ε4. In SNAC-K, the multi-adjusted HR for the interaction was 4.06 (95% CI 1.06–7.58, p = 0.039) for dementia and 3.29 (95% CI 1.02–8.33, p = 0.044) for AD. These results suggest that HHEX_23 may interact with diabetes to be greatly associated with the risk of dementia and AD.
In pooled data analysis, including data from both the KP and the SNAC-K, the adjusted HR of HHEX_23-AA in combination with diabetes was 5.01 (95% CI 1.93–5.86) for dementia and 4.46 (95% CI 1.79–5.28) for AD compared to the GG genotype without diabetes. The multi-adjusted HR for the interaction between the AA genotype and diabetes on dementia and AD was 4.01 (95% CI 1.24–6.67, p = 0.009) for dementia and 3.32 (95% CI 1.21–7.26, p = 0.012) for AD.
There were no statistically significant interactions between the HHEX_23-AA genotype and APOE ε4 on dementia. In the KP, the HR for the interaction was 1.40 (95% CI 0.82–2.41) for dementia and 1.64 (95% CI 0.88–3.20) for AD after adjustment for age, sex, education, baseline MMSE score, follow-up survival status, BMI, heart disease, stroke, SBP, and DBP. Similar results on the interactions were also shown from the SNAC-K. We found no joint effects of IDE_9 and diabetes on dementia and AD (S1 Table).
Kaplan–Meier survival analysis showed that the median time from baseline to dementia occurrence in the KP was 1.83 y (95% CI 1.44–4.24) among HHEX_23-AA carriers with diabetes and 5.01 y (95% CI 4.15–7.92) in HHEX_23-GG carriers without diabetes. Thus, HHEX_23-AA and diabetes accelerated dementia onset by an average of 3.18 y (Fig 1).

HHEX_23-AA and Diabetes in Relation to Structural Brain Changes
The characteristics of the MRI study population were generally similar, except education and diabetes (S2 Table), among participants with different HHEX_23 genotypes. Participants carrying HHEX_23-AA with diabetes had smaller adjusted GMV, WMV, and hippocampal volume, but greater CSF volume, WMH, and lateral ventricular volume, than those without these conditions (Fig 2). In linear regression analysis, HHEX_23-AA in combination with diabetes was significantly related to lower GMV (β = −34.25, p = 0.014), WMV (β = −33.24, p = 0.001), and hippocampal volume (β = −0.51, p = 0.003), but greater CSF volume (β = 67.49, p < 0.001), WMH (β = 9.46, p = 0.002), and lateral ventricular volume (β = 0.31, p = 0.012) compared to the GG genotype without diabetes (Table 5). The interaction between the AA genotype and diabetes on WMV (β = −22.80, 95% CI −37.11 to −8.49, p = 0.008) and CSF volume (β = 23.85, 95% CI 4.85–42.85, p = 0.014) remained statistically significant. These structural neuroimaging data on dementia-free people provide further support for our observational findings. We found no statistically significant association between these brain structural changes and diabetes by IDE_9 (S3 Table).


Compared to the remaining SNAC-K sample (n = 1,722), the MRI sample was younger (mean ± standard deviation: 71.1 ± 9.1 versus 75.5 ± 11.4 y, p < 0.001), included more men (41.4% versus 35.0%, p = 0.003), and received more years of education (mean ± standard deviation: 12.6 ± 4.1 versus 11.7 ± 4.0 y, p < 0.001).
Supplementary Analyses
Similar results were obtained when Cox regression analyses were repeated using age as the time scale, when diabetes and prediabetes were treated as separate exposures, when diabetes was treated as a time-dependent variable considering incident diabetes at follow-up time points, and when the analyses were repeated among participants who survived until the time when dementia status was determined (n = 170, including 136 with dementia and 115 with AD). As diabetes was significantly associated with an elevated mortality (HR 1.48, 95% CI 1.06–2.06), the analysis was repeated using competing risk regression where competing death was taken into account, which produced results that were very similar to those from the initial analysis. A sensitivity analysis using multiple imputed data showed results similar to those from the initial analysis. As the KP population was aged ≥75 y, we repeated the analysis among only the participants aged ≥75 y in the SNAC-K, which produced results that were similar to those from the whole population. We also repeated the analysis on the IDE_9–diabetes association after excluding prediabetes, and the association remained non-significant (S4 Table). Finally, similar analyses for the role of rs2251101 (IDE_7), rs12783634, and rs1999763 in the diabetes–dementia association were performed, and no statistically significant results were obtained.
Discussion
In this population-based study consisting of two cohorts of older adults and a subsample with MRI, we found that the HHEX_23-AA genotype interacts with diabetes to substantially increase the risk of dementia and AD by more than four times. Further, we found that people with diabetes carrying the AA genotype had significantly smaller hippocampal and gray and white matter volumes, along with greater lateral ventricular volume and WMH, than those without these conditions. We found no joint effect of IDE_9 and diabetes on dementia and AD. Our findings suggest that a genetic variant in HHEX_23 may play an important role in the development of dementia and AD among people with diabetes.
The main strengths of our study are the population-based cohort, the long-term prospective study design, and the assessment of diabetes at baseline and each follow-up examination. In addition, the replication cohort population was located in the same area as the initial cohort, and had MRI data available. However, some limitations should be noted. First, we used random blood glucose to define diabetes and prediabetes at baseline. As the receiver operating curve is 0.75 (0.49–0.80) for detecting undiagnosed diabetes using random blood glucose [16], impaired glucose tolerance might have been misclassified as non-diabetes and non-prediabetes, which would bias the results of our overall and subgroup analyses toward the null hypothesis. Second, we were unable to assess whether the joint effect of diabetes and IDE/HHEX genes on dementia is mediated by insulin resistance, because data on plasma insulin levels were not available in our study. Third, diabetes and dementia are both associated with elevated mortality [16], which may lead to an underestimation of the strength of the diabetes–dementia or diabetes–AD association because of selective survival. However, similar results were obtained when we used competing risk regression to analyze the association. Fourth, compared to genome-wide association studies, the number of genes examined in this study was very small. However, these genes were selected based on previous studies using the Swedish population. Focusing on the targeted genes allowed us to have more possibilities and spaces to systematically verify our hypothesis in two cohorts and an MRI study. Fifth, both the KP and the SNAC-K are prospective studies of community-based cohorts that included older adults living in a geographically defined central area in Stockholm. The dropout rate in the screening phase was 23.6% in the KP and 26.7% in the SNAC-K, mainly because of death, refusal, or moving from the area [21,23]. In fact, after excluding those who died, the rate of participation in each phase was quite high, varying between 85% and 94%. Compared to those who participated in the screening phase, the dropouts due to death were older and more likely to be men. However, individuals who refused to participate or who moved did not differ from participants in terms of major demographic features [39,40]. A sensitivity analysis using imputed data showed results similar to those from the initial analysis. Thus, we believe the two study populations could be representative of the local general populations at the time the studies started. As the allelic frequencies of the genes examined did not differ from their expected frequencies and were comparable to those in other populations, the major findings from this study may be generalized to populations aged ≥60 y in Western societies with characteristics similar to those in the Kungsholmen population. However, caution is needed when generalizing our findings to younger or rural populations. Finally, it could be considered a limitation that the diagnoses of dementia were made on a clinical basis. However, the clinical assessment for dementia was comprehensive and validated [31]. Moreover, the results from the MRI data in this study provided further support for our findings even among dementia-free individuals.
IDE is a large zinc-binding protease of the M16A metalloprotease subfamily known to cleave multiple short polypeptides. IDE is ubiquitously expressed, with its highest expression in the liver, testes, muscle, and brain [7]. HHEX_23 is a protein-coding gene. This gene encodes a member of the homeobox family of transcription factors, many of which are involved in developmental processes. DNA polymorphisms in IDE/HHEX genes contribute to variation in plasma insulin levels, which is important for the maintenance of insulin concentrations [41]. Variations in HHEX_23 may affect IDE expression through a primary effect upon IDE mRNA levels [10]. It has been suggested that the expression of IDE can be affected by aging, and its activity is significantly decreased with age [42]. However, the effect of the HHEX_23 alleles on IDE expression is unclear.
In a recent meta-analysis including 11 studies comprising 5,771 cases and controls, a non-significant association between HHEX_23 and AD was shown [43]. In the current study, we did not find a significant association between HHEX_23 genotype and the development of dementia and AD among all participants, but we did find an association among people with diabetes. These results may explain the discrepancies in the association between HHEX_23 and AD in previous studies that did not take diabetes into account.
IDE genes have shown suggestive linkage with type 2 diabetes in a number of linkage studies [12], and the IDE/HHEX genomic region has been associated with type 2 diabetes in genome-wide association studies [44–46]. The relation of HHEX_23 and IDE_9 with type 2 diabetes has been reported in several studies [13,47,48], but there are some negative findings [44,49,50]. A study of Swedish men showed a significant association of HHEX_23, but not IDE_9, with diabetes [51]. A large-scale gene-centric meta-analysis across 39 studies for identification of type 2 diabetes loci also failed to identify rs1887922 as being associated with diabetes [52]. In our study, we observed that, compared with the HHEX_23-GG genotype, the AA genotype was associated with diabetes and prediabetes, but we did not find a significant association between IDE_9 and diabetes. Possible explanations for the mixed findings between studies may be age differences between study populations. The age of our study population is much older than that in other studies (mean age of 78 versus 35–65 y) [13,47–50]. As diabetes is associated with mortality, the proportion of individuals with a severe form of diabetes (this could be more related to IDE_9) might be less than that in other studies because of selective survival. Another explanation could be differences in study design and diabetes assessment (such as inclusion of prediabetes). We repeated the analysis after excluding prediabetes, and the IDE_9–diabetes association remained non-significant (S4 Table). Thus, further research is needed to clarify the association between IDE_9 and diabetes.
As IDE demonstrates an ability to degrade insulin, amylin, and Aβ, it has been suggested that IDE is a candidate gene for both type 2 diabetes and AD [7]. Thus, this gene may explain risk for both AD and diabetes, and perhaps even the reciprocal risk between the two disorders. Animal studies have revealed that dysfunctional IDE protease causes diabetic and neuro-pathologic changes in Goto-Kakizaki rats [53,54]. However, no studies to our knowledge have examined the possible relationship between the variations of coding sequences of the IDE/HHEX genes and the two diseases, type 2 diabetes and AD, in humans. In the present study, we found that the HHEX_23-AA genotype may substantially increase the risk of dementia and AD among elderly individuals with diabetes. Our findings suggest that diabetes-related AD might occur mainly among HHEX_23-AA carriers.
To further support our observations, MRI data showed that among dementia-free people, HHEX_23-AA together with diabetes was associated with significantly lower regional brain volumes and greater WMH, which are the early brain changes related to dementia and AD before disease onset, compared to non-diabetic participants with the GG genotype. We found that diabetes interacts with the AA genotype to be related to more reduction of WMV and increase of CSF volume. The explanation for our main findings could be that not only may dementia and diabetes compound each other’s pathologies, but they may interact on the same molecular pathways [55]. It would be very interesting to carry out experiments based on AD tissue expression data to further confirm our findings. However, there are some challenges in assessing IDE gene expression. First, the molecular basis of functional polymorphism in IDE remains incompletely resolved, though limited data have shown that variable mRNA expression is important [10]. Second, deciphering the character of functional polymorphism in the IDE region is a daunting task when allelic heterogeneity is present. Third, RNA-seq studies produce large and complex datasets, and data analysis is further challenged by technical issues. Finally, protocol-specific bias may under - or overrepresent specific loci, leading to biased results; thus, careful data quality control and normalization are necessary [56].
In summary, our study provides the first evidence, to our knowledge, that IDE/HHEX genes—including polymorphisms in HHEX_23, but not IDE_9—play an important role in the association between diabetes, dementia, and structural brain changes. Our results support the hypothesis that variations within the IDE/HHEX gene region may underlie such an association. Our findings highlight the need to control diabetes in order to prevent dementia and AD, especially among people carrying HHEX_23-AA. Further epidemiological studies and experiments based on AD tissue expression data are warranted to clarify the role of HHEX_23 in the diabetes–dementia association and the mechanisms behind the given association.
Supporting Information
Zdroje
1. Biessels GJ, Staekenborg S, Brunner E, Brayne C, Scheltens P (2006) Risk of dementia in diabetes mellitus: a systematic review. Lancet Neurol 5 : 64–74. doi: 10.1016/S1474-4422(05)70284-2 16361024
2. Cheng G, Huang C, Deng H, Wang H (2012) Diabetes as a risk factor for dementia and mild cognitive impairment: a meta-analysis of longitudinal studies. Intern Med J 42 : 484–491. doi: 10.1111/j.1445-5994.2012.02758.x 22372522
3. Lu FP, Lin KP, Kuo HK (2009) Diabetes and the risk of multi-system aging phenotypes: a systematic review and meta-analysis. PLoS ONE 4: e4144. doi: 10.1371/journal.pone.0004144 19127292
4. Xu W, Qiu C, Winblad B, Fratiglioni L (2007) The effect of borderline diabetes on the risk of dementia and Alzheimer’s disease. Diabetes 56 : 211–216. doi: 10.2337/db06-0879 17192484
5. Yaffe K, Blackwell T, Kanaya AM, Davidowitz N, Barrett-Connor E, et al. (2004) Diabetes, impaired fasting glucose, and development of cognitive impairment in older women. Neurology 63 : 658–663. doi: 10.1212/01.WNL.0000134666.64593.BA 15326238
6. Biessels GJ, Kappelle LJ (2005) Increased risk of Alzheimer’s disease in type II diabetes: insulin resistance of the brain or insulin-induced amyloid pathology? Biochem Soc Trans 33 : 1041–1044. doi: 10.1042/BST20051041 16246041
7. Qiu WQ, Folstein MF (2006) Insulin, insulin-degrading enzyme and amyloid-beta peptide in Alzheimer’s disease: review and hypothesis. Neurobiol Aging 27 : 190–198. doi: 10.1016/j.neurobiolaging.2005.01.004 16399206
8. Kuo WL, Gehm BD, Rosner MR, Li W, Keller G (1994) Inducible expression and cellular localization of insulin-degrading enzyme in a stably transfected cell line. J Biol Chem 269 : 22599–22606. 8077210
9. Williama FG, Johnson DE, Bauer GE (1990) [125I]-insulin metabolism by the rat liver in vivo: evidence that a neutral thiol-protease mediates rapid intracellular insulin degradation. Metabolism 39 : 231–241. doi: 10.1016/0026-0495(90)90041-A 2407925
10. Hong MG, Reynolds C, Gatz M, Johansson B, Palmer JC, et al. (2008) Evidence that the gene encoding insulin degrading enzyme influences human lifespan. Hum Mol Genet 17 : 2370–2378. doi: 10.1093/hmg/ddn137 18448515
11. Prince JA, Feuk L, Gu HF, Johansson B, Gatz M, et al. (2003) Genetic variation in a haplotype block spanning IDE influences Alzheimer disease. Hum Mutat 22 : 363–371. doi: 10.1002/humu.10282 14517947
12. Rudovich N, Pivovarova O, Fisher E, Fischer-Rosinsky A, Spranger J, et al. (2009) Polymorphisms within insulin-degrading enzyme (IDE) gene determine insulin metabolism and risk of type 2 diabetes. J Mol Med (Berl) 87 : 1145–1151. doi: 10.1007/s00109-009-0540-6
13. Karamohamed S, Demissie S, Volcjak J, Liu C, Heard-Costa N, et al. (2003) Polymorphisms in the insulin-degrading enzyme gene are associated with type 2 diabetes in men from the NHLBI Framingham Heart Study. Diabetes 52 : 1562–1567. doi: 10.2337/diabetes.52.6.1562 12765971
14. Sato N, Ueki A, Ueno H, Shinjo H, Morita Y (2008) IDE gene polymorphism influences on BPSD in mild dementia of Alzheimer’s type. Curr Gerontol Geriatr Res 2008 : 858759. doi: 10.1155/2008/858759
15. Xu WL, Qiu CX, Wahlin A, Winblad B, Fratiglioni L (2004) Diabetes mellitus and risk of dementia in the Kungsholmen project: a 6-year follow-up study. Neurology 63 : 1181–1186. doi: 10.1212/01.WNL.0000140291.86406.D1 15477535
16. Xu WL, von Strauss E, Qiu CX, Winblad B, Fratiglioni L (2009) Uncontrolled diabetes increases the risk of Alzheimer’s disease: a population-based cohort study. Diabetologia 52 : 1031–1039. doi: 10.1007/s00125-009-1323-x 19280172
17. Xu WL, Caracciolo B, Wang HX, Winblad B, Backman L, et al. (2010) Accelerated progression from mild cognitive impairment to dementia in people with diabetes. Diabetes 59 : 2928–2935. doi: 10.2337/db10-0539 20713684
18. Xu WL, Qiu C, Gatz M, Pedersen NL, Johansson B, et al. (2009) Mid - and late-life diabetes in relation to the risk of dementia: a population-based twin study. Diabetes 58 : 71–77. doi: 10.2337/db08-0586 18952836
19. Björk BF, Katzov H, Kehoe P, Fratiglioni L, Winblad B, et al. (2007) Positive association between risk for late-onset Alzheimer disease and genetic variation in IDE. Neurobiol Aging 28 : 1374–1380. doi: 10.1016/j.neurobiolaging.2006.06.017 16876916
20. Alzforum. AlzGene—polymorphism details. Available: http://www.alzgene.org/polydetail.asp?geneID=124&studyID=511ðnicDataID=715. Accessed 10 June 2015.
21. Fratiglioni L, Viitanen M, Backman L, Sandman PO, Winblad B (1992) Occurrence of dementia in advanced age: the study design of the Kungsholmen Project. Neuroepidemiology 11 (Suppl 1): 29–36. 1603245
22. American Psychiatric Association (1987) Diagnostic and statistical manual of mental disorders, third edition–revised (DSM-III-R). Washington (District of Columbia): American Psychiatric Association.
23. Lagergren M, Fratiglioni L, Hallberg IR, Berglund J, Elmstahl S, et al. (2004) A longitudinal study integrating population, care and social services data. The Swedish National study on Aging and Care (SNAC). Aging Clin Exp Res 16 : 158–168. 15195992
24. Qiu C, Backman L, Winblad B, Aguero-Torres H, Fratiglioni L (2001) The influence of education on clinically diagnosed dementia incidence and mortality data from the Kungsholmen Project. Arch Neurol 58 : 2034–2039. doi: 10.1001/archneur.58.12.2034 11735777
25. Qiu CX, Winblad B, Marengoni A, Klarin I, Fastbom J, et al. (2006) Heart failure and risk of dementia and Alzheimer disease: a population-based cohort study. Arch Intern Med 166 : 1003–1008. doi: 10.1001/archinte.166.9.1003 16682574
26. Nordic Council on Medicines (1985) Guidelines for ATC classification. NLN publication no. 16. Uppsala (Sweden): Nordic Council on Medicines.
27. Goodall I (2005) HbA1c standardisation destination—global IFCC standardisation. How, why, where and when—a tortuous pathway from kit manufacturers, via inter-laboratory lyophilized and whole blood comparisons to designated national comparison schemes. Clin Biochem Rev 26 : 5–19. 16278773
28. World Health Organization (1999) Definition, diabetes and classification of diabetes mellitus and its complications. Geneva: World Health Organization.
29. American Diabetes Association (2010) Diagnosis and classification of diabetes mellitus. Diabetes Care 33: S62–S69. doi: 10.2337/dc10-S062 20042775
30. Mueller JC, Riemenschneider M, Schoepfer-Wendels A, Gohlke H, Konta L, et al. (2007) Weak independent association signals between IDE polymorphisms, Alzheimer’s disease and cognitive measures. Neurobiol Aging 28 : 727–734. doi: 10.1016/j.neurobiolaging.2006.03.009 16675064
31. Fratiglioni L, Grut M, Forsell Y, Viitanen M, Winblad B (1992) Clinical diagnosis of Alzheimer’s disease and other dementias in a population survey. Agreement and causes of disagreement in applying Diagnostic and Statistical Manual of Mental Disorders, Revised Third Edition, criteria. Arch Neurol 49 : 927–932. doi: 10.1001/archneur.1992.00530330049015 1520083
32. McKhann G, Drachman D, Folstein M, Katzman R, Price D, et al. (1984) Clinical diagnosis of Alzheimer’s disease: report of the NINCDS-ADRDA Work Group under the auspices of Department of Health and Human Services Task Force on Alzheimer’s Disease. Neurology 34 : 939–944. 6610841
33. Wang R, Fratiglioni L, Laveskog A, Kalpouzos G, Ehrenkrona CH, et al. (2014) Do cardiovascular risk factors explain the link between white matter hyperintensities and brain volumes in old age? A population-based study. Eur J Neurol 21 : 1076–1082. doi: 10.1111/ene.12319 24313901
34. Ashburner J, Friston KJ (2005) Unified segmentation. Neuroimage 26 : 839–851. doi: 10.1016/j.neuroimage.2005.02.018 15955494
35. Zhang Y, Qiu C, Lindberg O, Bronge L, Aspelin O, et al. (2010) Acceleration of hippocampal atrophy in a non-demented elderly population: the SNAC-K study. Int Psychogeriatr 22 : 14–25. doi: 10.1017/S1041610209991396 19958567
36. Raz N, Lindenberger U, Rodrigue KM, Kennedy KM, Head D, et al. (2005) Regional brain changes in aging healthy adults: general trends, individual differences and modifiers. Cereb Cortex 15 : 1676–1689. doi: 10.1093/cercor/bhi044 15703252
37. Andersson DK, Svardsudd K, Tibblin G (1991) Prevalence and incidence of diabetes in a Swedish community 1972–1987. Diabet Med 8 : 428–434. 1830526
38. Jansson SP, Andersson DK, Svardsudd K (2007) Prevalence and incidence rate of diabetes mellitus in a Swedish community during 30 years of follow-up. Diabetologia 50 : 703–710. doi: 10.1007/s00125-007-0593-4 17268796
39. Xu WL (2008) Diabetes mellitus and the risk of dementia: a population-based study [PhD dissertation]. Stockholm (Sweden): Karolinska Institutet. Available: http://diss.kib.ki.se/2008/978-91-7357-516-4/. Accessed 10 June 2015.
40. Rydwik E, Welmer AK, Kareholt I, Angleman S, Fratiglioni L, et al. (2013) Adherence to physical exercise recommendations in people over 65—the SNAC-Kungsholmen study. Eur J Public Health 23 : 799–804. doi: 10.1093/eurpub/cks150 23115329
41. Marlowe L, Peila R, Benke KS, Hardy J, White LR, et al. (2006) Insulin-degrading enzyme haplotypes affect insulin levels but not dementia risk. Neurodegener Dis 3 : 320–326. doi: 10.1159/000097300 17192720
42. Runyan K, Duckworth WC, Kitabchi AE, Huff G (1979) The effect of age on insulin-degrading activity in rat tissue. Diabetes 28 : 324–325. doi: 10.2337/diab.28.4.324 437372
43. Cheng H, Wang L, Shi T, Shang Y, Jiang L (2014) Association of insulin degrading enzyme gene polymorphisms with Alzheimer’s disease: a meta-analysis. Int J Neurosci. E-pub ahead of print. doi: 10.3109/00207454.2014.941440
44. Sladek R, Rocheleau G, Rung J, Dina C, Shen L, et al. (2007) A genome-wide association study identifies novel risk loci for type 2 diabetes. Nature 445 : 881–885. doi: 10.1038/nature05616 17293876
45. Scott LJ, Mohlke KL, Bonnycastle LL, Willer CJ, Li Y, et al. (2007) A genome-wide association study of type 2 diabetes in Finns detects multiple susceptibility variants. Science 316 : 1341–1345. doi: 10.1126/science.1142382 17463248
46. Zeggini E, Weedon MN, Lindgren CM, Frayling TM, Elliott KS, et al. (2007) Replication of genome-wide association signals in UK samples reveals risk loci for type 2 diabetes. Science 316 : 1336–1341. doi: 10.1126/science.1142364 17463249
47. Ali S, Chopra R, Manvati S, Singh YP, Kaul N, et al. (2013) Replication of type 2 diabetes candidate genes variations in three geographically unrelated Indian population groups. PLoS ONE 8: e58881. doi: 10.1371/journal.pone.0058881 23527042
48. Gu HF, Efendic S, Nordman S, Ostenson CG, Brismar K, et al. (2004) Quantitative trait loci near the insulin-degrading enzyme (IDE) gene contribute to variation in plasma insulin levels. Diabetes 53 : 2137–2142. doi: 10.2337/diabetes.53.8.2137 15277398
49. Florez JC, Wiltshire S, Agapakis CM, Burtt NP, de Bakker PI, et al. (2006) High-density haplotype structure and association testing of the insulin-degrading enzyme (IDE) gene with type 2 diabetes in 4,206 people. Diabetes 55 : 128–135. doi: 10.2337/diabetes.55.01.06.db05-0954 16380485
50. Bartl J, Scholz CJ, Hinterberger M, Jungwirth S, Wichart I, et al. (2011) Disorder-specific effects of polymorphisms at opposing ends of the Insulin Degrading Enzyme gene. BMC Med Genet 12 : 151. doi: 10.1186/1471-2350-12-151 22107728
51. Nordman S, Ostenson CG, Efendic S, Gu HF (2009) Loci of TCF7L2, HHEX and IDE on chromosome 10q and the susceptibility of their genetic polymorphisms to type 2 diabetes. Exp Clin Endocrinol Diabetes 117 : 186–190. doi: 10.1055/s-0028-1100419 19053027
52. Saxena R, Elbers CC, Guo Y, Peter I, Gaunt TR, et al. (2012) Large-scale gene-centric meta-analysis across 39 studies identifies type 2 diabetes loci. Am J Hum Genet 90 : 410–425. doi: 10.1016/j.ajhg.2011.12.022 22325160
53. Fakhrai-Rad H, Nikoshkov A, Kamel A, Fernstrom M, Zierath JR, et al. (2000) Insulin-degrading enzyme identified as a candidate diabetes susceptibility gene in GK rats. Hum Mol Genet 9 : 2149–2158. doi: 10.1093/hmg/9.14.2149 10958757
54. Farris W, Mansourian S, Leissring MA, Eckma EA, Bertram L, et al. (2004) Partial loss-of-function mutations in insulin-degrading enzyme that induce diabetes also impair degradation of amyloid beta-protein. Am J Pathol 164 : 1425–1434. doi: 10.1016/S0002-9440(10)63229-4 15039230
55. Zhao WQ, Townsend M (2009) Insulin resistance and amyloidogenesis as common molecular foundation for type 2 diabetes and Alzheimer’s disease. Biochim Biophys Acta 1792 : 482–496. doi: 10.1016/j.bbadis.2008.10.014 19026743
56. Finotello F, Di Camillo B (2015) Measuring differential gene expression with RNA-seq: challenges and strategies for data analysis. Brief Funct Genomics 14 : 130–142. doi: 10.1093/bfgp/elu035 25240000
Štítky
Interní lékařstvíČlánek vyšel v časopise
PLOS Medicine
2015 Číslo 7
- Alternativní léčebné možnosti u hypercholesterolemie při intoleranci statinů
- Vliv kombinace nutraceutik na remodelaci levé komory srdeční u osob s metabolickým syndromem
- Nutraceutika a jejich ovlivnění mírného kardiometabolického rizika
- Princip účinku medu v léčbě chronických i infikovaných ran
- Superoxidovaný roztok a jeho využití v léčbě ran
Nejčtenější v tomto čísle
- Ebola Virus Disease: Experience and Decision Making for the First Patients outside of Africa
- Searching for Public Health Law’s Sweet Spot: The Regulation of Sugar-Sweetened Beverages
- Glitazone Treatment and Incidence of Parkinson’s Disease among People with Diabetes: A Retrospective Cohort Study
- Individual Participant Data (IPD) Meta-analyses of Randomised Controlled Trials: Guidance on Their Use