
Microenvironmental Heterogeneity Parallels Breast Cancer Progression: A Histology–Genomic Integration Analysis
A novel approach that maps tumor microenvironment heterogeneity and couples this with genetic information to provide superior prognosis in breast cancer.
Published in the journal:
. PLoS Med 13(2): e32767. doi:10.1371/journal.pmed.1001961
Category:
Research Article
doi:
https://doi.org/10.1371/journal.pmed.1001961
Summary
A novel approach that maps tumor microenvironment heterogeneity and couples this with genetic information to provide superior prognosis in breast cancer.
Introduction
Accumulating evidence suggests that the interactions of cancer cells and stromal cells within their microenvironment govern disease progression, metastasis, and, ultimately, the evolution of therapeutic resistance [1–3]. Recent reports have highlighted the significance of the contribution of stromal gene expression and morphological structure as powerful prognostic determinants for a number of tumor types, emphasizing the importance of the tumor microenvironment in disease-related outcomes [4–7]. In breast cancer, a number of studies have demonstrated the prognostic correlation of individual cell types, including the immune cell infiltrate that predicts response to therapy [8–10], and the high percentage of tumor stroma that predicts poor prognosis in triple-negative disease but good prognosis in estrogen receptor (ER)–positive disease [11,12]. Nevertheless, different types of cells coexist with varying degrees of heterogeneity within a tumor. This fundamental feature of human tumors and the combinatorial effects of cell types have been largely ignored, and the collective implications for clinical outcome remain elusive.
Consistent observations from mathematical models have highlighted that tumors with diverse microenvironments show growth patterns dramatically different from those of tumors with homogeneous environments [13] and are more likely to be associated with aggressive cancer phenotypes [2] that select for cell migration and eventual metastasis by allowing cancer cells to evolve more rapidly [14]. These observations highlight the need to understand the collective physiological characteristics and heterogeneity of tumor microenvironments. However, there is a lack of methods to quantify the high spatial variability and diverse cellular composition across different solid tumors. Moreover, the interplay of genomic alterations in cancer cells and microenvironmental heterogeneity and its subsequent role in treatment response have not been explored.
Our aims were (i) to develop a computational system for quantifying microenvironmental heterogeneity based on tumor morphology in routine histological sections, (ii) to define the clinical implications of microenvironmental heterogeneity, and (iii) to integrate this histology-based index with RNA gene expression and DNA copy number profiling data to identify molecular changes associated with microenvironmental heterogeneity.
Methods
Clinical Samples
Hematoxylin and eosin (H&E) sections of 1,992 untreated primary invasive breast carcinomas described in the METABRIC study [15] were quality assessed. These sections are from female patients diagnosed between 1980 and 2005 from consecutive series from five contributing hospitals in the UK and Canada with clinical annotations and matched DNA and RNA profiling data. Of these, H&E samples from two hospitals were highly fragmented, leaving in total 1,026 cases from the remaining three hospitals, which were split into a test set of 510 samples (hospital 1 and 2; Cohort 1) and an independent validation set of 516 samples (hospital 3; Cohort 2) for retrospective analysis (Fig 1A; S1 Table). On average, three sections (top, middle, and bottom) were taken from the single frozen tumor aliquot included in the METABRIC study in order to represent the morphological profile of the tumor [15,16]. Tumor sections were stained independently in different laboratories according to the hospital site. Whole-tumor section images, copy number profiled using Affymetrix SNP6, gene expression profiled using Illumina HT-12 array, and long-term follow-up data (median 68.3 mo) were obtained.

Ethical Approval
All patients gave written consent for the use of material for research purposes. All patient specimens were obtained with appropriate ethical approval from the relevant institutional review boards (Addenbrooke’s Hospital, Cambridge, UK; Guy’s Hospital, London, UK; Nottingham, UK; Vancouver, Canada; Manitoba, Canada).
The Ecosystem Diversity Index
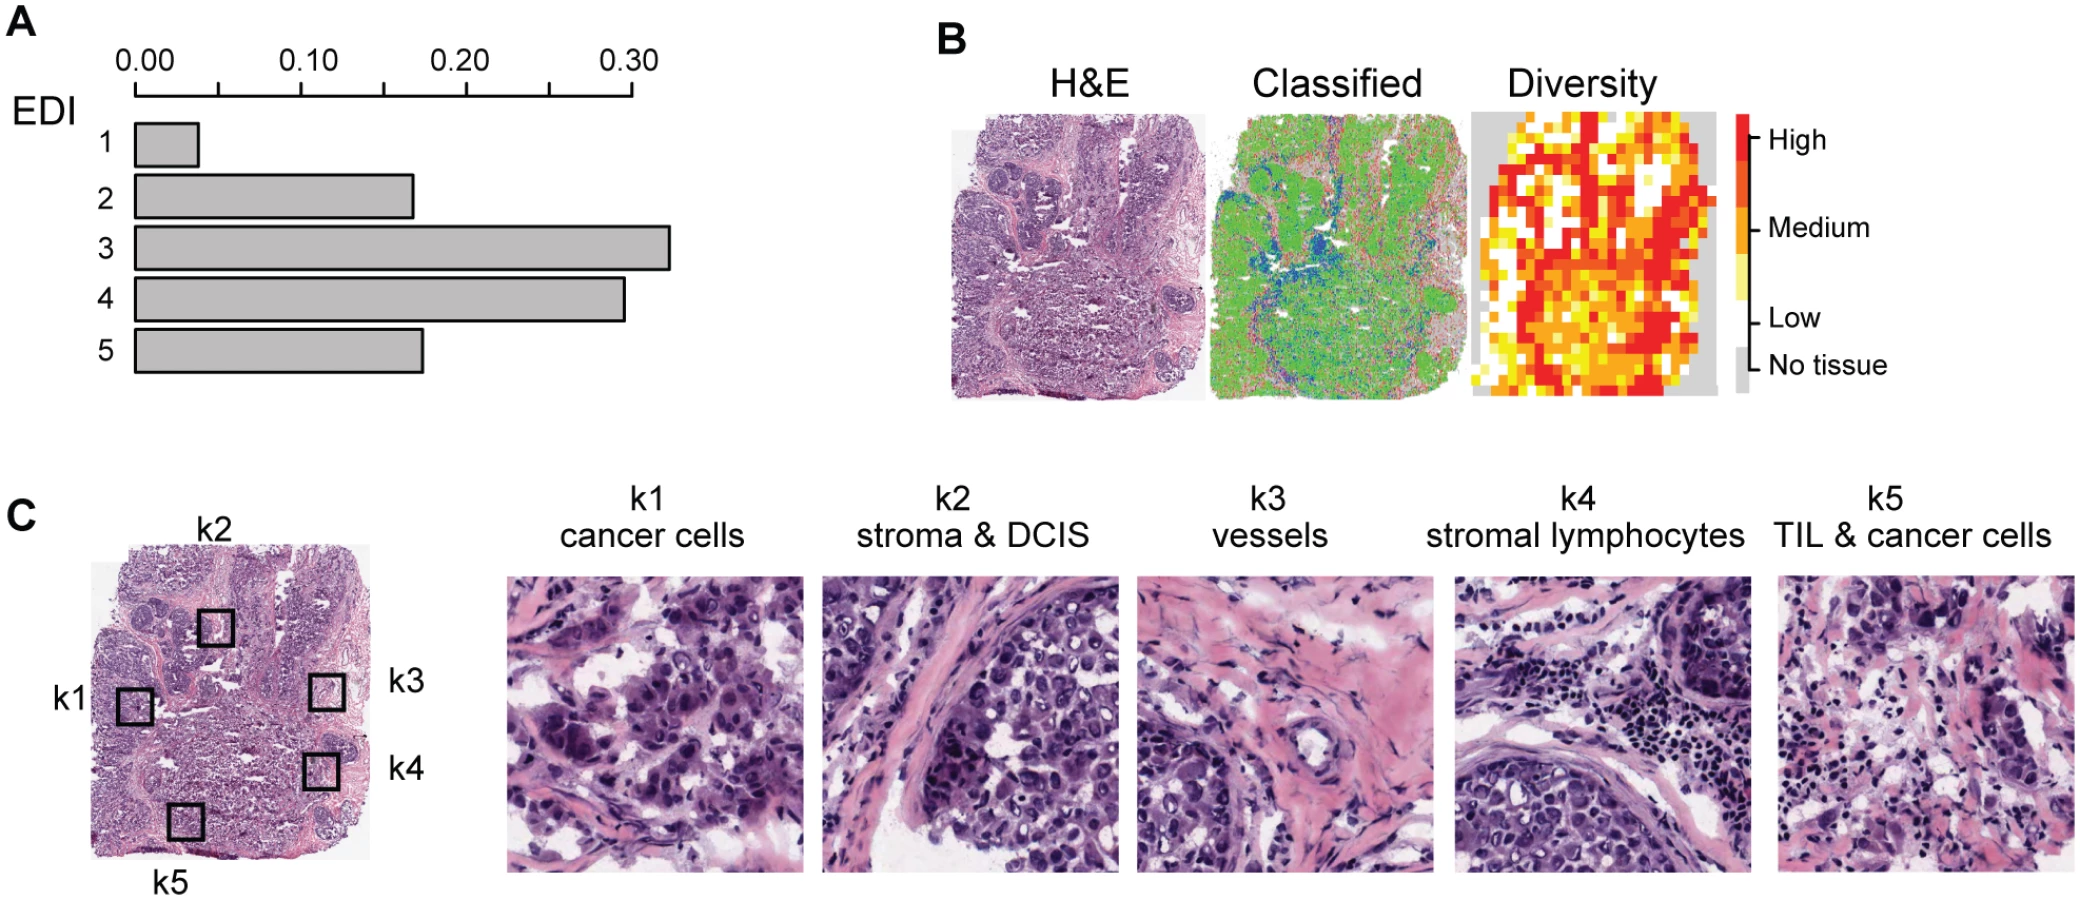
To characterize the tumor ecosystem based on cell compositions, we developed a new index to be used in conjunction with our image analysis tool [16]. First, we used our automated morphological classification method [16] to identify and classify cells into cancer, lymphocyte, or stromal cell classes in H&E sections (Fig 1B). We next divided sections into smaller spatial regions and quantified the diversity of the tumor ecosystem in a tumor region j using the Shannon diversity index:


Statistical Methods and Data Analysis
Survival analysis was performed with breast-cancer-specific 10-y survival data. The Kaplan–Meier estimator was used, and the log-rank test was performed to test differences among groups. For univariate and multivariate analysis, the Cox proportional hazards regression model was fitted, and 95% confidence intervals computed to determine prognostic values; log-rank test p < 0.05 was considered significant. Correlation of EDI with gene expression data was computed with Pearson correlation, and q-values computed using tail-area-based false discovery rate correction for multiple correlation analysis [19]. Test for significant differences among groups of a single variable was carried out using ANOVA or the Kruskal–Wallis test when appropriate. Test for trend was performed using the Jonckheere–Terpstra test. Test for association between categorical variables was carried out using Fisher’s exact test. Genomic instability was calculated as the proportion of copy number aberrations in a genome based on SNP6 data, as previously described [15]. A Sweave file and data are provided for reproducing our results, and our methods are also available as an R package, “EDI” (S1 Data).
Results
Development of a Computational Framework for Quantifying Intra-tumor Microenvironment Heterogeneity
To measure the spatial heterogeneity of the tumor microenvironment, we developed a fully automated computational approach to generate an index termed the ecosystem diversity index (EDI). This builds on our previously developed automated image analysis tool that identifies cancer cells, lymphocytes, and stromal cells including fibroblasts and endothelial cells, based on cell size and shape, in H&E-stained breast tumor sections [16] (Fig 1B). After cell identification, H&E sections are computationally divided into regions to examine the tumor spatial variability with statistical assessment (Methods). The Shannon diversity index [20], which measures species diversity in an ecosystem, was calculated for each dissected tumor region to define a local cellular diversity score, where a high value indicates a diverse ecosystem populated by many cell types and a low value indicates the dominance of a single cell type (Fig 1C and 1D). For each tumor, an EDI score was subsequently computed by examining the global differences in cellular diversity among local regions, using unsupervised Gaussian mixture clustering [21] of the regional diversity indices (Methods; Fig 1E). Application of this EDI measurement to H&E images of 1,026 primary breast tumors from the METABRIC study [15] (Fig 1A; Table 1) resulted in EDI scores ranging from 1 to 5, equating to the degree of tumor spatial heterogeneity for the breast tumors in this cohort, with 5 reflecting the highest degree of heterogeneity (Fig 2A). A low EDI score indicates a relatively homogeneous tumor, whereas a high EDI score suggests that diverse cancer habitats coexist in a tumor, and, hence, the tumor has a high degree of microenvironmental heterogeneity (Fig 2B and 2C). Spatial scale is a crucial parameter for EDI as a measure of spatial heterogeneity and was determined by three analytical experiments based on only histology data (S1 Text; S1 and S2 Figs).

High Intra-tumor Microenvironment Heterogeneity Identifies an Aggressive Subtype of Grade 3 Cancers
To investigate the clinical implications of microenvironmental heterogeneity, we evaluated the prognostic value of EDI subtyping in two independent cohorts of breast cancer patients from the METABRIC study [15] (n = 510 and n = 516). We found that in high-grade (grade 3) breast cancers, tumors with the highest microenvironmental heterogeneity (EDI = 5, referred to subsequently as the EDI-high group, with all remaining tumors in the EDI-low group) had significantly worse disease-specific survival than the remaining patients in the test cohort (grade 3, n = 251, p = 0.0026, hazard ratio [HR] = 2.01, 95% CI 1.26–3.19; Table 2) and validation cohort (grade 3, n = 256, p = 0.025, HR = 2.24, 95% CI 1.08–4.65; Fig 3A). With the two cohorts combined, the EDI-high group accounted for 17.3% (88/507) of grade 3 breast cancers, with a 10-y disease-specific survival probability of 51% compared with 70% for the remaining grade 3 patients (Kaplan–Meier survival estimates; log-rank test of difference in survival, p < 0.001, HR = 2.12, 95% CI 1.44–3.13). Furthermore, the prognostic value of EDI was independent of the number of regions (multivariate survival analysis in grade 3 tumors: EDI, p = 0.004, HR = 1.89; number of regions, p = 0.26, HR = 1.29), and its correlation with prognosis remained statistically stable upon resampling with progressively fewer tumor regions built into the model (100%–80%; Figs 3B and S3), demonstrating the robustness of EDI subtyping. At variance with the results for grade 3 tumors, EDI was not associated with prognosis in low-grade tumors (grade 1 and 2, p = 0.42; S4 Fig). This observation was further validated using the genomic grade index (GGI) inferred from gene expression data [22], where EDI was associated with prognosis only in high-GGI tumors (S5 Fig).


High Intra-tumor Microenvironment Diversity Is Independent of Known Clinicopathological Variables in High-Grade Breast Cancer
We next performed a comprehensive comparison between EDI and know prognostic variables including lymph node status, tumor size, ER, HER2 status, molecular subtypes including PAM50 [23] and IntClust [15], and proportions of cancer, stromal cells, and lymphocytes in the tumors. Of these, only node status, tumor size, and ER status were associated with survival in grade 3 tumors in both cohorts (univariate Cox proportional hazards analysis; Table 2; S6 Fig). Also, when tested against all variables, the EDI-high group was found to be enriched with samples that are large in tumor size (>5 cm), lymph node positive, or ER negative, but not with any PAM50 or IntClust subtypes (p < 0.05, Fisher’s exact test; Figs 3C and S7). Although we found that the Shannon diversity index computed on the whole tumor was correlated with EDI (p < 0.001, Kruskal–Wallis test), it was not independently prognostic given EDI in high-grade tumors (grade 3: Shannon diversity index, p = 0.14, HR = 1.21, 95% CI 0.93–1.57; EDI, p = 0.009, HR = 1.8, 95% CI 1.15–2.80).
Subsequently, multivariate Cox proportional hazards analysis including node status, tumor size, ER status, and EDI demonstrated that EDI was independently prognostic in both cohorts of grade 3 breast cancer (Cohort 1, p = 0.019, HR = 1.74, 95% CI 1.09–2.79; Cohort 2, p = 0.029, HR = 2.27, 95% CI 1.08–4.76; Table 2).
Moreover, the addition of EDI to patient groups defined by tumor size resulted in new subgroups with substantially different disease-specific survival (EDI-high versus EDI-low within size 2: p = 0.004, HR = 1.96, 95% CI 1.22–3.16; size 3: p = 0.03, HR = 2.77, 95% CI 1.03–7.45; Fig 3D). This analysis highlighted a very aggressive tumor type with large tumor size (>5 cm) and high EDI with a 16% 5-y survival probability, whilst the rest of large size tumors have a 50% 5-y survival probability. Similarly for node status and ER status, EDI-high defined a more aggressive group within each subtype (node negative, p = 0.001; node positive, p = 0.017; ER negative, p = 0.008; ER positive, p = 0.017; S8 Fig). Thus, the prognostic value of EDI in high-grade breast cancers was independent of known clinical parameters, and EDI outperformed some well-known molecular prognostic signatures.
High Intra-tumor Microenvironment Diversity and TP53 Mutation Co-define an Aggressive Subset of Grade 3 Breast Cancers
We next asked whether EDI as a measure of microenvironmental heterogeneity correlated with cancer hallmarks that have previously been correlated with cancer progression, mutagenesis, and heterogeneity, including APOBEC3B expression [24], genomic instability [25,26], and TP53 mutation [27,28]. Whilst we observed no significant correlation between EDI and any of these cancer hallmarks in grade 3 tumors or tumors of all grades (p > 0.1, ANOVA or Fisher’s exact test; S9 Fig), TP53 mutation demonstrated a significant correlation with disease-specific survival (p < 0.001, HR = 1.85, 95% CI 1.29–2.65) in grade 3 tumors (Fig 4A). Taken together, EDI-high and TP53 mutation co-defined an aggressive subtype of grade 3 cancers with a 10-y survival probability of 35%. This prognosis is significantly worse than that of the remaining grade 3 patients (Cohort 1, p < 0.001, HR = 2.88, 95% CI 1.66–4.99; Cohort 2, p = 0.001, HR = 4.2, 95% CI 1.65–10.68; Fig 4A for two cohorts combined). Interestingly, disease-specific survival for patients with either high ecosystem diversity or TP53 mutation alone was not different (p = 0.74 combining two cohorts). The prognostic value of three-group stratification (low EDI and TP53 wild-type, high EDI and TP53 mutant, and all others) exceeded all known clinicopathological variables (multivariate analysis: Cohort 1, p < 0.001, HR = 1.47, 95% CI 1.17–1.84; Cohort 2, p = 0.0011, HR = 1.78, 95% CI 1.26–2.52; Table 2). In contrast, when tumors of all grades were considered, cancer hallmark measures were significantly associated with disease-specific survival (S10 Fig) and tumor grade (p < 0.001, Jonckheere–Terpstra test; S11 Fig). Therefore, EDI was independent of known cancer hallmarks and can co-define an aggressive subgroup of high-grade breast cancer together with TP53 mutation (Fig 4B), highlighting the need to study genetic alterations in the context of the heterogeneity of the tumor microenvironment [3,29,30].

High Intra-tumor Microenvironment Diversity Is Associated with Specific Genomic Alterations
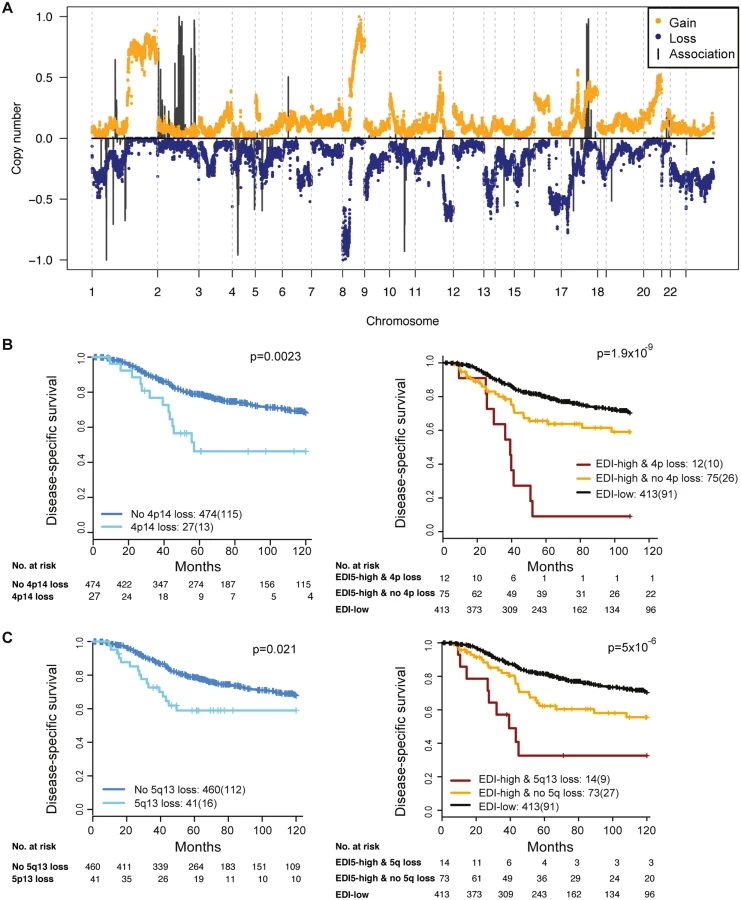
To reveal additional molecular aberrations associated with microenvironmental heterogeneity, we integrated EDI with whole-genome mRNA expression and SNP6 DNA copy number data in grade 3 breast tumors. Whilst there were no differentially expressed genes between EDI-high and EDI-low tumors after multiple test correction, we identified a number of significant correlations of specific copy number alterations with EDI-high tumors (Fig 5A; S2 Table). These included higher frequency of loss of 1p35, 4p14, 5q13, and 10q23 and gains of 2q14 and 17q23. Akin to TP53 mutation, copy number loss of 4p14 and 5q13 was able to substratify EDI-high, grade 3 cancer patients into aggressive subgroups (4p14 loss, n = 12, 9% 5-y survival; 5q13 loss, n = 14, 32% 5-y survival; Fig 5B and 5C). These stratifications were significant in both sample cohorts and independent of lymph node status and tumor size (Cohort 1: EDI + 4p14 loss, p < 0.001, HR = 4.89; EDI + 5q13 loss, p = 0.0033, HR = 3.02; Cohort 2: EDI + 4p14 loss, p = 0.014, HR = 8.13; EDI + 5q13 loss, p < 0.001, HR = 8.56; S3 Table). Application of a sparse regression model to fit EDI with genomic data, however, failed to generate satisfactory results, indicating that EDI cannot be explained based solely on genomic alterations (S1 Text).
Discussion
Tumor histological grade remains one of the most powerful prognostic factors for breast cancer, and high-grade cancers (grade 3) are associated with a poor prognosis, with 10-y overall and relapse-free survival rates of around 40%–60% [31,32]. Development of additional breast cancer biomarkers to guide disease management on clinical diagnosis of this high-risk patient group is of paramount importance for effective patient management. Here we have developed a novel computational system for measuring the spatial heterogeneity of the tumor microenvironment based on high-throughput image analysis of cancer and microenvironmental cells. Our findings show that in the cohorts studied, grade 3 breast tumors that are characterized by high microenvironmental heterogeneity have a significantly worse 10-y disease-free survival rate (51%) than that of other grade 3 tumors (70%). Furthermore, this index is independent of known clinicopathological variables and prognostic molecular subtypes. In fact, a combined index of microenvironment heterogeneity and DNA alteration—namely, TP53 mutation or copy number loss of 4p14 or 5q13—was able to improve the accuracy of prognosis in grade 3 breast cancer patients in our cohorts further, identifying subgroups of patients with disease-specific survival rates of 35%, 9%, and 32%, respectively.
Our unbiased approach thus opens the door to large-scale studies of human tumors and facilitates the integration of microenvironmental measures with cancer genomics. Our index, EDI, measures the variability of tumor composition along the spatial dimensions of a tumor and is therefore different from other methods such as the Shannon diversity index, which only measures tumor composition. Its prognostic value in grade 3 breast tumors was validated using samples stained independently at different laboratories, suggesting that the variability of H&E staining has limited impact on the prognostic associations of EDI. Diversification of the tumor ecosystem may become a new type of prognostic biomarker, in addition to cell abundance scores such as those that build on histological assessment of inflammatory cells and stromal infiltrate [33,34].
EDI as a measure of microenvironmental heterogeneity has superior prognostic value to known clinical parameters, molecular subtyping signatures, and cancer hallmarks measured in surgically resected high-grade tumors in these cohorts. Notably, none of the known cancer hallmarks, such as genomic instability, RNA expression, or genomics, could fully explain the new subtype with high diversification and its effective patient stratification in high-grade tumors. This clinical association was not observed in grade 1 and 2 cancers in the cohorts studied, suggesting that microenvironment heterogeneity may play a role in the temporal progression of high-grade, but not low-grade, breast cancers. On the other hand, TP53 mutation was strongly associated with disease-specific deaths in both low - and high-grade cancers, consistent with a recent finding that driver mutations in TP53 can be early and late events in breast cancer diversification [35]. Furthermore, in high-grade breast cancers, TP53 mutation together with microenvironment heterogeneity co-defined an aggressive cancer with only a 35% 10-y survival probability. It is therefore plausible that whilst loss of TP53 tumor suppressor functions occurs and cancer heterogeneity accumulates as disease progresses, additional microenvironment heterogeneity in advanced cancers aids further selection (Fig 4B). This hypothesis is in agreement with a recent elegant study that highlighted the importance of microenvironmental alterations that are mediated by non-cell-autonomous mechanisms that, together with genomic heterogeneity, drive tumor progression [36]. Whilst these hypotheses remain to be tested, our findings emphasize the importance of including analyses of microenvironmental heterogeneity in studies of cancer diversity.
By integrating our microenvironmental heterogeneity index with genome-wide copy number data, we found that breast cancers with heterogeneous microenvironments were enriched with specific genomic alterations, signifying the clinical implication and synergistic interaction of cancer cells and their surrounding microenvironments. Moreover, copy number loss of 4p14 and 5q13 aided further substratification of EDI-high tumors into poor prognosis subgroups in the cohorts studied. These ecosystem-associated genomic aberrations support the hypothesis of a cooperative relationship between cancer cells and their surrounding microenvironment and indicate that, consistent with mathematical modeling, their interactions may facilitate rapid cancer progression and that spatial heterogeneity of resources selects for metastasis [2,14,37]. Interestingly, we observed no differentially expressed genes between EDI-high and EDI-low tumors in these samples. This may be a consequence of whole-tumor sampling for the gene expression data, such that spatial signals are lost.
This study has a number of limitations. The motivation for our computational development was to use a data-driven model and measure the degree of spatial heterogeneity in tumor pathological specimens. In this model, only three major cell types in breast tumors were considered. Further sub-classification of the different types of stromal and immune cells by immunohistochemistry may add additional discriminatory value to our model. For dissecting spatial heterogeneity, we chose to use square regions with equal sizes. We found that EDI was correlated with the size of the region chosen for calculation of the Shannon diversity index, and as such the spatial heterogeneity is scale dependent. This phenomenon has been well described in a number of studies in ecology that show that a scale needs to be chosen that is appropriate for the ecological process under study [38,39], further highlighting the analogy between tumor studies and ecology. Similar to the recent observation that breast cancer subclonal heterogeneity is correlated with tumor size [35], we also found an association between microenvironmental heterogeneity and tumor size; hence, EDI may have more limited value in smaller tumors. However, small tumors were present in the EDI-high group, and addition of EDI within tumors grouped by size further stratified their prognosis. We found that EDI was prognostic only in grade 3 tumors in our study, which could be a limitation, given the possible discordance in grading between pathologists.
The identification of additional biomarkers in subgroups of patients that identify them as high risk is important for patient management and to avoid overtreatment for low-risk patients. We envision that the use of our measure of microenvironment heterogeneity, together with key genomic alterations, will enable the diagnosis of patients at very high risk of relapse and facilitate the enrollment of these patients into additional clinical trials for novel therapies or treatment intensification. Our novel computational approach provides a fully automated tool that is relatively easy to implement. Integration of this measure with genomic profiling provides additional prognostic information independent of known clinical parameters. The results of this study highlight the possibility of a grade-3-specific prognostic tool that may aid in further classification of high-grade breast cancer patients beyond standard assays such as ER and HER2 status.
Supporting Information
Zdroje
1. Kenny PA, Bissell MJ. Tumor reversion: correction of malignant behavior by microenvironmental cues. Int J Cancer. 2003;107 : 688–695. doi: 10.1002/ijc.11491 14566816
2. Anderson AR, Weaver AM, Cummings PT, Quaranta V. Tumor morphology and phenotypic evolution driven by selective pressure from the microenvironment. Cell. 2006;127 : 905–915. doi: 10.1016/j.cell.2006.09.042 17129778
3. Polyak K, Haviv I, Campbell IG. Co-evolution of tumor cells and their microenvironment. Trends Genet. 2009;25 : 30–38. doi: 10.1016/j.tig.2008.10.012 19054589
4. Calon A, Lonardo E, Berenguer-Llergo A, Espinet E, Hernando-Momblona X, Iglesias M, et al. Stromal gene expression defines poor-prognosis subtypes in colorectal cancer. Nat Genet. 2015;47 : 320–329. doi: 10.1038/ng.3225 25706628
5. Finak G, Bertos N, Pepin F, Sadekova S, Souleimanova M, Zhao H, et al. Stromal gene expression predicts clinical outcome in breast cancer. Nat Med. 2008;14 : 518–527. doi: 10.1038/nm1764 18438415
6. Isella C, Terrasi A, Bellomo SE, Petti C, Galatola G, Muratore A, et al. Stromal contribution to the colorectal cancer transcriptome. Nat Genet. 201547 : 312–319. doi: 10.1038/ng.3224
7. Beck AH, Sangoi AR, Leung S, Marinelli RJ, Nielsen TO, van de Vijver MJ, et al. Systematic analysis of breast cancer morphology uncovers stromal features associated with survival. Sci Transl Med. 2011;3 : 108ra13. doi: 10.1126/scitranslmed.3002564
8. Loi S, Michiels S, Salgado R, Sirtaine N, Jose V, Fumagalli D, et al. Tumor infiltrating lymphocytes are prognostic in triple negative breast cancer and predictive for trastuzumab benefit in early breast cancer: results from the FinHER trial. Ann Oncol. 2014;25 : 1544–1550. doi: 10.1093/annonc/mdu112 24608200
9. Issa-Nummer Y, Darb-Esfahani S, Loibl S, Kunz G, Nekljudova V, Schrader I, et al. Prospective validation of immunological infiltrate for prediction of response to neoadjuvant chemotherapy in HER2-negative breast cancer—a substudy of the neoadjuvant GeparQuinto trial. PLoS ONE. 2013;8:e79775. doi: 10.1371/journal.pone.0079775 24312450
10. Denkert C. Diagnostic and therapeutic implications of tumor-infiltrating lymphocytes in breast cancer. J Clin Oncol. 2013;31 : 836–837. doi: 10.1200/JCO.2012.47.1698 23341523
11. Downey CL, Simpkins SA, White J, Holliday DL, Jones JL, Jordan LB, et al. The prognostic significance of tumour-stroma ratio in oestrogen receptor-positive breast cancer. Br J Cancer. 2014;110 : 1744–1747. doi: 10.1038/bjc.2014.69 24548861
12. Dekker TJ, van de Velde CJ, van Pelt GW, Kroep JR, Julien JP, Smit VT, et al. Prognostic significance of the tumor-stroma ratio: validation study in node-negative premenopausal breast cancer patients from the EORTC perioperative chemotherapy (POP) trial (10854). Breast Cancer Res Treat. 2013;139 : 371–379. doi: 10.1007/s10549-013-2571-5 23709090
13. Jiao Y, Torquato S. Emergent behaviors from a cellular automaton model for invasive tumor growth in heterogeneous microenvironments. PLoS Comput Biol. 2011;7:e1002314. doi: 10.1371/journal.pcbi.1002314 22215996
14. Chen J, Sprouffske K, Huang Q, Maley CC. Solving the puzzle of metastasis: the evolution of cell migration in neoplasms. PLoS ONE. 2011;6:e17933. doi: 10.1371/journal.pone.0017933 21556134
15. Curtis C, Shah SP, Chin SF, Turashvili G, Rueda OM, Dunning MJ, et al. The genomic and transcriptomic architecture of 2,000 breast tumours reveals novel subgroups. Nature. 2012;486 : 346–352. doi: 10.1038/nature10983 22522925
16. Yuan Y, Failmezger H, Rueda OM, Ali HR, Graf S, Chin SF, et al. Quantitative image analysis of cellular heterogeneity in breast tumors complements genomic profiling. Sci Transl Med. 2012;4 : 157ra43. doi: 10.1126/scitranslmed.3004330
17. McPherson GR, DeStephano S. Applied Ecology and natural resource management. Cambridge: Cambridge University Press; 2003.
18. Fraley C, Raftery AE. Model-based clustering, discriminant analysis, and density estimation. J Am Stat Assoc. 2002;97 : 611–631. doi: 10.1198/016214502760047131
19. Strimmer K. A unified approach to false discovery rate estimation. BMC Bioinformatics. 2008;9 : 303. doi: 10.1186/1471-2105-9-303 18613966
20. Shannon CE. The mathematical theory of communication. 1963. MD Comput. 1997;14 : 306–317. 9230594
21. McLachlan G, Peel D. Finite mixture models. New York: Wiley; 2000.
22. Sotiriou C, Wirapati P, Loi S, Harris A, Fox S, Smeds J, et al. Gene expression profiling in breast cancer: understanding the molecular basis of histologic grade to improve prognosis. J Natl Cancer Inst. 2006;98 : 262–272. doi: 10.1093/jnci/djj052 16478745
23. Parker JS, Mullins M, Cheang MC, Leung S, Voduc D, Vickery T, et al. Supervised risk predictor of breast cancer based on intrinsic subtypes. J Clin Oncol. 2009;27 : 1160–1167. doi: 10.1200/JCO.2008.18.1370 19204204
24. Burns MB, Lackey L, Carpenter MA, Rathore A, Land AM, Leonard B, et al. APOBEC3B is an enzymatic source of mutation in breast cancer. Nature. 2013;494 : 366–370. doi: 10.1038/nature11881 23389445
25. Negrini S, Gorgoulis VG, Halazonetis TD. Genomic instability—an evolving hallmark of cancer. Nat Rev Mol Cell Biol. 2010;11 : 220–228. doi: 10.1038/nrm2858 20177397
26. Hanahan D, Weinberg RA. Hallmarks of cancer: the next generation. Cell. 2011;144 : 646–674. doi: 10.1016/j.cell.2011.02.013 21376230
27. Alexandrov LB, Stratton MR. Mutational signatures: the patterns of somatic mutations hidden in cancer genomes. Curr Opin Genet Dev. 2014;24 : 52–60. doi: 10.1016/j.gde.2013.11.014 24657537
28. Hanel W, Moll UM. Links between mutant p53 and genomic instability. J Cell Biochem. 2012;113 : 433–439. doi: 10.1002/jcb.23400 22006292
29. Maley CC, Galipeau PC, Finley JC, Wongsurawat VJ, Li X, Sanchez CA, et al. Genetic clonal diversity predicts progression to esophageal adenocarcinoma. Nat Genet. 2006;38 : 468–473. doi: 10.1038/ng1768 16565718
30. Pienta KJ, McGregor N, Axelrod R, Axelrod DE. Ecological therapy for cancer: defining tumors using an ecosystem paradigm suggests new opportunities for novel cancer treatments. Transl Oncol. 2008;1 : 158–164. 19043526
31. Rakha EA, El-Sayed ME, Lee AH, Elston CW, Grainge MJ, Hodi Z, et al. Prognostic significance of Nottingham histologic grade in invasive breast carcinoma. J Clin Oncol. 2008;26 : 3153–3158. doi: 10.1200/JCO.2007.15.5986 18490649
32. Elston CW, Ellis IO. Pathological prognostic factors in breast cancer. I. The value of histological grade in breast cancer: experience from a large study with long-term follow-up. Histopathology. 1991;19 : 403–410. 1757079
33. Park JH, McMillan DC, Powell AG, Richards CH, Horgan PG, Edwards J, et al. Evaluation of a tumor microenvironment-based prognostic score in primary operable colorectal cancer. Clin Cancer Res. 2015;21 : 882–888. doi: 10.1158/1078-0432.CCR-14-1686 25473000
34. Galon J, Pages F, Marincola FM, Thurin M, Trinchieri G, Fox BA, et al. The immune score as a new possible approach for the classification of cancer. J Transl Med. 2012;10 : 1. doi: 10.1186/1479-5876-10-1 22214470
35. Yates LR, Gerstung M, Knappskog S, Desmedt C, Gundem G, Van Loo P, et al. Subclonal diversification of primary breast cancer revealed by multiregion sequencing. Nat Med. 2015;21 : 751–759. doi: 10.1038/nm.3886 26099045
36. Marusyk A, Tabassum DP, Altrock PM, Almendro V, Michor F, Polyak K. Non-cell-autonomous driving of tumour growth supports sub-clonal heterogeneity. Nature. 2014;514 : 54–58. doi: 10.1038/nature13556 25079331
37. Mazzone M, Dettori D, Leite de Oliveira R, Loges S, Schmidt T, Jonckx B, et al. Heterozygous deficiency of PHD2 restores tumor oxygenation and inhibits metastasis via endothelial normalization. Cell. 2009;136 : 839–851. doi: 10.1016/j.cell.2009.01.020 19217150
38. Gardner RH, Milne BT, Turnei MG, O’Neill RV. Neutral models for the analysis of broad-scale landscape pattern. Landsc Ecol. 1987;1 : 19–28.
39. Turner M, O’Neill R, Gardner R, Milne B. Effects of changing spatial scale on the analysis of landscape pattern. Landsc Ecol. 1989;3 : 153–162. doi: 10.1007/BF00131534
Štítky
Interní lékařstvíČlánek vyšel v časopise
PLOS Medicine
2016 Číslo 2
- Alternativní léčebné možnosti u hypercholesterolemie při intoleranci statinů
- Vliv kombinace nutraceutik na remodelaci levé komory srdeční u osob s metabolickým syndromem
- Nutraceutika a jejich ovlivnění mírného kardiometabolického rizika
- Princip účinku medu v léčbě chronických i infikovaných ran
- Superoxidovaný roztok a jeho využití v léčbě ran
Nejčtenější v tomto čísle
- Hand, Foot, and Mouth Disease in China: Modeling Epidemic Dynamics of Enterovirus Serotypes and Implications for Vaccination
- A Time for Global Action: Addressing Girls’ Menstrual Hygiene Management Needs in Schools
- Transforming Living Kidney Donation with a Comprehensive Strategy
- The Rise of Consumer Health Wearables: Promises and Barriers