
Antigenic Variation in Malaria
Involves a Highly Structured Switching Pattern
Many pathogenic bacteria, fungi, and protozoa achieve chronic infection through
an immune evasion strategy known as antigenic variation. In the human malaria
parasite Plasmodium falciparum, this involves transcriptional
switching among members of the var gene family, causing
parasites with different antigenic and phenotypic characteristics to appear at
different times within a population. Here we use a genome-wide approach to
explore this process in vitro within a set of cloned parasite
populations. Our analyses reveal a non-random, highly structured switch pathway
where an initially dominant transcript switches via a set of
switch-intermediates either to a new dominant transcript, or back to the
original. We show that this specific pathway can arise through an evolutionary
conflict in which the pathogen has to optimise between safeguarding its limited
antigenic repertoire and remaining capable of establishing infections in
non-naïve individuals. Our results thus demonstrate a crucial role for
structured switching during the early phases of infections and provide a
unifying theory of antigenic variation in P. falciparum malaria
as a balanced process of parasite-intrinsic switching and immune-mediated
selection.
Published in the journal:
. PLoS Pathog 7(3): e32767. doi:10.1371/journal.ppat.1001306
Category:
Research Article
doi:
https://doi.org/10.1371/journal.ppat.1001306
Summary
Many pathogenic bacteria, fungi, and protozoa achieve chronic infection through
an immune evasion strategy known as antigenic variation. In the human malaria
parasite Plasmodium falciparum, this involves transcriptional
switching among members of the var gene family, causing
parasites with different antigenic and phenotypic characteristics to appear at
different times within a population. Here we use a genome-wide approach to
explore this process in vitro within a set of cloned parasite
populations. Our analyses reveal a non-random, highly structured switch pathway
where an initially dominant transcript switches via a set of
switch-intermediates either to a new dominant transcript, or back to the
original. We show that this specific pathway can arise through an evolutionary
conflict in which the pathogen has to optimise between safeguarding its limited
antigenic repertoire and remaining capable of establishing infections in
non-naïve individuals. Our results thus demonstrate a crucial role for
structured switching during the early phases of infections and provide a
unifying theory of antigenic variation in P. falciparum malaria
as a balanced process of parasite-intrinsic switching and immune-mediated
selection.
Introduction
During blood-stage of infection with P. falciparum, members of the var gene encoded Erythrocyte Membrane Protein 1 (PfEMP1) family are exposed on the surface of infected red blood cells. Here they act as important virulence factors by mediating adherence to a variety of host cell types, causing sequestration of infected red cells in the deep vasculature [1], [2], [3], [4], [5]. PfEMP1 are also an important target for host protective antibody responses and contribute to the development of acquired immunity [6], [7]. This family of proteins has therefore been the focus of intense interest because of the role that it plays in both pathogenesis and the development of protection against clinical disease.
Mutually exclusive transcriptional switching occurs between individual members of the ∼60 var genes that encode this family. This changes the PfEMP1 presented on the red cell surface [8], [9], [10], resulting in an evasion of the antibody response through a process of antigenic variation [11]. To date, switching is known to be under epigenetic control, with the transcribed gene located at a specific region of euchromatin found at the nuclear periphery, [12], [13]. Silencing of the non-transcribed genes seems to involve elements in the intron and the upstream regulatory region [14] and may require the pairing of two promoters [15], [16]. Confirmation that var genes are expressed in a mutually exclusive manner has been obtained by the demonstration that the placing of a var gene promoter upstream of a selectable marker results in the silencing of the entire var repertoire once the marker is selected for [17], [18]. In addition to the control of the activation/repression of members of the var gene family, a mechanism must also exist whereby a molecular memory of the gene that was active in the previous cycle can be passed on to daughter parasites during cell division. Recent evidence suggests that one component of this memory is the selective modification of histones. Silent genes are characterised by a specific methylation of histone H3, H3K9me3, [19], [20], whereas active var genes are associated with the presence of H3K4me2 and H3K4me3 [20]. It has also been reported that the silencing of telomeric members of the var gene family is accompanied by the spreading of heterochromatin involving histone hypoacetylation and PfSIR2 [21].
While our knowledge of some of the molecular mechanisms involved in the control of var gene expression is accumulating rapidly, we still have very little understanding of how these processes are coordinated at the whole cell and population level in a way which provides the parasite with maximum potential to evade the immune response. We have previously proposed that structuring of parasite populations such that individual variants are only expressed one at a time might be achieved by short-lived cross-reacting antibody responses against epitopes shared between subsets of individual variants [22]. However, early infection kinetics will not be affected by these adaptive immune responses and some additional, intrinsic control might therefore be require at this stage.
Previous experiments in our laboratory have suggested that the rate at which individual var genes become transcriptionally activated or silenced are characteristic of that gene and relatively stable over time [23]. Recently, Frank and colleagues [24] have suggested that var genes that are within internal chromosome clusters have intrinsically slow off-rates whilst those in the sub-telomeres have rapid off-rates. Thus, they observe that central var genes tend to be the most predominantly expressed in parasites that are cultured for an extended period.
To investigate further the overall control of var gene expression we have derived a number of parasite clones from both the IT and 3D7 lineages and monitored var gene expression over an extended period of in vitro culture. Analysing the resulting transcription timecourses for their underlying switching dynamics we find a conserved and highly structured pattern of transcriptional change which is common to most of the clones. In an independent analysis based on optimal fitness we show how this particular pattern could have evolved as an optimal strategy between repertoire protection and immune evasion and how it allows the pathogen to successfully establish infections in non-naïve individuals.
Results
Var gene transcription profiles
We derived a number of clones from two different genotypes (IT and 3D7) and from these clones, selected a number of parasites that expressed a single dominant var transcript (as evidenced by Northern blot, data not shown). Using quantitative real time PCR, we then measured the expression levels of all var genes at various time points over an extended period of in vitro culture. In the resulting timecourses, transcription profiles of the initial state, as expected, were characterised by a dominant transcript with some minor transcripts also present. We chose transcription profiles of seven clones, for further analysis. Note, for simplicity, in the main figures we only present data for the five most prominent transcripts. An example showing all var gene transcripts of a replicate timeseries of clone 3D7_AS2 both as percentage of total signal and relative transcript level, including the experimental variation between runs, can be found in the supplementary material (Figs. S1A and B); the reproducibility of our data is further evidenced in Fig. S2 where we show the variation in transcript distribution of repeated timecourses of a single clone.
In three clones (IT_2F6, IT_3G8 and IT_CSA) we observed no change in the initial dominant transcript, which persisted for as long as we followed the culture (up to 80 generations) with small variations in the abundance of the minor transcripts (Fig. 1A, 1C and 1E and Table 1). In three other clones (IT_2B2, 3D7_AS2 and 3D7_AS3) by contrast, the initial dominant transcript declined with time and was eventually replaced by an alternate dominant transcript (Fig. 1B, 1D, and 1F and Table 1). The final clone (NF54_NR13) showed a behaviour that was intermediate between these two states. In this case, the original transcript continues to be the most abundant over 90 cycles, but other transcripts rise to levels of around 80% of the original (Fig. S3 and Table 1). The fact that we consistently find only two major types of transcriptional change in different clones strongly suggests that these are not simply down to random fluctuations or experimental oddities but must represent some inherent characteristic of var gene switching.


We [23] and others [24] have previously noted that some var genes appear to have very slow off-rates based on stable, dominant transcription levels over many generations of in vitro culture; for these we would not expect to see major changes in transcript levels over the time course of the experiment. For those variants with significantly faster off-rates, on the other hand, we would expect that the culture eventually expresses a wide range of different genes and that the amount of each variant being determined by its intrinsic on - and off-rates. Instead, we observe a replacement of the dominant transcript over a timescale that is inconsistent with the idea that it is a result of direct switching between the two.
Pattern of transcriptional change
To investigate this apparent phenomenon of transcript replacement more closely, we analysed the timecourses mathematically for their underlying switching dynamics. Initial studies showed that simple variation in variant growth rates could not give rise to the observed pattern (data not shown) Thus, assuming no in vitro growth rate differences between parasites expressing different var genes, the dynamics of a variant can then be described purely by its intrinsic on - and off-rates. A variant's on-rate is effectively the result of other genes switching towards this particular variant at a certain rate and bias. Bias in this context simply refers to the probability of a switch from variant i to variant j. We used an iterative process (see Methods) to find the combination of off-rates and switch biases that would best explain the observed switching pattern. In this model constraints are imposed such that we assume that switch rates are constant over time and necessarily require that the total sum of the switch biases of each variant add up to one. Despite the remaining large parameter space of possible on - and off-rate combinations, our method consistently converged upon a particular qualitative structure where the initial variant switches at medium off-rate with no preferential bias to a subset of variants. Each variant in this subset has a high off-rate and a high transcription probability biased towards a single new variant. We refer to this structure hereafter, for simplicity, as the single-many-single or sms pathway. Fig. 2 shows the result of our analysis for three data sets. The left panel depicts the resulting switch-matrices, where the size of each circle in row i and column j corresponds to the transcription probability from variant i to j, and the off-rate vectors where the size of each circle corresponds to the variant's off-rate. Note, in our analysis we only used a subset of the var transcripts, in this case the 12 most dominant variants, which we determined to be optimal given the available data (see Methods). Most other var gene transcripts remain at very low levels over the entire time course (see e.g. Figs. S1 and S2), however, and these are unlikely to have a significant effect on the observed switching pattern.

The predicted sms pathway can be seen within the matrix as an unbiased switch away from the initial variant (here variant 1) to a set of variants with a strong bias towards the second dominant variant (here variant 2). This particular pattern is illustrated by highlighting the major switch pathways as flow-diagrams in the middle panel of Fig. 2. In every case the initial variant switches to a group of variants which then switch at high rate and similar bias to another variant that will then become the dominant transcript. The right panel shows the qualitative comparison between the experimental transcription profiles (of the five most prominent transcripts) and the timecourses generated by our model. In each case there is good agreement between the data and model output. In line with Fig. 1 and for illustrative purposes only we chose to show only a subset of variants; an example showing all 12 variants can be found in the supplementary material (Fig. S4A and B). To compare the fit of the predicted switch pathway to other possible pathways we applied various constraints to our model such that only one or a small number of variants are allowed to have switch biases and thus contribute to the observed switching pattern (see supplementary Fig. S5). This clearly showed that simple differences in switch rates could not explain the data. It also highlighted the fact that a direct one-to-one switch from the first dominant variant to the second one is incompatible with the observed data.
We also considered the parasite clones in which a single dominant transcript in these profiles remained stable. One feature of these data that was difficult to explain was the fact that a series of minor transcripts was always present and in most cases their abundance showed slight or significant fluctuations over time. Since all of these parasites are clonal, the minor transcripts must have arisen from some daughters switching away from the original var type present in the original clone. Why then did this switching process not continue so that the proportion of the dominant transcript decreased observably over time? Applying the above analysis to this series of data we discovered that in these cases also, an SMS pathway was the best fit to the data, as exemplified by Fig. 2C. Our analysis thus suggests that although these clones exhibit a phenotype of stable expression of a single variant, a much more dynamic situation may exist in which the dominant var gene is continuously switching to a subset of other var genes (the minor transcripts that fluctuate) which continue to switch back to the original dominant transcript.
Finally we applied our analysis to transcription profiles previously generated by Frank et al. [19] and found the same switching pattern underlying their data (see Fig. S6). The fact that we can recapture the same pattern from two independently derived sets of data from different parasite genotypes and multiple independent clones strongly suggests that this particular pathway is an intrinsic feature of var gene switching.
Optimal switching pattern
We next investigated why this unusual pattern of switching might have evolved. In vivo, P. falciparum is faced with two opposing pressures. If the host is rapidly exposed to the majority of the antigenic repertoire, then there is the danger of the elimination of the parasite by the immune response. Thus the parasite needs to minimise the proportion of the antigenic repertoire to which the host will become exposed. At the same time, in order to maximise the potential for immune evasion, every var gene should be readily accessible, in terms of being switched to, from every other gene within the repertoire. To investigate if the observed pathway could have arisen as a result of this evolutionary conflict, we envisaged the var gene repertoire as a network in which the nodes represent individual gene variants and the edges the transition, i.e. switches, between them. We used a genetic algorithm to ‘evolve’ an initially random network to optimise over two traits: (i) average distance through the network, which corresponds to repertoire protection and indirectly infection length, and (ii) robustness to the removal of individual nodes, which corresponds to the ability to adapt to selection pressure, e.g. through pre-existing antibody responses.
As expected, optimising a network to maximise robustness led to a fully connected network where variants switch to every other variant within the network, whereas optimising for repertoire protection alone results in a ring-like structure where every variant switches to one other variant only (Fig. 3). Optimising over both traits simultaneously, however, results in a lattice-type network containing nodes with either a high out-degree, i.e. variants that switch to a high number of other variants, or nodes with a high in-degree, i.e. variants which are being switched to by a high number of other variants. Together, these ‘source’ and ‘sink’ nodes, highlighted in blue and red in Fig. 3, respectively, form the basis of an expansion - contraction process that embodies the evolutionary trade-off between adaptability and repertoire protection in var gene switching.

We note that this expansion – contraction process incorporated in the ‘lattice-type’ switching pattern closely resembles the sms pathway we predicted to underlie the observed in vitro switching. However, the optimised network does not take into account switch rates and biases but rather presents a net flow, or transition, between any two variants. For a better qualitative comparison we can represent the switching matrices together with their respective off-rate vectors as a directed network where each edge corresponds to the switch direction from one variant (node) to another, simply calculated from the sign of the net transition, (see Methods). In this case we find the resulting network again divided into nodes with either a high in-degree or out-degree, shown in Figs. S7A and S7B for clones 3D7_AS2 and IT_2B2, respectively, underlining the similarity between the sms and lattice-type pattern.
(i) Comparison of switching pathways during primary infections
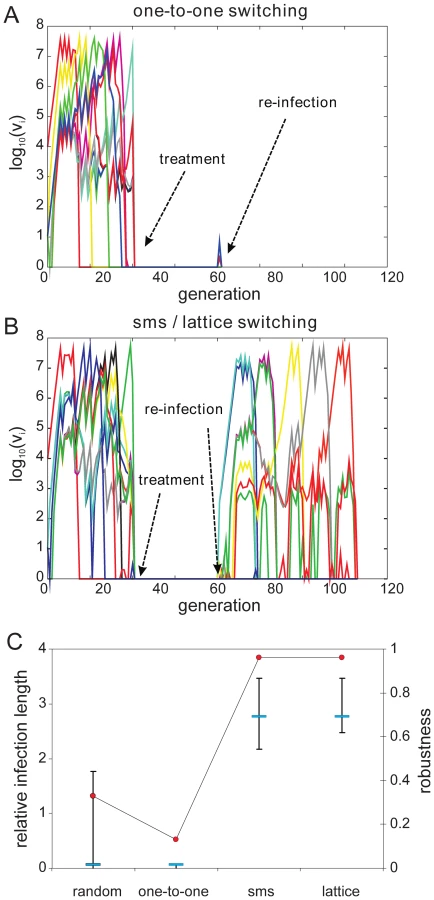
To investigate how a pre-determined switching pathway might affect the in vivo dynamics of parasite growth, we simulated various switching patterns during the early phases of malaria infection in a naïve individual by means of a simple within-host model, the details of which we have previously published ([22], plus see Methods and supplementary material). We considered four different switch pathways: (i) random, with no inherent switch biases, (ii) a simple one-to-one switch where each variant predominantly switches to one other variant, and the two highly structured switch pathways predicted by the network optimisation and data analysis, (iii) lattice-type and (iv) sms-type switching, respectively. While we found no discernible differences in the ability to establish an infection (Fig. 4A and 4B), we observed an increase in the duration of infection as switching becomes more structured (Fig 4C). To obtain results that are independent of particular parameter values, especially those concerning the immune response, we measured Infection length in this context as multiples of a single variant infection.

(ii) Effect of switching pathways during subsequent infections
We then examined the effect of structured switching in individuals with pre-existing immunity to a number of antigenic variants. We simulated re-infection by ‘clearing’ an ongoing infection and re-challenging the host with the same pathogen, i.e. with the same antigenic repertoire and switch pathway. This is of particular interest as it takes into account the actual order at which variants appear during the initial stages of infection as dictated by both the switch pathway and the antigenic relationship between the variants. As each variant triggers both long-lived variant-specific and temporary cross-reactive responses (see full model details in the supplementary material) we made sure to leave enough time between clearance and re-challenge to allow the short-lived responses to decay.
As expected, pre-existing immune responses greatly reduce the parasite's propensity to establish infections. However, we found that the more structured sms and lattice-type switch pathways are far more efficient at establishing a secondary infection than either one-to-one or random switching. Fig. 5A demonstrates how the strict switch hierarchy in the one-to-one pathway can quickly lead to immune elimination as the pre-existing responses rapidly react to the first set of variants and clear the infection. In contrast, the expansion-contraction process embodied by both the sms and lattice-type pathways is sufficiently flexible to overcome these constraints (exemplified in Fig. 5B). Importantly also, there is no significant difference between the sms and lattice-type pathways in their ability to successfully establish a secondary infection or in the duration of the ensuing infections (Fig. 5C), reinforcing the notion that these two pathways are, at least qualitatively, equivalent.
Discussion
Establishing chronic infections is particularly important among vector borne pathogens since vector abundance may be seasonal or otherwise uncertain. For pathogens with a limited antigenic repertoire, such as P. falciparum, control over variant expression is therefore essential. Despite some differences in results and interpretation, it is becoming clear that the var gene repertoire of P. falciparum is divided into slow and fast switching phenotypes (this paper, [23], [24], [25]). This could potentially introduce a switch hierarchy by which stable variants are more prominently expressed during the early phases of infection. However, with only ∼60 members of the var gene family among which to switch [26] and typical clinical parasite burdens of >1010, it is very difficult to envisage how this partitioning of on - or off-rates alone could prevent the entire repertoire from being expressed early on.
Here we report that var gene switching might occur in a highly structured pattern which can offer a partial solution to this problem. This particular pathway not only depends on inherent differences in the rates at which var genes become transcriptionally active or silent but crucially on intrinsic switch biases between individual genes. Importantly, we also found that very high on-rates and very low off-rates can both be explained by the same principal mechanism of biased switching in which a subset of variants switch at high bias either to a new variant or back to the original. We therefore note that var gene activation cannot be simply seen as an ‘intrinsic’ property but should be viewed in context of a whole var gene switching network. This further implies that the fate of a gene is crucially dependent on the ‘starting position’ within this network such that a variant that quickly gains dominance in a particular situation might not reach significant levels under different circumstances if it is part of a different ‘sub-network’, i.e. when it does not get switched to at sufficiently high rates from other variants, and vice versa.
Other antigenically variable organisms such as Trypanosoma spp or Borrelia hermsii also exhibit programmed sequences of gene activation [27], [28], [29], [30]. In contrast to P. falciparum, however, these may partly be mediated by sequence homologies between the expression site and the donor site used for recombination [31]. One major drawback of tightly ordered gene activation is that it requires every subsequent variant to be able to evade current immune responses and therefore may be compromised by previous infections. For organisms such as T. brucei or B. hermsii, which predominantly infect naive hosts or are less constrained in their generation of antigenic diversity during infection, this is not a major problem. For P. falciparum, however, most infections occur in non-naive individuals and complete discordance between the infecting parasite and the immune repertoire of the host cannot be guaranteed. Furthermore, the rate of mitotic recombination between var genes [32], [33] is unlikely to be fast enough to evade pre-existing immune responses. The initial expansion or diversification process towards a group of variants within the sms pathway might therefore significantly improve the chance of evading early immune responses whilst the subsequent contraction protects the remaining repertoire from further exposure.
With regards to how the aforementioned trade-off within which this particular switch pattern has evolved it is interesting to note that it represents two selective forces acting at both the within - and the between-host levels. That is, the within-host infection dynamics are dominated by the pathogen's need to survive for as long as possible to enhance its chance for onward transmission. This requirement would usually favour a tightly regulated sequence of gene activation to minimise the exposure of the parasite's antigenic repertoire. On the other hand, though, a strict order of expression together with its accompanying immune signature would leave the parasite highly vulnerable when encountering hosts with previous exposure to similar strains. Therefore, having a more flexible yet still structured switch pattern, as the one reported here, could potentially ease competition between antigenically similar strains. Furthermore, as the activation of gene variants appears to be governed by the whole var gene switching network, and in particular the starting variant, population level exhaustion of potentially dominant, i.e. intrinsically over-expressed variants is further minimised.
Switch or activation hierarchies have previously been proposed to explain the sequential appearance of antigenic variants during trypanosome infections [34], [35]. Although it was indicated that this coordinated expression can occur even with a small variant repertoire [35], it is unclear whether it can be stably maintained over longer periods. We have previously demonstrated that immune mediated selection, by means of short-lived cross-reacting antibody responses against shared epitopes, can structure the parasite populations into sequential dominance of individual variants [22]. While this model was very successful in producing chronic infection, the time taken to establish the cross-reactive antibody responses in vivo meant that the model could not accurately reflect early infection kinetics where parasite intrinsic factors, such as structured switching, are more likely to play a role. The sms pattern of switching reported in this paper has the potential to unite the two mechanisms by producing a realistic progression in expression of variants in the early stages of infection while setting up the conditions, in this case, a network of partially cross-reactive responses, that reliably leads to chronic infection.
The antigenic relationship between the variants within a specific switching pathway also appears to play an important role. In particular, the model predicts that in both the sms and lattice-type switching pathways the initial switch should be to a set of antigenically similar variants which then all switch to an antigenically distinct one. In this process, ‘switch intermediates’ are effectively controlled by the cross-reactive responses elicited by the initial variant and can therefore be ‘used’ again during the later stages of infection. This conclusion would be consistent with the in vivo observations of Kaestli et al. [36] that observed the reappearance of the same variant in patients monitored longitudinally.
What are the implications of our findings for the molecular mechanisms that underlie the switching process? Frank et al. [24] suggested from their experiments that the expression of a stable, non-switching transcript is associated with centrally positioned var genes (those bearing an UpsC type promoter sequence) whereas rapidly switching var genes are located in the sub-telomeres. We also see a preponderance of central genes in the non-switching clones but also telomeric genes such as PFD0020c and var2CSA from both genotypes. Similarly we note a 3∶1 ratio of telomeric to central genes in those clones that switched rapidly. Thus an association with genomic position may exist, but this is not absolute. In the data that we have available, we also observe that switches occur only to var genes located on other chromosomes, or to var genes located in central versus telomeric clusters on the same chromosome. Switches to closely linked genes appear to be prohibited unless accompanied by a local deletion event [37], [38]. It has been shown that active var loci occupy a ‘transcriptionally permissive zone’ in the parasite nucleus [39] as part of a cluster of telomere ends [33]. Therefore, it may be that other var genes in the cluster containing the active gene are favored for activation. We were unable to find any strict association of these switching patterns with primary sequence features. However, these data now permit a systematic description, perhaps through parasite transfection experiments, of the sequences and molecules responsible for these switching patterns.
Together, our results highlight the intriguing interplay between parasite-controlled switching and immune-mediated selection and reinforce the hypothesis that structured switching in P. falciparum has evolved as an evolutionary compromise between the protection of its limited antigenic repertoire and the flexibility to fully utilise this repertoire when needed.
Methods
Experimental procedure
Quantitative ‘real-time’ PCR was performed using a Rotorgene thermal cycler system (Corbett Research). Reactions were performed in 15 µl volumes using 2X QuantiTect SYBR Green PCR master mix (Qiagen), var-specific primers at .5 µM, and the appropriate volume of DEPC-treated H20 (Qiagen). The PCR cycling conditions were further optimized for P. falciparum cDNA were 95°C for 15 min followed by 40 cycles of 94°C for 30 s, 58°C for 25 s and 68°C for 30 s followed by a final extension step at 68°C for 10 minutes. To give more consistent reaction efficiency, we found it necessary to redesign seven primer sets which were placed near or inside the transmembrane-encoding sequence (Supplementary Methods): PFI1830c, PF08_0106, PF07_0139, PF11_0008, PFD1000c, PFD1245c, and PFD1015c. Primers were stored at a 10× concentration at 4°C and cDNA was kept in single-use aliquots. The fluorescent signal was acquired at the end of the elongation step of each reaction cycle. After the reaction, product specificity was verified by melting-curve analysis and gel electrophoresis of each PCR product.
Quantification using the ‘Comparative Quantitation’ method packaged with ROTORGENE software version 6.0. All primer pairs were tested on identical aliquots of genomic DNA, and the median ‘Take-Off Point’ value for the primer set was calculated. The ‘Take-Off Point’ is analogous to the ‘CT-value’ employed by the ΔΔCT method, except the ‘Take-Off Point’ is computationally determined and its measurement does not require a standard curve for each primer set. Furthermore the ‘Take-Off Point’ is based on the kinetics of each reaction, not a critical fluorescence value that may favour certain transcripts over others. Primer pairs with ‘Take-Off’ values varying by +/ − 50% of the median value when tested on the same sample of DNA were redesigned and retested. To account for amplification bias in the reaction conditions, a correction factor equal to the average variation from the mean ‘Take-Off’ point over 5 trials was applied. We used seryl-tRNA synthetase as an endogenous control as it displayed the most uniform transcription profile in different parasite isolates and an unchanged pattern throughout the parasite life cycle. All transcript levels were then normalised with respect to the most abundant variants as this allowed for better comparison in transcript levels and their respective change over the time course.
Analysis of transcription profiles
We devised a time-discrete model to describe the change in the proportion of var gene transcripts from generation to generation, assuming each variant has a constant rate and bias at which it will switch towards another variant. The proportion of variant i, vi, at generation t+1 is therefore the sum of variants j switching towards variant i minus the proportion that has switched away from variant i. The dynamics of the variants can then be written as follows:with vi(t) = proportion of variant i at generation t, ωi = off-rate of variant i, and βji = switch bias from variant j to variant i.
To determine the switch matrix, (βji), and off-rate vector, (ωi), we used a Markov Chain Monte Carlo (MCMC)-like method to find the best model fit to the data by iteratively modifying the switch rates and switch biases. An initial matrix and off-rate vector are randomly filled and then repeatedly subjected to small perturbations. At each iterative step, i.e. after each perturbation, we calculated the deviation between data and model output by defining the following error:where is the measured transcript level of variant i at time point t and is the model output. If the perturbed matrix and vector yield a smaller error than the original ones they will be updated and again subjected to small perturbations. This process is repeated until a chosen convergence criteria (on ε) is fulfilled.
Because of the high number of free parameters and small number of available data points we chose to use a reduced system. That is, instead of trying to fit the full 60×60 switch matrix and 60 off-rates we used a 12 dimensional matrix and vector instead. This was also motivated by the fact that only a subset of measured transcript was above a 5% confidence level. However, we also investigated smaller and bigger systems and found that while this did not change the qualitative nature of the results presented here, the 12 dimensional system seemed optimal in terms of computational speed, goodness-of-fit and convergence. That is, using a much reduced system resulted in a noticeably poorer fit whereas increasing its dimension did not significantly improve the fit between model outcome and the data after a given number of iterations (see Fig. S8).
Genetic algorithm
To determine an optimal switch strategy between immune evasion and repertoire protection we employed a genetic algorithm. The aim was to optimise a network for both a) average distance through the network (corresponding to infection length), and b) robustness to the removal of nodes (corresponding to evading ongoing or pre-existing immune responses). Average distance was defined as the mean number of edges that must be traversed by the shortest path between every pair of nodes in the network (the geodesic distance), normalised to a value between zero and one by dividing by the maximum possible. Robustness was measured as the average proportion of nodes that must be removed in order to fragment the network into more than one component, based on 500 simulations of the progressive removal of random nodes for each network. A simple multiplicative fitness function was defined based on these network parameters, since both were normalised to values between 0 and 1, and randomly generated networks were modified iteratively; random deletions and additions of edges that improved the network's fitness were kept and built upon, whereas random deletions and additions that lowered its fitness were discarded.
Infection model
To simulate the effect of structured switching on malaria infection dynamics we employed a stochastic, mathematical model based on a previous antigenic variation framework [20]; full model details can be found as online supplemental content (Text S1).
Supporting Information
Zdroje
1. Barnwell
JW
Asch
AS
Nachman
RL
Yamaya
M
Aikawa
M
1989
A human 88-kD membrane glycoprotein (CD36) functions in vitro as
a receptor for a cytoadherence ligand on Plasmodium falciparum-infected
erythrocytes.
J Clin Invest
84
765
772
2. Berendt
AR
Simmons
DL
Tansey
J
Newbold
CI
Marsh
K
1989
Intercellular adhesion molecule-1 is an endothelial cell adhesion
receptor for Plasmodium falciparum.
Nature
341
57
59
3. Roberts
DD
Sherwood
JA
Spitalnik
SL
Panton
LJ
Howard
RJ
1985
Thrombospondin binds falciparum malaria parasitized erythrocytes
and may mediate cytoadherence.
Nature
318
64
66
4. Rogerson
SJ
Chaiyaroj
SC
Ng
K
Reeder
JC
Brown
GV
1995
Chondroitin sulfate A is a cell surface receptor for Plasmodium
falciparum-infected erythrocytes.
J Exp Med
182
15
20
5. Turner
GD
Morrison
H
Jones
M
Davis
TM
Looareesuwan
S
1994
An immunohistochemical study of the pathology of fatal malaria.
Evidence for widespread endothelial activation and a potential role for
intercellular adhesion molecule-1 in cerebral sequestration.
Am J Pathol
145
1057
1069
6. Bull
PC
Lowe
BS
Kortok
M
Molyneux
CS
Newbold
CI
1998
Parasite antigens on the infected red cell surface are targets
for naturally acquired immunity to malaria.
Nat Med
4
358
360
7. Leech
JH
Barnwell
JW
Miller
LH
Howard
RJ
1984
Identification of a strain-specific malarial antigen exposed on
the surface of Plasmodium falciparum-infected erythrocytes.
J Exp Med
159
1567
1575
8. Roberts
DJ
Craig
AG
Berendt
AR
Pinches
R
Nash
G
1992
Rapid switching to multiple antigenic and adhesive phenotypes in
malaria.
Nature
357
689
692
9. Peters
J
Fowler
E
Gatton
M
Chen
N
Saul
A
2002
High diversity and rapid changeover of expressed var genes during
the acute phase of Plasmodium falciparum infections in human
volunteers.
Proc Natl Acad Sci U S A
99
10689
10694
10. Smith
JD
Chitnis
CE
Craig
AG
Roberts
DJ
Hudson-Taylor
DE
1995
Switches in expression of Plasmodium falciparum var genes
correlate with changes in antigenic and cytoadherent phenotypes of infected
erythrocytes.
Cell
82
101
110
11. Deitsch
KW
Moxon
ER
Wellems
TE
1997
Shared themes of antigenic variation and virulence in bacterial,
protozoal, and fungal infections.
Microbiol Mol Biol Rev
61
281
293
12. Duraisingh
MT
Voss
TS
Marty
AJ
Duffy
MF
Good
RT
2005
Heterochromatin silencing and locus repositioning linked to
regulation of virulence genes in Plasmodium falciparum.
Cell
121
13
24
13. Marty
AJ
Thompson
JK
Duffy
MF
Voss
TS
Cowman
AF
2006
Evidence that Plasmodium falciparum chromosome end clusters are
cross-linked by protein and are the sites of both virulence gene silencing
and activation.
Mol Microbiol
62
72
83
14. Calderwood
MS
Gannoun-Zaki
L
Wellems
TE
Deitsch
KW
2003
Plasmodium falciparum var genes are regulated by two regions with
separate promoters, one upstream of the coding region and a second within
the intron.
J Biol Chem
278
34125
34132
15. Dzikowski
R
Li
F
Amulic
B
Eisberg
A
Frank
M
2007
Mechanisms underlying mutually exclusive expression of virulence
genes by malaria parasites.
EMBO Rep
8
959
965
16. Frank
M
Dzikowski
R
Costantini
D
Amulic
B
Berdougo
E
2006
Strict pairing of var promoters and introns is required for var
gene silencing in the malaria parasite Plasmodium
falciparum.
J Biol Chem
281
9942
9952
17. Dzikowski
R
Frank
M
Deitsch
K
2006
Mutually exclusive expression of virulence genes by malaria
parasites is regulated independently of antigen production.
PLoS Pathog
2
e22
18. Voss
TS
Healer
J
Marty
AJ
Duffy
MF
Thompson
JK
2006
A var gene promoter controls allelic exclusion of virulence genes
in Plasmodium falciparum malaria.
Nature
439
1004
1008
19. Chookajorn
T
Dzikowski
R
Frank
M
Li
F
Jiwani
AZ
2007
Epigenetic memory at malaria virulence genes.
Proc Natl Acad Sci U S A
104
899
902
20. Lopez-Rubio
JJ
Gontijo
AM
Nunes
MC
Issar
N
Hernandez Rivas
R
2007
5′ flanking region of var genes nucleate histone
modification patterns linked to phenotypic inheritance of virulence traits
in malaria parasites.
Mol Microbiol
66
1296
1305
21. Freitas-Junior
LH
Hernandez-Rivas
R
Ralph
SA
Montiel-Condado
D
Ruvalcaba-Salazar
OK
2005
Telomeric heterochromatin propagation and histone acetylation
control mutually exclusive expression of antigenic variation genes in
malaria parasites.
Cell
121
25
36
22. Recker
M
Nee
S
Bull
PC
Kinyanjui
S
Marsh
K
2004
Transient cross-reactive immune responses can orchestrate
antigenic variation in malaria.
Nature
429
555
558
23. Horrocks
P
Pinches
R
Christodoulou
Z
Kyes
SA
Newbold
CI
2004
Variable var transition rates underlie antigenic variation in
malaria.
Proc Natl Acad Sci U S A
101
11129
11134
24. Frank
M
Dzikowski
R
Amulic
B
Deitsch
K
2007
Variable switching rates of malaria virulence genes are
associated with chromosomal position.
Mol Microbiol
64
1486
1498
25. Gatton
ML
Cheng
Q
2004
Investigating antigenic variation and other parasite-host
interactions in Plasmodium falciparum infections in naive
hosts.
Parasitology
128
367
376
26. Gardner
MJ
Hall
N
Fung
E
White
O
Berriman
M
2002
Genome sequence of the human malaria parasite Plasmodium
falciparum.
Nature
419
498
511
27. Barry
JD
1986
Antigenic variation during Trypanosoma vivax infections of
different host species.
Parasitology
92
Pt 1
51
65
28. Miller
EN
Turner
MJ
1981
Analysis of antigenic types appearing in first relapse
populations of clones of Trypanosoma brucei.
Parasitology
82
63
80
29. Barbour
AG
Dai
Q
Restrepo
BI
Stoenner
HG
Frank
SA
2006
Pathogen escape from host immunity by a genome program for
antigenic variation.
Proc Natl Acad Sci U S A
103
18290
18295
30. Stoenner
HG
Dodd
T
Larsen
C
1982
Antigenic variation of Borrelia hermsii.
J Exp Med
156
1297
1311
31. Dai
Q
Restrepo
BI
Porcella
SF
Raffel
SJ
Schwan
TG
2006
Antigenic variation by Borrelia hermsii occurs through
recombination between extragenic repetitive elements on linear
plasmids.
Mol Microbiol
60
1329
1343
32. Duffy
MF
Maier
AG
Byrne
TJ
Marty
AJ
Elliott
SR
2006
VAR2CSA is the principal ligand for chondroitin sulfate A in two
allogeneic isolates of Plasmodium falciparum.
Mol Biochem Parasitol
148
117
124
33. Freitas-Junior
LH
Bottius
E
Pirrit
LA
Deitsch
KW
Scheidig
C
2000
Frequent ectopic recombination of virulence factor genes in
telomeric chromosome clusters of P. falciparum.
Nature
407
1018
1022
34. Lythgoe
KA
Morrison
LJ
Read
AF
Barry
JD
2007
Parasite-intrinsic factors can explain ordered progression of
trypanosome antigenic variation.
Proc Natl Acad Sci U S A
104
8095
8100
35. Frank
SA
1999
A model for the sequential dominance of antigenic variants in
African trypanosome infections.
Proc Biol Sci
266
1397
1401
36. Kaestli
M
Cortes
A
Lagog
M
Ott
M
Beck
HP
2004
Longitudinal assessment of Plasmodium falciparum var gene
transcription in naturally infected asymptomatic children in Papua New
Guinea.
J Infect Dis
189
1942
1951
37. Deitsch
KW
del Pinal
A
Wellems
TE
1999
Intra-cluster recombination and var transcription switches in the
antigenic variation of Plasmodium falciparum.
Mol Biochem Parasitol
101
107
116
38. Horrocks
P
Kyes
S
Pinches
R
Christodoulou
Z
Newbold
C
2004
Transcription of subtelomerically located var gene variant in
Plasmodium falciparum appears to require the truncation of an adjacent var
gene.
Mol Biochem Parasitol
134
193
199
39. Ralph
SA
Scheidig-Benatar
C
Scherf
A
2005
Antigenic variation in Plasmodium falciparum is associated with
movement of var loci between subnuclear locations.
Proc Natl Acad Sci U S A
102
5414
5419
Štítky
Hygiena a epidemiologie Infekční lékařství LaboratořČlánek vyšel v časopise
PLOS Pathogens
2011 Číslo 3
- Farmakovigilanční studie perorálních antivirotik indikovaných v léčbě COVID-19
- Jak souvisí postcovidový syndrom s poškozením mozku?
- Měli bychom postcovidový syndrom léčit antidepresivy?
- 10 bodů k očkování proti COVID-19: stanovisko České společnosti alergologie a klinické imunologie ČLS JEP
Nejčtenější v tomto čísle
- A Toxin that Hijacks the Host Ubiquitin Proteolytic System
- Invasive Extravillous Trophoblasts Restrict Intracellular Growth and Spread of
- Blood Meal-Derived Heme Decreases ROS Levels in the Midgut of and Allows Proliferation of Intestinal Microbiota
- Metabolite Cross-Feeding Enhances Virulence in a Model Polymicrobial Infection