
A Genome-Wide Association Study of Optic Disc Parameters
The optic nerve head is involved in many ophthalmic disorders, including common diseases such as myopia and open-angle glaucoma. Two of the most important parameters are the size of the optic disc area and the vertical cup-disc ratio (VCDR). Both are highly heritable but genetically largely undetermined. We performed a meta-analysis of genome-wide association (GWA) data to identify genetic variants associated with optic disc area and VCDR. The gene discovery included 7,360 unrelated individuals from the population-based Rotterdam Study I and Rotterdam Study II cohorts. These cohorts revealed two genome-wide significant loci for optic disc area, rs1192415 on chromosome 1p22 (p = 6.72×10⁻¹⁹) within 117 kb of the CDC7 gene and rs1900004 on chromosome 10q21.3-q22.1 (p = 2.67×10⁻³³) within 10 kb of the ATOH7 gene. They revealed two genome-wide significant loci for VCDR, rs1063192 on chromosome 9p21 (p = 6.15×10⁻¹¹) in the CDKN2B gene and rs10483727 on chromosome 14q22.3-q23 (p = 2.93×10⁻¹⁰) within 40 kbp of the SIX1 gene. Findings were replicated in two independent Dutch cohorts (Rotterdam Study III and Erasmus Rucphen Family study; N = 3,612), and the TwinsUK cohort (N = 843). Meta-analysis with the replication cohorts confirmed the four loci and revealed a third locus at 16q12.1 associated with optic disc area, and four other loci at 11q13, 13q13, 17q23 (borderline significant), and 22q12.1 for VCDR. ATOH7 was also associated with VCDR independent of optic disc area. Three of the loci were marginally associated with open-angle glaucoma. The protein pathways in which the loci of optic disc area are involved overlap with those identified for VCDR, suggesting a common genetic origin.
Published in the journal:
. PLoS Genet 6(6): e32767. doi:10.1371/journal.pgen.1000978
Category:
Research Article
doi:
https://doi.org/10.1371/journal.pgen.1000978
Summary
The optic nerve head is involved in many ophthalmic disorders, including common diseases such as myopia and open-angle glaucoma. Two of the most important parameters are the size of the optic disc area and the vertical cup-disc ratio (VCDR). Both are highly heritable but genetically largely undetermined. We performed a meta-analysis of genome-wide association (GWA) data to identify genetic variants associated with optic disc area and VCDR. The gene discovery included 7,360 unrelated individuals from the population-based Rotterdam Study I and Rotterdam Study II cohorts. These cohorts revealed two genome-wide significant loci for optic disc area, rs1192415 on chromosome 1p22 (p = 6.72×10⁻¹⁹) within 117 kb of the CDC7 gene and rs1900004 on chromosome 10q21.3-q22.1 (p = 2.67×10⁻³³) within 10 kb of the ATOH7 gene. They revealed two genome-wide significant loci for VCDR, rs1063192 on chromosome 9p21 (p = 6.15×10⁻¹¹) in the CDKN2B gene and rs10483727 on chromosome 14q22.3-q23 (p = 2.93×10⁻¹⁰) within 40 kbp of the SIX1 gene. Findings were replicated in two independent Dutch cohorts (Rotterdam Study III and Erasmus Rucphen Family study; N = 3,612), and the TwinsUK cohort (N = 843). Meta-analysis with the replication cohorts confirmed the four loci and revealed a third locus at 16q12.1 associated with optic disc area, and four other loci at 11q13, 13q13, 17q23 (borderline significant), and 22q12.1 for VCDR. ATOH7 was also associated with VCDR independent of optic disc area. Three of the loci were marginally associated with open-angle glaucoma. The protein pathways in which the loci of optic disc area are involved overlap with those identified for VCDR, suggesting a common genetic origin.
Introduction
The optic nerve head, or optic disc, is the place where the axons of the retinal ganglion cells leave the eye and form the optic nerve. Its morphology, visible by ophthalmoscopy, is important in the diagnosis and follow-up of patients with (neuro-) ophthalmologic diseases, such as ischemic and hereditary optic neuropathies, optic neuritis, papilledema and primary open-angle glaucoma (OAG). Optic disc parameters of interest are the surface of the optic nerve head referred to as the optic disc area (measured in units of mm2), and the vertical cup-disc ratio (VCDR). The optic disc area is associated with general characteristics (such as body height) as well as ocular ones (such as axial length) [1], [2]. The relation to axial length makes the optic disc size directly relevant for nearsightedness (myopia), one of the most common ophthalmic disorders. Furthermore, it has been suggested that larger optic discs may suffer more from intraocular pressure-related stress, a strong risk factor for OAG [3]. However, the association of the size of the optic disc to OAG is not clear since it has been argued that larger optic discs may have a larger anatomical reserve for various optic neuropathies such as OAG due to higher number of nerve fibers [4]. Effects may even partially counteract each other [4].
The VCDR is a parameter commonly used in the clinical glaucoma management [5]. The VCDR is determined by comparing (in a vertical direction) the size of the cup, a region without axons, to the size of the optic disc. An increase in VCDR may indicate the occurrence of glaucomatous changes of the optic nerve head, referred to as glaucomatous optic neuropathy [6]. In addition, an unusual large VCDR at a single observation is a significant determinant of glaucoma [7], [8]. The heritability of the optic disc area and VCDR are estimated to be around 52–59% and 48–80%, respectively, [9]–[12] suggesting a major role for genetic factors. This prompted us to study the genes determining the optic disc area and VCDR as endophenotypes for myopia and OAG.
To identify genetic determinants of optic disc area and VCDR, we performed a genome-wide association study (GWAS) of optic disc area and VCDR using data from Caucasian participants of the Rotterdam Study [RS] (cohort I and II, in which participants have an identical age distribution and eye assessment) and replicated our findings in three independent cohorts of Caucasian ethnicity: the Rotterdam Study III [RS-III, a younger cohort], the Erasmus Rucphen Family [ERF] study and the TwinsUK cohort (see Materials and Methods for details of all cohorts). Next, we examined whether the genome-wide significant Single Nucleotide Polymorphisms (SNPs) were related to myopia and OAG using data from patients with (one of) these diseases from the Rotterdam Study I.
Results
Study samples
The discovery cohorts included 5,312 (RS-I) and 2,048 (RS-II) participants who were genotyped and had reliable optic disc data, resulting in a total of 7,360 participants included in the primary GWAS discovery set. A small fraction (205 from RS-I and 90 from RS-II), had missing or unreliable baseline data; for these we used the data available at follow-up. From RS-III, 1,966 participants were included, and from ERF 1,646, resulting in a total of 10,972 when combining the discovery and replication cohorts from the Netherlands, and 11,815 when also including the 843 participants of TwinsUK. Table 1 summarizes the general characteristics of the discovery and replication cohorts. There are significant differences between the cohorts in terms of age (discovery cohort is older), gender (TwinsUK includes only women) and optic disc parameters (due to different disc-assessment techniques [see Materials and Methods]; the analyses were adjusted for this difference).

Figure S1 and Figure S2 show the Q-Q plots for the observed versus expected p-values for each individual study and for the meta-analysis of the discovery and replication cohorts for optic disc area and VCDR, respectively. Genomic control for all four cohorts showed low dispersion for optic disc area as well as for VCDR with inflation factors in the range of 1.024 and 1.061.
Optic disc area
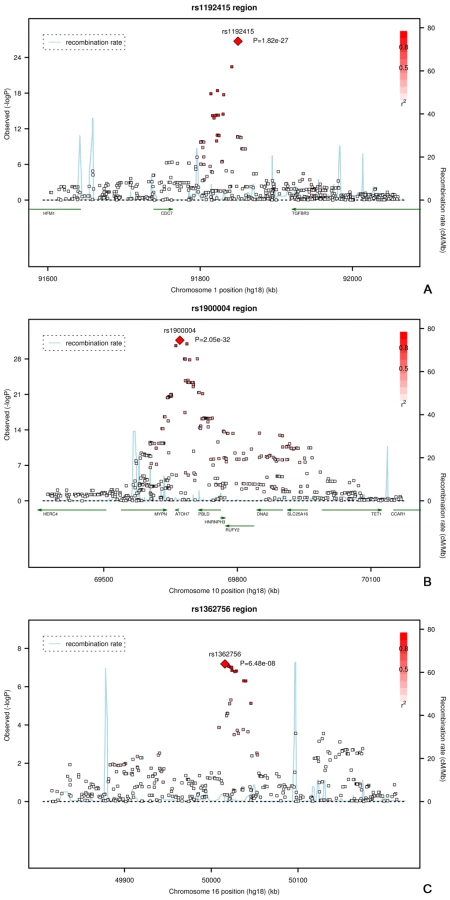
Figure 1A presents the −10log p-plot for the primary discovery cohort for optic disc area and shows two loci on chromosomes 1 and 10, including 192 SNPs that are beyond the genome-wide significance threshold of 5×10⁻⁸. Exclusion of OAG (N = 188) and myopia (N = 115) cases did not alter the results. Replication analyses in two independent cohorts of Dutch origin (RS-III and ERF study) showed that the findings from all cohorts were consistent in the direction of the effect with p-values ranging from 1.69×10⁻³ to 2.39×10⁻¹⁰ (Table 2). The combined analysis of the discovery and Dutch replication cohorts yielded an overall p-value 1.82×10⁻²⁷ for rs1192415 (optic disc area increased by 0.064±0.006 mm2 [beta ± standard error] when comparing those heterozygous with homozygous persons for the reference allele), and p-value 2.05×10⁻³² for rs1900004 (optic disc area decreased by 0.068±0.006 mm2). Table 2 shows the results of the top SNPs of all loci with p-values <10−6 observed in the meta-analysis. The meta-analysis of the four Dutch cohorts revealed a cluster of 10 SNPs on chromosome 16q12.1 showing borderline genome-wide significant evidence for association with the optic disc area (p = 6.48×10⁻⁸). When joining the Dutch data with the TwinsUK series (Table 3), this region became genome-wide significant (p = 5.07×10⁻⁹). Table 3 shows that also the chromosome 1 and 10 regions were also replicated consistently in the TwinsUK cohort.

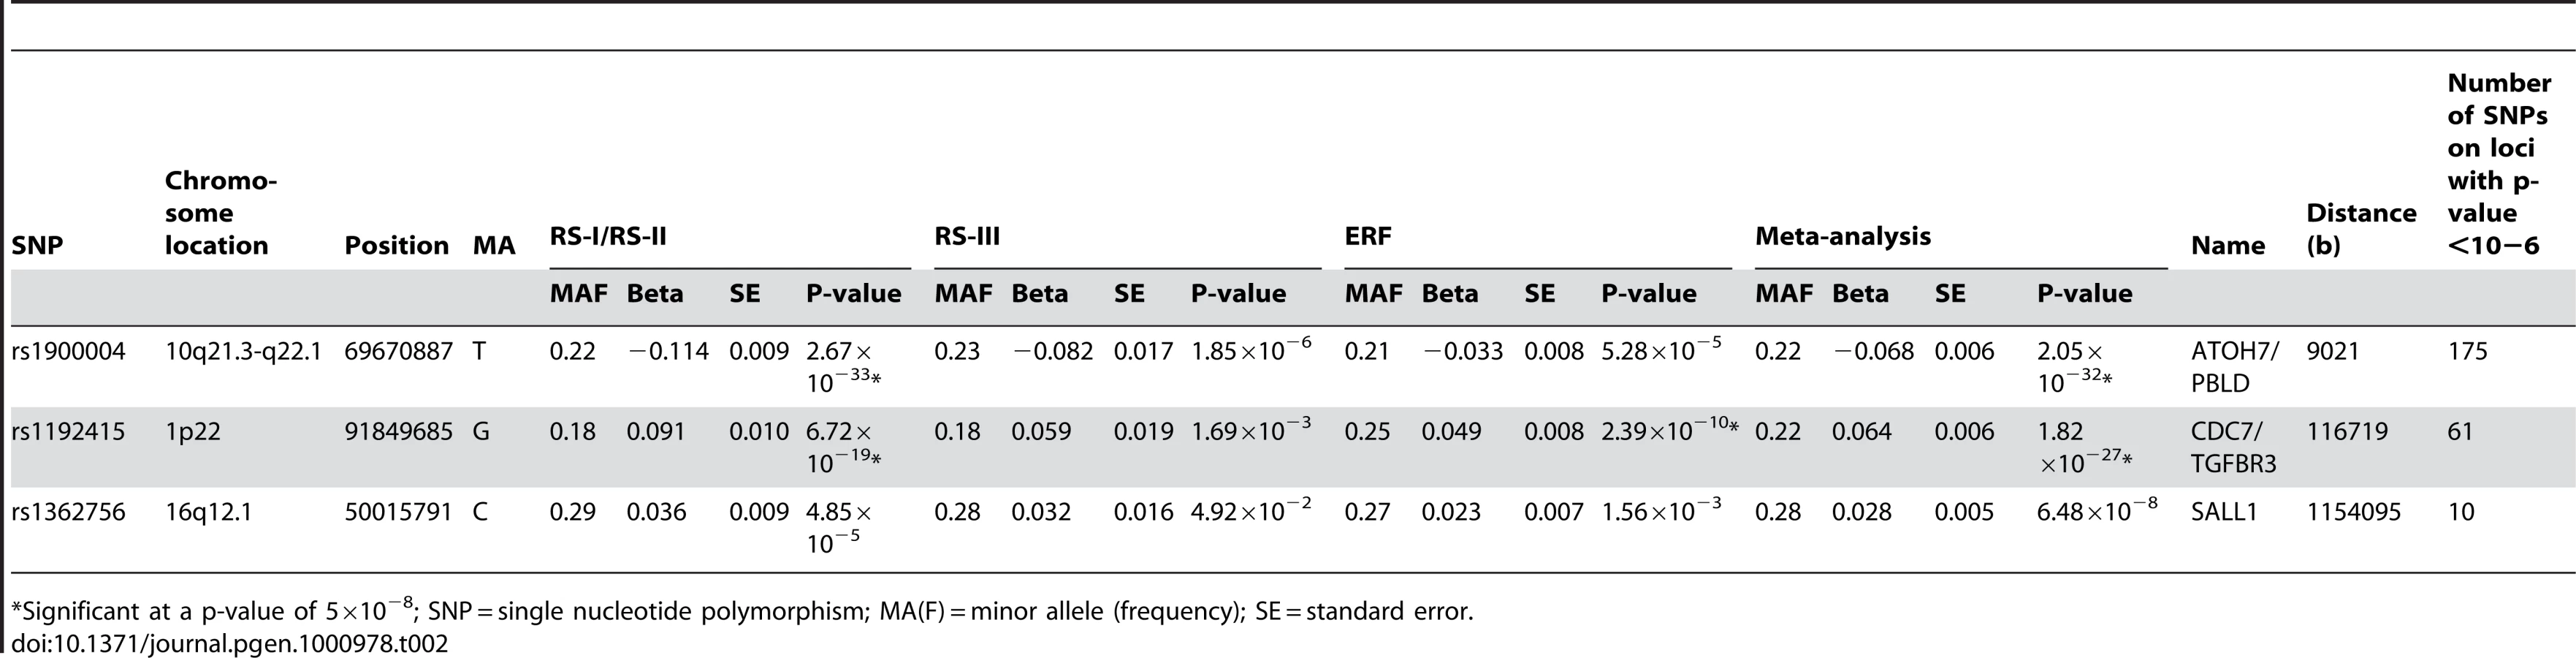

The regions of interest for optic disc area are shown in Figure 2. The first region on chromosome 1p22 is located between the cell division cycle 7 (CDC7) and the transforming growth factor beta receptor 3 (TGFBR3) gene, but the SNPs in the intergenic region were most significant. The genome-wide significant region on chromosome 10q21.3-q22.1 was quite large and included several genes. The region includes the Myopalladin (MYPN) gene, the heterogeneous nuclear ribonucleoprotein H3 (2H9) (HNRNPH3) gene, RUN and FYVE domain containing (RUFY2) gene, DNA replication helicase 2 homolog (yeast) (DNA2) gene, solute carrier family 25 (mitochondrial carrier; Graves disease autoantigen), member 16 (SLC25A16) gene. However, the most significant evidence was found in the region between the atonal homolog 7 (ATOH7) gene and the phenazine biosynthesis-like protein domain containing (PBLD) gene. The nearest gene in the third region on chromosome 16q12.1 was the sal-like 1 (SALL1) gene. Together, the three SNPs associated with optic disc area explained up to 2.7% of the variation in optic disc area.
Next, we evaluated the association of these loci with clinically relevant ophthalmic outcomes (myopia and OAG; Table S1). None of the optic disc area loci were associated with myopia-related outcomes (p-values ranging from 0.09 to 0.80). Of the three loci associated with optic disc area we found only the 10q21.3-q22.1 locus to be marginally associated with OAG (p = 0.04 for rs1900004).
Vertical cup-disc ratio
All analyses for VCDR were adjusted for optic disc area. Figure 1B presents the −10log p-plot for the discovery cohorts (meta-analyzed RS-I/RS-II GWAS) for VCDR and shows two loci reaching genome-wide significance at a threshold of 5×10⁻⁸. Adjustment for the intraocular pressure did not alter the results nor did exclusion of the OAG cases. The combined analysis of the discovery and two Dutch replication cohorts yielded an overall p-value of 1.96×10⁻¹⁴ for rs1063192 and 9.30×10⁻¹¹ for rs10483727 (Table 4). The regions of interest for VCDR are shown in Figure 3. The genome-wide significant region on chromosome 9 included two genes from the same gene family (cyclin-dependent kinase inhibitor 2A [CDKN2A] and CDKN2B). For chromosome 14, several genes were included in the region of interest. The strongest association was found for rs10483727 close to the sin oculis homeobox homolog 1 (SIX1) gene, but also several SNPs flanking SIX6 were genome-wide significant as well as one SNP between RNA-binding motif 8B (RBM8B) and the protein phosphatase 1A (PPM1A) gene. Furthermore, there were four other loci that showed consistent evidence for association and reached genome-wide significance in the combined analysis of all Dutch cohorts (Table 4). This included the chromosome 10q21.3-q22.1 region identified for the optic disc area (Table 2). For chromosome 11q13, the most significant SNPs were found in between the FERM domain containing 8 (FRMD8) and the SCY1-like (SCYL1) gene. The region of interest also harboured latent transforming growth factor beta binding protein 3 (LTBP3). The genome-wide significant SNPs of these three regions were all in the same linkage disequilibrium block, hampering determination of the most important variant (Figure 3). Of the other two genome-wide significant loci, the SNPs point to the doublecortin–like kinase 1 (DCLK1) for chromosome 13q13, and CHK2 checkpoint homolog (CHEK2) for chromosome 22q12.1 (Figure 3).


Finally, when combining all top SNPs from the joint analysis of the four Dutch cohorts with the TwinsUK, one additional borderline genome-wide significant region emerged as genome-wide significant. The region comprises 2 SNPs on chromosome 17q23 (p = 2.81×10⁻⁸; Table 5). The combined effect of the six loci associated with VCDR explained 2.2% of the variation in the VCDR. Also for the VCDR none of the loci were associated to myopia at p<0.05. When we evaluated the association to OAG, four of the loci associated with VCDR were also found to be marginally associated with OAG, 9q21 (p = 0.017), 14q22-23 (p = 0.021), 11q13 (p = 0.049), and the overlapping gene ATOH7 discussed earlier.

Discussion
In the present study we identified three genetic loci (10q21.3-q22.1, 1p22 and 16q12.1) associated with optic disc area, and six genetic loci (9q21, 14q22-23, 10q21.3-q22.1, 11q13, 13q13, and 22q12.1) associated with VCDR. Of these, one (10q21.3-q22.1) was associated with both quantitative traits. For these regions, the evidence for the association was genome-wide significant and our findings were consistently replicated in the independent replication cohorts. The SNPs in these loci were common variants with minor allele frequencies ranging from 0.21 to 0.46. The genome-wide significant SNPs of the present study were not in linkage disequilibrium with known missense mutations. The combined effect of the three SNPs involved in the optic disc area explained 2.7%, while the six loci associated with VCDR explained 2.2% of the variation.
The region with the strongest statistical evidence for association was a locus on chromosome 10q21.3-q22.1, which was associated with both optic disc area and VCDR, and included multiple genes. Although the genome-wide significant region is very large for the optic disc area analysis, the ATOH7 gene (also known as Math5) showed the most significant evidence for association with VCDR. This gene is expressed in the retina where it controls photoreceptor development [13]. In animal studies with mice, ATOH7 expression has been found in the developing optic nerve during embryogenesis [14]. During retinogenesis, seven different major classes of cells develop out of the progenitor cells in the eye: photoreceptors (rods and cones), bipolar cells, horizontal cells, amacrine cells, retinal ganglion cells (RGC; these are the cells involved in OAG) and Müller cells. Degeneration of these cells may lead to blindness [15]. In mutant mice and zebrafish without ATOH7, optic nerves and RGC are not further developed, while amacrine cells and cones are formed in excess [16], [17]. Overexpression of ATOH7 and interaction with the neuroD gene in chickens increases the amount of RGC and photoreceptors [18]. The duration of expression of ATOH7 is regulated by several proteins, including Growth and Differentiation Factor 11 (GDF11) [19]. Another factor involved in this genetic pathway is Sonic hedgehog (SHH), which mediates the direction of growth as the eye develops from the central part towards the periphery (including the optic nerve) [20]. Thus the SHH and GDF11 regulate ATOH7, which in turn regulates Brn3b. This gene may play a role in further differentiation of RGC and is expressed in post-mitotic RGC precursors. First, RGC differentiate into the lower retinal epithelium (later becoming the RGC layer). At the same time, the dendrites reach the bipolar, horizontal, and amacrine cells in the inner retinal plexiform layer, while their axons form the optic nerve, optic chiasm, superior colliculus and lateral geniculate nucleus [20]. Although ATOH7 has been implicated in retinal development in animals, this gene has not been linked to the development of the optic nerve pathology in humans. The analysis of VCDR showed that the ATOH7 (rs1900004) was also significantly associated with VCDR, independent of optic disc area. This suggests that this gene is involved in both the optic disc area as in VCDR.
The 1p22 region is second in terms of strength of association based on the p-values. This region includes the genes CDC7 and TGFBR3 associated with optic disc area. CDC7 encodes for a cell division cycle protein with kinase activity. Overexpression of this gene has been found in neoplastic transformations in some tumors. Although this region is associated with the optic disc area, the protein that CDC7 encodes for interacts with the CDKN2A protein associated with VCDR. However, also the TGFBR3 is of interest because of the interaction of ATOH7 with GDF11, a member of the bone morphogenetic protein (BMP) and the TGFbeta superfamily. The genes therefore point to the same signaling pathway. GDF11 interacts with the latent transforming growth factor beta binding protein 3 (LTBP3). In our analyses targeting VCDR, we found genome-wide significant evidence for a relation of LTBP3 to VCDR (see below). While CDKN2A is not known to be involved in TGFbeta signaling, CDKN2B has been implicated in this pathway. As in the VCDR analysis, the most significant SNPs on chromosome 9p21 were located within the CDKN2B gene. This gene (also known as p15Ink4b) lies adjacent to the tumor suppressor gene CDKN2A and encodes a cyclin-dependent kinase. The protein encoded by CDKN2B is thought to play a role in cell growth regulation and is induced by transforming growth factor beta (TGFB) [21]. The p15ink4b protein phosphorylates and inactivates the retinoblastoma tumor suppressor (pRb) protein [22]. Deletions of this gene and of the retinoblastoma 1 gene are often found in malignant gliomas and melanomas [23]. A recent study in mice found that p15Ink4b was ectopically expressed in both zinc finger E-box binding homeobox 1(Zeb1) mutant cells and neuroectodermally derived cells, including the developing retina, optic nerve and muscles surrounding the eye [24]. Taken together, our findings point to a central role of TGFbeta in the development of the optic disc and VCDR. TGFbeta is a multifunctional cytokine that modulates developmental and repair processes in several tissues. TGFbeta signaling has been implicated in a wide variety of diseases including inflammation, autoimmune disorders, fibrosis, cancer and cataracts. The region has recently also been associated with myocardial infarction and type 2 diabetes mellitus [25]. The CDKN2B/CDKN2A and CDC7/TGFBR3 loci influence the VCDR independently of optic disc area as these genes were not significantly associated with the optic disc area (p>0.05). However, TGFBR3 appears to be involved in VCDR through its role in optic disc area, as the effect of this gene on VCDR increased two fold when we did not adjust for optic disc area (RS-I: unadjusted beta = 0.015, standard error = 0.004, p = 2.45×10⁻⁵ compared to beta = 0.007, standard error = 0.003 in the adjusted analysis).
Regarding the optic disc area, we found one additional region genome-wide significantly associated when pooling the data of the Dutch and TwinUK. Although the chromosome 16q12.1 region concerns a gene desert, the closest gene in the third locus associated with optic disc area is SALL1. Defects in this gene are a cause of Townes-Brocks syndrome and the bronchio-oto-renal syndrome, two autosomal dominant disorders [26]. Only rare variants have been implicated in Townes-Brocks syndrome and bronchio-oto-renal syndrome, while the association we report here is with common variants. One of the traits involved in the latter syndrome is myopia [27]. However, in our analyses we could not find evidence for an association of the common SNPs in the SALL1 region to myopia (rs1362756; p = 0.802). SALL1 encodes a zinc finger transcriptional repressor. When considering the protein pathway, SALL1 interacts with SIX1 [28]. Rare variants in SIX1 are involved in the bronchio-oto-renal syndrome [29]. We found that common variants in SIX1 were genome-wide significantly associated with VCDR.
Regarding VCDR, chromosome 14q22-23 was genome-wide significant in the discovery cohorts and was replicated consistently in the other cohorts. The region includes two genes which are obvious candidates SIX1 and SIX6 (the latter also known as Optx2 and about 94kb distance from rs10483727). This gene is involved in eye development and has been related to congenital glaucoma. Defects in this gene have been associated with anophtalmia in mice [30] and in humans [31], [32]. Embryological studies have shown expression in the ventral optic stalk, which later becomes the optic nerve [33]. In the adult mouse retina, Optx2 mRNA has been found in cells within the ganglion cell layer and inner nuclear layer [34]. This gene is expressed in the developing retina, optic nerve and other brain structures [31].
There were three more genome-wide significant loci on chromosomes 11q13, 13q13 and 22q12.1 associated with VCDR (Table 2). On 11q13 most SNPs were found close to SCYL1, which has been associated with optic nerve atrophy in mice [35]. However, also the presence LTBP3 in this region is of interest, as this protein binds to TGFB1, TGFB2, and TGFB3, and is thus involved in the same signalling pathway as CDKN2B. LTBP3 is further of interest because of its homology to LTBP2, which has been implicated in primary congenital glaucoma [36], [37]. The DCLK1 gene on 13q13 is expressed in the optic tectum [38]. This is a probable kinase that may be involved in a calcium signaling pathway controlling neuronal migration in the developing and mature brain. Finally, the CHEK2 gene has been associated with several types of cancer, including breast cancer [39]. A literature search did not show a direct link between CHEK2 and the eye, however one study reported mapping of a locus on chromosome 22q12.1–q13.1 (OPA5) to autosomal dominant optic atrophy [40] and one case-report described an association of chromosome 22q11.2 deletion syndrome with optic disc swelling, which is probably caused by the resulting hypocalcaemia [41]. Regarding the association of CHEK2 with breast cancer, it is of interest that also one borderline significant SNP is located in a gene breast carcinoma amplified sequence 3 (BCAS3) involved in this pathway.
Although our study has convincingly identified SNPs involved in optic disc area and VCDR, there are also a number of limitations. At this point, we cannot pinpoint the two endophenotypes to a single clinical outcome. There was some marginal evidence suggesting that four of the genes involved in the development of the optic disc area and VCDR are relevant for OAG. However, the findings were far from genome-wide significance and remain to be confirmed. Another limitation concerns the differences in methodology. Two of the four replication cohorts, RS-III and ERF, used confocal scanning laser ophthalmoscopy to determine the optic disc area, while the other studies, RS-I, RS-II and TwinsUK, used digitized stereoscopic images. Although this may be considered a drawback, we do not think this distorted our results, since, several studies compared both methods and found high correlations for all stereometric parameters [42]–[44]. Moreover, since our findings replicated in all cohorts differences across measurements are probably small and unlikely to influence our results, beyond that the estimation of the effects (beta-coefficients) may differ across studies. Finally, the TwinsUK study served as a replication cohort in this study, but is also involved as a replication cohort for a GWAS based on a discovery cohort from Australia (Macgregor, et al. unpublished data). Both, Dutch and Australian cohorts independently implicated ATOH7 as playing a role in optic disc phenotypes and both utilize the TwinsUK data to replicate their findings. Although the association of ATOH7 was genome-wide significant in the Dutch validation cohorts, this overlap in replication samples should be taken into account.
In conclusion, by conducting GWA analyses, we found genome-wide significant evidence for the association of three genetic loci associated with optic disc area, and another six with VCDR. Although multiple genes were included in the regions of interest, the most interesting ones for optic disc area were TGFBR3 on chromosome 1p22, ATOH7 on chromosome 10q21.3-22.1 (also for VCDR) and SALL1 on chromosome 16q12. Regions of interest for VCDR were CDKN2B on chromosome 9p21, SIX1 on chromosome 14q22-23, SCYL1 on chromosome 11q13, CHEK2 on chromosome 22q12.1, DCLK1 on chromosome 13q13, and BCAS3 on chromosome 17q23. There are several pathways implicated but the most interesting is the TGFbeta signaling pathway that appears to play a key role. Further research is needed to implicate these finding to pathology of the eye.
Materials and Methods
Study populations
The Rotterdam Study I (RS-I) is a prospective population-based cohort study of 7,983 residents aged 55 years and older living in Ommoord, a suburb of Rotterdam, the Netherlands [45]. Baseline examinations for the ophthalmic part took place between 1991 and 1993; follow-up examinations were performed from 1997 to 1999 and from 2002 to 2006.
The RS-II and RS-III are two other prospective population-based cohort studies of 3,011 residents aged 55 years and older and 3,392 residents aged 45 years and older respectively. The rationale and study design are similar to those of the RS-I [45]. The baseline examinations of RS-II took place between 2000 and 2002; follow-up examinations were performed from 2004 to 2005. Baseline examinations of RS-III took place between 2006 and 2009.
The Erasmus Rucphen Family (ERF) Study is a family-based cohort in a genetically isolated population in the southwest of the Netherlands with over 3,000 participants aged between 18 and 86 years. Cross-sectional examination took place between 2002 and 2005. The rationale and study design of this study have been described elsewhere [46], [47]. All measurements in these studies were conducted after the Medical Ethics Committee of the Erasmus University had approved the study protocols and all participants had given a written informed consent in accordance with the Declaration of Helsinki.
Finally, the TwinsUK adult twin registry is a volunteer cohort of over 10,000 healthy twins based at St Thomas' Hospital in London. Participants were recruited and examined between 1998 and 2008. A total of 843 had complete data, all of whom were Caucasian. This cohort is predominantly female, as only 3% of included participants were male.
Ophthalmic examination
The ophthalmic assessment in RS-I and RS-II, both for baseline and follow-up, included a medical history, autorefraction, keratometry, visual field testing and optic nerve head imaging with Topcon ImageNet System of both eyes after mydriasis with topical tropicamide 0.5% and phenylephrine 2.5%. RS-III was similar to RS-I except for optic nerve head imaging with confocal scanning laser ophthalmoscopy (Heidelberg Retina Tomograph 2 [HRT]). The ophthalmic assessment in ERF included a medical history, autorefraction, keratometry and optic nerve head imaging with HRT of both eyes after pharmacologic mydriasis. In the TwinsUK optic disc parameters were measured from stereo disc photographs using the Nidek-3DX stereo camera, with digitized images scanned from Polaroid images and StereoDx stereoscopic planimetric software (StereoDx) using a Z-screen (StereoGraphics Corp) and software obtained from James Morgan from Cardiff University software, Wales, UK [48].
Optic nerve head assessment
ImageNet, which was used in RS-I and RS-II, takes simultaneous stereoscopic images of the optic disc at a fixed angle of 20°, using a simultaneous stereoscopic fundus camera (Topcon TRC-SS2; Tokyo Optical Co., Tokyo, Japan). Images were analyzed using the ImageNet retinal nerve fiber layer height module. On each stereoscopic pair of optic disc images four points were marked on the disc margin, defined as the inner border of the peripapillary ring or the outer border of the neural rim, if a scleral ring was visible. Next, the software drew an ellipse using these points to outline the disc margin and to determine the cup. The amount of correspondence between the marked points on the two images of the stereoscopic pair is expressed as a “bad points” percentage, which indicates the percentage of points lacking correspondence. This percentage can be used as an indicator of image quality. Images with 25% or more bad points were excluded [49].
HRT 2, used in RS-III and ERF, uses a focused 670-nm diode laser light beam to acquire scans of the optic nerve head region, using the confocal principle. The HRT obtains, during one scan, three series of 16 to 64 confocal frontal slices. From each of these series, a 3-dimensional image of the optic nerve head is reconstructed, from which the software calculates several optic disc parameters. To define the cup, the HRT places a reference plane 50 mm below the peripapillary retinal surface in the region of the papillomacular bundle.
Imaging was performed after entering the participant's keratometry data into the software and after adjusting the settings in accordance with the refractive error. In RS-III all HRT 2 data was converted to HRT 3. As an indicator of image quality we used the topographic standard deviation of the scan, which is a measure of the variability among the three series of a single HRT scan. Scans with a topographic standard deviation exceeding 50 mm were excluded. The inter-observer variability and agreement for both systems have been described elsewhere [44]. Details of the optic disc measurements in TwinsUK are described elsewhere [50].
Myopia and open-angle glaucoma assessment
Myopia was defined as a spherical equivalent of −6.00D or lower. For each eye the spherical equivalent was calculated using the standard formula: spherical equivalent = spherical component+(cylindrical value/2). The mean spherical equivalent of both eyes was included. Those eyes with a history of cataract surgery were excluded from this analysis.
OAG diagnosis was primarily based on glaucomatous visual field loss (VFL). The visual field of each eye was screened with a Humphrey Field Analyzer (HFA II 740; Zeiss, Oberkochen, Germany) using a 52-point threshold-related supra-threshold test that covered the central field with a radius of 24°. This test was modified from a standard 76-point screening test [51], [52]. VFL was defined as non-response in at least three contiguous test points (or four including the blind spot). If the first test was unreliable (>33% false-positive or false-negative catch trials) or a reliable test showed VFL in at least one eye, a second supra-threshold test was performed on that eye. If the second supra-threshold test was reliable and showed VFL, a full-threshold HFA 24-2 test (second follow-up) or Goldmann perimetry (Haag Streit, Bern, Switzerland; baseline and first follow-up) was performed on both eyes. The classification process of the Goldmann perimetry test results [51] and the full-threshold HFA 24-2 test results [Czudowska, et al. unpublished data] have been described before. In short, VFL was considered to be glaucomatous VFL only if reproducible and after excluding all other possible causes. For the present study, participants were considered as having glaucomatous VFL if they had glaucomatous VFL in at least one eye during either follow-up round. Cases had to have an open anterior chamber angle and no history or signs of angle closure or secondary glaucoma were allowed [52]. Criteria for glaucomatous optic neuropathy, such as VCDR, were not included in the criteria for OAG.
Genotyping
In the RS-I, RS-II and RS-III cohorts, DNA was genotyped by using the Illumina Infinium II HumanHap550chip v3.0 array according to the manufacturer's protocols. Details are described elsewhere [53]. After exclusion of participants for reasons of low-quality DNA, a total of 5,974 participants were available with genotyping data from RS-I, 2,157 participants from RS-II and 2,082 from RS-III. In ERF, DNA was genotyped on four different platforms (Illumina 6k, Illumina 318K, Illumina 370K and Affymetrix 250K), which were then merged. After exclusion of participants for whom genotyping data were unavailable, 2,385 had genotyping data. As we did not use the same microarray for the various study populations we imputed our genotype data using HapMap CEU as reference population, resulting in over 2.5 million SNPs. Extensive quality control analyses have been performed in each cohort. Finally, the genotyping of the TwinsUK cohort took place in stages; in the first stage participants were genotyped by using Illumina's HumanHap 300K duo chip, whereas in the second stage participants were genotyped with Illumina's HumanHap610 Quad.
Statistical analysis
Statistical analysis within studies
If we had data on both eyes then we chose a random eye. In cases of missing or unreliable baseline data on both eyes, we used follow-up data where available. Results from the RS-I and RS-II cohorts were combined, because both studies were identical in population structure. Within each study, linear regression models were used to examine the associations between SNPs and optic disc area adjusted for age and gender. The analyses of VCDR were further adjusted for optic disc area. Using these linear regression models, we calculated regression coefficients with corresponding 95% confidence intervals (CI). To adjust for multiple testing a p-value of 5×10⁻⁸ or less was considered statistically significant. As a secondary analysis we performed the analyses of VCDR with the same additive models but with further adjustment for intraocular pressure and its treatment.
All statistical analyses were performed using SPSS version 15.0.0 for Windows (SPSS inc., Chicago, IL, USA; 2006), MACH2 QTL as implemented in GRIMP [54] and R statistical package version 2.8.1 for Linux (www.r-project.org). For the analysis of the family based data we used the GenABEL package to adjust for relationships [55].
Meta-analysis
First, we replicated the top SNPs of the discovery cohorts in the two Dutch replication cohorts (RS-III and ERF). To adjust for familial relationships of participants in ERF we used the score test described by Chen and Abecasis which is implemented in the GenABEL package [56]. Meta-analyses were performed with Metal for Linux (www.sph.umich.edu/csg/abecasis/metal) to summarize the global effect through the four cohorts. To obtain optimal and unbiased results we used genomic control and the inverse variance method of each effect size estimate [57]. This was only done for the SNPs that were genotyped or imputed in all four cohorts. SNPs which deviated significantly from Hardy-Weinberg equilibrium (p<0.0001) or if they had a minor allele frequency <0.05 were excluded in the present study. Next, we replicated all top SNPs from the joint analysis of the four Dutch cohorts in a combined analysis with the TwinsUK.
Finally, we tested in RS-I whether the identified loci were associated with other ophthalmic traits such as myopia by using the spherical equivalent of the refractive error, and OAG based on optic nerve head appearance and glaucomatous visual field loss. This was done by using logistic regression analyses adjusted for age and gender.
Supporting Information
Zdroje
1. NangiaV
MatinA
BhojwaniK
KulkarniM
YadavM
2008 Optic disc size in a population-based study in central India: the Central India Eye and Medical Study (CIEMS). Acta Ophthalmol 86 103 104
2. HealeyPR
MitchellP
1999 Optic disk size in open-angle glaucoma: the Blue Mountains Eye Study. Am J Ophthalmol 128 515 517
3. BellezzaAJ
HartRT
BurgoyneCF
2000 The optic nerve head as a biomechanical structure: initial finite element modeling. Invest Ophthalmol Vis Sci 41 2991 3000
4. HoffmannEM
ZangwillLM
CrowstonJG
WeinrebRN
2007 Optic disk size and glaucoma. Surv Ophthalmol 52 32 49
5. KwonYH
FingertJH
KuehnMH
AlwardWL
2009 Primary open-angle glaucoma. N Engl J Med 360 1113 1124
6. QuigleyHA
1993 Open-angle glaucoma. N Engl J Med 328 1097 1106
7. KeltnerJL
JohnsonCA
AndersonDR
LevineRA
FanJ
2006 The association between glaucomatous visual fields and optic nerve head features in the Ocular Hypertension Treatment Study. Ophthalmology 113 1603 1612
8. MigliorS
PfeifferN
TorriV
ZeyenT
Cunha-VazJ
2007 Predictive factors for open-angle glaucoma among patients with ocular hypertension in the European Glaucoma Prevention Study. Ophthalmology 114 3 9
9. KleinBE
KleinR
LeeKE
2004 Heritability of risk factors for primary open-angle glaucoma: the Beaver Dam Eye Study. Invest Ophthalmol Vis Sci 45 59 62
10. van KoolwijkLM
DesprietDD
van DuijnCM
Pardo CortesLM
VingerlingJR
2007 Genetic contributions to glaucoma: heritability of intraocular pressure, retinal nerve fiber layer thickness, and optic disc morphology. Invest Ophthalmol Vis Sci 48 3669 3676
11. ChangTC
CongdonNG
WojciechowskiR
MunozB
GilbertD
2005 Determinants and heritability of intraocular pressure and cup-to-disc ratio in a defined older population. Ophthalmology 112 1186 1191
12. SchwartzJT
ReulingFH
FeinleibM
1975 Size of the physiologic cup of the optic nerve head. hereditary and environmental factors. Arch Ophthalmol 93 776 778
13. BrownNL
DagenaisSL
ChenCM
GlaserT
2002 Molecular characterization and mapping of ATOH7, a human atonal homolog with a predicted role in retinal ganglion cell development. Mamm Genome 13 95 101
14. BrownNL
KanekarS
VetterML
TuckerPK
GemzaDL
1998 Math5 encodes a murine basic helix-loop-helix transcription factor expressed during early stages of retinal neurogenesis. Development 125 4821 4833
15. QiuF
JiangH
XiangM
2008 A comprehensive negative regulatory program controlled by Brn3b to ensure ganglion cell specification from multipotential retinal precursors. J Neurosci 28 3392 3403
16. BrownNL
PatelS
BrzezinskiJ
GlaserT
2001 Math5 is required for retinal ganglion cell and optic nerve formation. Development 128 2497 2508
17. WangY
XuL
ZhangL
YangH
MaY
2006 Optic disc size in a population based study in northern China: the Beijing Eye Study. Br J Ophthalmol 90 353 356
18. MaW
YanRT
XieW
WangSZ
2004 A role of ath5 in inducing neuroD and the photoreceptor pathway. J Neurosci 24 7150 7158
19. KimJ
WuHH
LanderAD
LyonsKM
MatzukMM
2005 GDF11 controls the timing of progenitor cell competence in developing retina. Science 308 1927 1930
20. MuX
BeremandPD
ZhaoS
PershadR
SunH
2004 Discrete gene sets depend on POU domain transcription factor Brn3b/Brn-3.2/POU4f2 for their expression in the mouse embryonic retina. Development 131 1197 1210
21. HannonGJ
BeachD
1994 p15INK4B is a potential effector of TGF-beta-induced cell cycle arrest. Nature 371 257 261
22. DrexlerHG
1998 Review of alterations of the cyclin-dependent kinase inhibitor INK4 family genes p15, p16, p18 and p19 in human leukemia-lymphoma cells. Leukemia 12 845 859
23. MatsumuraY
NishigoriC
YagiT
ImamuraS
TakebeH
1998 Mutations of p16 and p15 tumor suppressor genes and replication errors contribute independently to the pathogenesis of sporadic malignant melanoma. Arch Dermatol Res 290 175 180
24. LiuY
El-NaggarS
DarlingDS
HigashiY
DeanDC
2008 Zeb1 links epithelial-mesenchymal transition and cellular senescence. Development 135 579 588
25. ZegginiE
WeedonMN
LindgrenCM
FraylingTM
ElliottKS
2007 Replication of genome-wide association signals in UK samples reveals risk loci for type 2 diabetes. Science 316 1336 1341
26. EngelsS
KohlhaseJ
McGaughranJ
2000 A SALL1 mutation causes a branchio-oto-renal syndrome-like phenotype. J Med Genet 37 458 460
27. OlavarrietaL
Morales-AnguloC
del CastilloI
MorenoF
Moreno-PelayoMA
2008 Stickler and branchio-oto-renal syndromes in a patient with mutations in EYA1 and COL2A1 genes. Clin Genet 73 262 267
28. ChaiL
YangJ
DiC
CuiW
KawakamiK
2006 Transcriptional activation of the SALL1 by the human SIX1 homeodomain during kidney development. J Biol Chem 281 18918 18926
29. KochharA
OrtenDJ
SorensenJL
FischerSM
CremersCW
2008 SIX1 mutation screening in 247 branchio-oto-renal syndrome families: a recurrent missense mutation associated with BOR. Hum Mutat 29 565
30. LiX
PerissiV
LiuF
RoseDW
RosenfeldMG
2002 Tissue-specific regulation of retinal and pituitary precursor cell proliferation. Science 297 1180 1183
31. GallardoME
Lopez-RiosJ
Fernaud-EspinosaI
GranadinoB
SanzR
1999 Genomic cloning and characterization of the human homeobox gene SIX6 reveals a cluster of SIX genes in chromosome 14 and associates SIX6 hemizygosity with bilateral anophthalmia and pituitary anomalies. Genomics 61 82 91
32. NolenLD
AmorD
HaywoodA
St HeapsL
WillcockC
2006 Deletion at 14q22-23 indicates a contiguous gene syndrome comprising anophthalmia, pituitary hypoplasia, and ear anomalies. Am J Med Genet A 140 1711 1718
33. JeanD
BernierG
GrussP
1999 Six6 (Optx2) is a novel murine Six3-related homeobox gene that demarcates the presumptive pituitary/hypothalamic axis and the ventral optic stalk. Mech Dev 84 31 40
34. ToyJ
SundinOH
1999 Expression of the optx2 homeobox gene during mouse development. Mech Dev 83 183 186
35. SchmidtWM
KrausC
HogerH
HochmeisterS
OberndorferF
2007 Mutation in the Scyl1 gene encoding amino-terminal kinase-like protein causes a recessive form of spinocerebellar neurodegeneration. EMBO Rep 8 691 697
36. AliM
McKibbinM
BoothA
ParryDA
JainP
2009 Null mutations in LTBP2 cause primary congenital glaucoma. Am J Hum Genet 84 664 671
37. Narooie-NejadM
PaylakhiSH
ShojaeeS
FazlaliZ
Rezaei KanaviM
2009 Loss of function mutations in the gene encoding latent transforming growth factor beta binding protein 2, LTBP2, cause primary congenital glaucoma. Hum Mol Genet 18 3969 3977
38. Capes-DavisA
TolhurstO
DunnJM
JeffreyPL
2005 Expression of doublecortin (DCX) and doublecortin-like kinase (DCLK) within the developing chick brain. Dev Dyn 232 457 467
39. Meijers-HeijboerH
van den OuwelandA
KlijnJ
WasielewskiM
de SnooA
2002 Low-penetrance susceptibility to breast cancer due to CHEK2(*)1100delC in noncarriers of BRCA1 or BRCA2 mutations. Nat Genet 31 55 59
40. BarbetF
HakikiS
OrssaudC
GerberS
PerraultI
2005 A third locus for dominant optic atrophy on chromosome 22q. J Med Genet 42 e1
41. GirgisRA
McKeeHD
InnesJR
2004 Swollen optic discs in a patient with the chromosome 22q11.2 deletion syndrome. Br J Ophthalmol 88 591 592
42. Azuara-BlancoA
HarrisA
CantorLB
1998 Reproducibility of optic disk topographic measurements with the Topcon ImageNet and the Heidelberg Retina Tomograph. Ophthalmologica 212 95 98
43. Azuara-BlancoA
SpaethGL
NichollJ
LanzlIM
AugsburgerJJ
1999 Comparison between laser scanning tomography and computerised image analysis of the optic disc. Br J Ophthalmol 83 295 298
44. IkramMK
BorgerPH
AssinkJJ
JonasJB
HofmanA
2002 Comparing ophthalmoscopy, slide viewing, and semiautomated systems in optic disc morphometry. Ophthalmology 109 486 493
45. HofmanA
BretelerMM
van DuijnCM
KrestinGP
PolsHA
2007 The Rotterdam Study: objectives and design update. Eur J Epidemiol 22 819 829
46. AulchenkoYS
HeutinkP
MackayI
Bertoli-AvellaAM
PullenJ
2004 Linkage disequilibrium in young genetically isolated Dutch population. Eur J Hum Genet 12 527 534
47. PardoLM
MacKayI
OostraB
van DuijnCM
AulchenkoYS
2005 The effect of genetic drift in a young genetically isolated population. Ann Hum Genet 69 288 295
48. MorganJE
SheenNJ
NorthRV
ChoongY
AnsariE
2005 Digital imaging of the optic nerve head: monoscopic and stereoscopic analysis. Br J Ophthalmol 89 879 884
49. RolandoM
IesterM
CampagnaP
BorgiaL
TraversoC
1994 Measurement variability in digital analysis of optic discs. Doc Ophthalmol 85 211 222
50. HealeyP
CarbonaroF
TaylorB
SpectorTD
MitchellP
2008 The heritability of optic disc parameters: a classic twin study. Invest Ophthalmol Vis Sci 49 77 80
51. Skenduli-BalaE
de VoogdS
WolfsRC
van LeeuwenR
IkramMK
2005 Causes of incident visual field loss in a general elderly population: the Rotterdam study. Arch Ophthalmol 123 233 238
52. WolfsRC
BorgerPH
RamrattanRS
KlaverCC
HulsmanCA
2000 Changing views on open-angle glaucoma: definitions and prevalences–The Rotterdam Study. Invest Ophthalmol Vis Sci 41 3309 3321
53. RivadeneiraF
StyrkarsdottirU
EstradaK
HalldorssonBV
HsuYH
2009 Twenty bone-mineral-density loci identified by large-scale meta-analysis of genome-wide association studies. Nat Genet
54. EstradaK
AbuseirisA
GrosveldFG
UitterlindenAG
KnochTA
2009 GRIMP: a web - and grid-based tool for high-speed analysis of large-scale genome-wide association using imputed data. Bioinformatics 25 2750 2752
55. AulchenkoYS
RipkeS
IsaacsA
van DuijnCM
2007 GenABEL: an R library for genome-wide association analysis. Bioinformatics 23 1294 1296
56. ChenWM
AbecasisGR
2007 Family-based association tests for genomewide association scans. Am J Hum Genet 81 913 926
57. Sanchez-MecaJ
Marin-MartinezF
1998 Weighting by Inverse Variance or by Sample Size in Meta-Analysis: A Simulation Study. Educ Psychol Meas 58 211 220
Štítky
Genetika Reprodukční medicínaČlánek vyšel v časopise
PLOS Genetics
2010 Číslo 6
Nejčtenější v tomto čísle
- Web-Based, Participant-Driven Studies Yield Novel Genetic Associations for Common Traits
- The IG-DMR and the -DMR at Human Chromosome 14q32.2: Hierarchical Interaction and Distinct Functional Properties as Imprinting Control Centers
- Cushing's Syndrome and Fetal Features Resurgence in Adrenal Cortex–Specific Knockout Mice
- Amplification of a Cytochrome P450 Gene Is Associated with Resistance to Neonicotinoid Insecticides in the Aphid