
Chromosome 4 Replicates in Two Phases That Correlate with Chromatin State
DNA replication programs have been studied extensively in yeast and animal systems, where they have been shown to correlate with gene expression and certain epigenetic modifications. Despite the conservation of core DNA replication proteins, little is known about replication programs in plants. We used flow cytometry and tiling microarrays to profile DNA replication of Arabidopsis thaliana chromosome 4 (chr4) during early, mid, and late S phase. Replication profiles for early and mid S phase were similar and encompassed the majority of the euchromatin. Late S phase exhibited a distinctly different profile that includes the remaining euchromatin and essentially all of the heterochromatin. Termination zones were consistent between experiments, allowing us to define 163 putative replicons on chr4 that clustered into larger domains of predominately early or late replication. Early-replicating sequences, especially the initiation zones of early replicons, displayed a pattern of epigenetic modifications specifying an open chromatin conformation. Late replicons, and the termination zones of early replicons, showed an opposite pattern. Histone H3 acetylated on lysine 56 (H3K56ac) was enriched in early replicons, as well as the initiation zones of both early and late replicons. H3K56ac was also associated with expressed genes, but this effect was local whereas replication time correlated with H3K56ac over broad regions. The similarity of the replication profiles for early and mid S phase cells indicates that replication origin activation in euchromatin is stochastic. Replicon organization in Arabidopsis is strongly influenced by epigenetic modifications to histones and DNA. The domain organization of Arabidopsis is more similar to that in Drosophila than that in mammals, which may reflect genome size and complexity. The distinct patterns of association of H3K56ac with gene expression and early replication provide evidence that H3K56ac may be associated with initiation zones and replication origins.
Published in the journal:
. PLoS Genet 6(6): e32767. doi:10.1371/journal.pgen.1000982
Category:
Research Article
doi:
https://doi.org/10.1371/journal.pgen.1000982
Summary
DNA replication programs have been studied extensively in yeast and animal systems, where they have been shown to correlate with gene expression and certain epigenetic modifications. Despite the conservation of core DNA replication proteins, little is known about replication programs in plants. We used flow cytometry and tiling microarrays to profile DNA replication of Arabidopsis thaliana chromosome 4 (chr4) during early, mid, and late S phase. Replication profiles for early and mid S phase were similar and encompassed the majority of the euchromatin. Late S phase exhibited a distinctly different profile that includes the remaining euchromatin and essentially all of the heterochromatin. Termination zones were consistent between experiments, allowing us to define 163 putative replicons on chr4 that clustered into larger domains of predominately early or late replication. Early-replicating sequences, especially the initiation zones of early replicons, displayed a pattern of epigenetic modifications specifying an open chromatin conformation. Late replicons, and the termination zones of early replicons, showed an opposite pattern. Histone H3 acetylated on lysine 56 (H3K56ac) was enriched in early replicons, as well as the initiation zones of both early and late replicons. H3K56ac was also associated with expressed genes, but this effect was local whereas replication time correlated with H3K56ac over broad regions. The similarity of the replication profiles for early and mid S phase cells indicates that replication origin activation in euchromatin is stochastic. Replicon organization in Arabidopsis is strongly influenced by epigenetic modifications to histones and DNA. The domain organization of Arabidopsis is more similar to that in Drosophila than that in mammals, which may reflect genome size and complexity. The distinct patterns of association of H3K56ac with gene expression and early replication provide evidence that H3K56ac may be associated with initiation zones and replication origins.
Introduction
DNA replication is a fundamental process required for the growth and development of all eukaryotes. This process is regulated both spatially and temporally so that all DNA sequences are replicated exactly once during S phase, insuring that each daughter cell receives a complete copy of the genome. DNA replication initiates from discrete locations on chromosomes known as replication origins (origins) where proteins required for DNA synthesis are recruited by the origin recognition complex (ORC). Once initiated, DNA replication proceeds by elongation to regions where opposing replication forks converge (termination zones). This organization of DNA sequences into regions of initiation, elongation and termination define a replicon – a segment of DNA replicated as a unit by replication forks originating from a single origin [1]–[5]. The time of replication for any particular DNA sequence within a replicon is determined by three factors: its proximity to an origin, the efficiency of initiation at that origin, and the rate of DNA elongation in that region.
The pattern of DNA replication has been determined for multiple eukaryotic genomes ranging from the compact genome of budding yeast to the moderately sized genome of Drosophila melanogaster and the large human and mouse genomes [6]–[14]. In budding yeast, DNA sequences acting as origins have a conserved consensus motif, and origin activation appears to follow a strict temporal program [6]. However, recent single molecule studies of DNA replication in yeast [15], [16] suggest that the temporal program likely represents the average replication program for a population of cells, with considerable variation in the order of origin activation in individual cells [17]–[20]. In higher eukaryotes, no consensus sequence for origin DNA has been identified, and some known origins are organized as broad initiation zones containing multiple potential origins [2]–[4]. It is unclear whether origin activation follows a temporal sequence in higher eukaryotes, but origin activation in Drosophila is most prevalent in early and late S phase, suggesting some degree of temporal regulation [14]. In mammals, clusters of replicons frequently display coordinate origin activation and are organized into larger replication domains [1], [5], [21]. The organization of replication domains appears to be cell type specific, as differentiation of embryonic stem cell lines to neural precursor cells resulted in the widespread reorganization of replication domains [13]. Differences in replication patterns between cell types have been linked to changes in gene expression and epigenetic modifications [13], [14].
The relationship between gene expression and replication time has been examined in yeast, Drosophila, mouse and human cells. In budding yeast, there is little correlation between replication time and gene expression [6]. In higher eukaryotes with more complex genomes, there is a positive correlation between early replication and gene expression, and this correlation is strongest when integrated over large chromosomal domains [7], [8], [10]–[14], [22], [23]. The fact that an open chromatin conformation is necessary but not sufficient for both DNA replication and gene expression may underlie the correlation between these processes [2]–[4], [11], [21], [24].
In general, euchromatin replicates early in S phase and heterochromatin replicates late, although specific types of heterochromatin replicate in early S phase in yeast [6], [8], [21], [25], [26]. Chromatin is subject to a plethora of epigenetic modifications including histone methylation, histone acetylation and DNA cytosine methylation (5mC). The combinatorial effect of these modifications, as well as the association of other chromatin-binding proteins, determines whether DNA adopts a heterochromatic or euchromatic conformation [27]–[29]. Epigenetic modifications associated with heterochromatin and characteristic of silenced genes and transposable elements include tri - and dimethylation of histone H3 lysine 9 (H3K9me), hypoacetylation of histones, and abundant 5mC [27]–[34]. There are conflicting reports for the correlation between heterochromatic marks and late replication, which is surprising given the tight relationship between late replication and heterochromatin [12], [13], [35]. Modifications associated with euchromatin and active or potentially active genes include tri-, di - and monomethylation of histone H3 lysine 4 (H3K4me), hyperacetylation of histones, and 5mC localized to gene coding sequences [27]–[30], [32]–[34], [36]–[38]. Several replication timing studies showed a positive correlation of early replication with H3K4me [12], [13], [35], which may be indirect because H3K4me is associated almost exclusively with genes and gene-rich regions which tend to replicate early [7], [8], [11].
Several lines of evidence suggest that the link between histone acetylation and replication time is more direct. Hyperacetylaton of histone H3 on lysines 9 and 14 (H3K9/14ac) associates with origins in human cells [39]. Hyperacetylation of histone H3 lysine 56 (H3K56ac) associates with early firing origins in budding yeast [40]. Hyperacetylation of histone H4 lysine 16 (H4K16ac) associates with early replicating regions in Drosophila cells [14]. In addition, late-firing origins in budding yeast are regulated by a histone deacetylase complex [41]. These and other experiments suggest that histone acetylation may be the best epigenetic determinant of replication time [24], [42]–[44].
Very little is known about the regulation of DNA replication in plants [45]. The core proteins required for DNA replication are conserved between yeast, plants and animals [46], [47]. The replication machinery of plants is more similar to animals than yeast, but many of the genes encoding these proteins have multiple homologs in Arabidopsis thaliana suggesting that functional diversification has occurred [47]. DNA fiber autoradiography studies revealed that Arabidopsis possesses two families of replicons, one initiating replication early and the other later in S phase [48]. These likely correspond to euchromatic and heterochromatic replicons because, like most eukaryotes, plants replicate heterochromatin later than euchromatin [25].
In contrast, knowledge of epigenetic modifications in Arabidopsis has kept pace with other systems, and with few exceptions, these modifications are functionally conserved between plants and animals [28], [29], [49]. The relationship between epigenetic modifications and DNA replication in plants is virtually unexplored. However, DNA replication is required to maintain the repressed state of a negative regulator of flowering in Arabidopsis [50], suggesting that the interplay of these processes is crucial for plant growth and development. Similar to the replication machinery, the genes encoding DNA and histone modifying enzymes often have multiple homologs in plants [51]–[53].
Arabidopsis with its small, well-characterized genome is an excellent model system for examining the global relationship between DNA replication and chromatin state in higher eukaryotes. The genome of Arabidopsis is gene-dense in comparison to mammalian genomes, with roughly the same number of genes encoded by a genome one-twentieth the size [54]–[56]. The genome size of Drosophila is similar but encodes half the number of genes [57]. This characteristic of Arabidopsis may provide insight into the influence of gene density on DNA replication. In addition, analysis of Arabidopsis DNA replication has the potential to uncover features that are unique to plants. The diversification of genes encoding replication-associated proteins and chromatin modifiers suggests that plants may have developed unique mechanisms to regulate DNA replication and to establish and maintain chromatin states. These mechanisms may be related to developmental pathways that are common in plants but rare in other systems. For example, endoreduplication plays a prominent role in plant development and totipotency of plant cells is not limited to germline or embryonic cells. We used a combination of fluoresence-activated cell sorting (FACS) and genomic tiling arrays to profile DNA replication of Arabidopsis chr4 in early, mid and late S phase cells. We investigated the relationship between DNA replication, gene expression and chromatin state in analyses of our data and the extensive genomic data available for Arabidopsis chr4.
Results
S phase replication profiles
We used an established Arabidopsis Col-0 suspension cell line for the analysis of replication time and optimized the culture conditions to provide ample nuclei from replicating cells for fractionation by FACS (Figure S1 and Text S1). This cell line was also used in recent studies that examined the effects of cell culture on specific epigenetic modifications [34]. We first characterized the relationship between DNA content and replication in this cell line by monitoring the incorporation of the nucleotide analog bromodeoxyuridine (BrdU). An asynchronous population of cells was labeled with BrdU for 1 hour and fixed. Nuclei were isolated, stained with propidium iodide, labeled with a fluorescent anti-BrdU antibody, and analyzed by FACS for DNA content and BrdU incorporation. Nuclei in S phase that incorporated BrdU appeared as a distinct “arc” above the population of cells in G1 and G2/M (Figure 1A). Surprisingly, almost 30% of the S phase nuclei fractionated above the G1 peak, and we designated this population early S phase (Figure 1A and Table S1). Similarly, we designated the 50% of the S phase nuclei that fractionated above the G2/M peak as late S phase. The remaining 20% of S phase nuclei between the G1 and G2/M peaks were designated mid S phase. We estimated the DNA content of the early, mid and late S phase populations at 1.16, 1.49 and 1.95C, respectively (Figure 1B). This distribution of S phase nuclei and DNA content indicated that to get a complete picture of DNA replication during S phase we needed to analyze DNA replication in nuclei that co-sorted with G1 (early S phase) and G2/M (late S phase) peaks.

We profiled DNA replication independently in early, mid and late S phase. We could not sort the early, mid and late S phase nuclei based on BrdU content because visualization of the BrdU degrades DNA. Instead, nuclei were sorted based on DNA content, and BrdU-labeled DNA was separated by immunoprecipitation (Figure 1C). Nuclei in the early S/G1, mid S and late S/G2/M sorts contained different fractions of nuclei in S phase, with the early S/G1, mid S and late S/G2/M sorts containing 4.2, 42.3 and 18.3% BrdU-positive nuclei, respectively (Figure 1A and Table S1). Because of these differences, it was necessary to account for cross contamination associated with sorting (Figure S2A), especially contamination of mid S phase nuclei into the early S/G1 sort (Table S2 and Figure S2B). When corrected for the percentage of nuclei in S phase, we determined that the early, mid and late S phase purity was 69, 94 and 85% respectively (Table S2). In the worst case, 28% of S phase nuclei in the early S/G1 sort were actually in mid S phase (Table S2 and Figure S2B). However, this contaminating population had a DNA content from the lower tail of the mid S phase distribution (Figure S2B).
BrdU-labeled DNA from early, mid or late S phase nuclei was hybridized separately to a tiling microarray that covers 99% of the sequenced regions of chr4 of Arabidopsis thaliana with 22,761 PCR-generated probes averaging 1 kb in length [33]. This array was used previously to profile specific epigenetic modifications in this cell line [34]. Microarray results were confirmed by qPCR analysis of 14 selected regions (Tables S3 and S4, Figure S3 and Text S1).
Figure 2 shows a schematic representation of chr4 including plots for gene and transposable element (TE) coverage (Figure 2A) and GC content (Figure 2B). Chr4 is unusual in that it has three regions of constitutive heterochromatin – the nucleolar organizing region (NOR) at the end of the short arm (not shown), a 700 kb heterochromatic knob centered at 2 Mb, and 2.5 Mb of pericentromeric heterochromatin centered at 4 Mb (Figure 2C) [58], [59]. These heterochromatic regions were used as boundaries to subdivide chr4 into six regions for subsequent analyses – the distal short arm, the heterochromatic knob, the proximal short arm, the pericentromere, the proximal long arm and the distal long arm (Figure 2C). The boundaries of most of these regions are evident from gene and transposable element (TE) coverage and to some extent from the GC content profile (Figure 2A and 2B). The boundary between the proximal and distal long arms is less evident and was chosen based on the replication time results presented below.

The replication profiles were generated from the microarray data by applying a loess algorithm in a 150-kb window to smooth the probe-level data (Figure 2D). The early and late profiles display remarkable complementarity (R = −0.83), i.e. regions of chr4 enriched for BrdU in early S phase cells are depleted in late S phase cells. Early replication is most prevalent in the distal long arm, a euchromatic region rich in genes with few TEs. Late replication predominates in the heterochromatic knob and pericentromere of chr4, but regions of late replication are also dispersed in other parts of chr4, most notably the proximal long and short arms.
The replication profiles for early and mid S phase cells are surprisingly similar (R = 0.87) (Figure 2D). The most evident difference is a broadening and merging of early replicating regions in the mid S phase profile. The DNA replicating in mid S phase represents nearly the same population of sequences as that replicating in early S phase even though FACS analysis demonstrates that the early and mid S phase nuclei have notably different DNA content (Figure 1, Figure S2 and Tables S1 and S2). Like early S phase, the mid S phase profile is distinct from the late profile (R = −0.85). The similarity of the early and mid S phase profiles is not consistent with a fixed order of origin activation and, instead, suggests that origin activation in early and mid S phase is stochastic. Together, the early, mid and late S phase profiles suggest that DNA replication in Arabidopsis cells is biphasic, a result consistent with a previous report that Arabidopsis DNA replication takes place in two distinct stages [48].
Segmentation of replication profiles
To facilitate further analyses, we performed a two-step segmentation of the early, mid and late S phase profiles to assign a replication time for each microarray probe. Figure 3 illustrates this process for two chr4 regions representative of early and late replicating regions. In the first step, we identified contiguous segments of probes showing coordinate replication times (log2 ratio >0) within each smoothed profile, thereby defining segments of early, mid or late replicating DNA (Figure 3C and 3D). In the next step, we reconciled the replication times between experiments by determining the regions of overlap between the early, mid and late segments (Figure 3D). This analysis identified segments of DNA replicating only in early S phase (E), in both early and mid S phase (EM), only in mid S phase (M), in both mid and late S phase (ML), only in late S phase (L), in early and late S phase (EL), throughout S phase (EML), and segments of indeterminate replication time (I) that did not show enrichment in any experiment (Table S5).

The majority of chr4 replicates as either EM (37%) or L (44%) when segment length is taken into account (Figure 4A). Only 4% of chr4 replicates exclusively in mid S phase (M), while 6% replicates as ML and 6% replicates as EML. The positions of these segment types with respect to EM and L segments suggest that many of the M, ML and EML segments are regions of DNA elongation between EM segments or transition zones between early to late replication (Figure 3). In regions of predominately late replication, M, ML and EML segments are often located between larger flanking L segments (Figure 3), suggesting that they contain the DNA replication origins for the flanking regions. The EL segments comprise only 2% of chr4 and are enriched for repetitive sequences (Table S6). Thus, at least some EL segments are likely to be artifacts created by cross hybridization on the microarray. I segments, which comprise 2% of chr4, also have an elevated repeat content (Table S6). Another possible explanation for EL and I segments is that replication time in these regions is driven by allele-specific gene expression and/or epigenetic modifications (see below) [12], [60].

We also determined the replication times of the six chr4 regions defined in Figure 2. The heterochromatic knob and pericentromere replicate almost exclusively as L segments while the gene-rich distal long arm replicates predominately as EM segments (Figure 4A). The replication time of the distal short and proximal short regions is more complex, perhaps influenced by the flanking heterochromatic regions (Figure 2). The proximal long arm displays a surprising amount of late replication despite the fact that this region is not constitutive heterochromatin [59], although it does have lower gene and higher TE content than the distal long region (Figure 2).
Identification of initiation and termination zones and replicon boundaries
Within a given replicon, the DNA closest to the origin will replicate earliest while the DNA located at termination zones, regions where opposing replication forks converge, will replicate latest. Replication time profiles have been used to identify both initiation and termination zones [6], [7], [14]. Initiation zones manifested as local maxima in the early and mid S phase profiles and as local minima in the late S phase profile (Figure 3C). Conversely, termination zones manifested as local minima in the early and mid S phase profiles and as local maxima in the late S phase profile (Figure 3C). We identified initiation and termination zones by computationally determining probes occurring at local maxima and minima in the loess smoothed profiles. We did not treat individual probes as initiation or termination zones and, instead, defined zones as 10 kb segments centered at the identified probes. Any zones that overlapped were then merged into a single zone. Replication time for each zone was determined from constituent probes.
The number of initiation and termination zones was consistent between experiments (Table S7 and Figure 3C). However, their positions were more consistent between the early and mid S phase profiles versus comparisons with the late S phase profiles, e.g. 80% of the initiation zones identified in the early S phase profiles are within 20 kb of an initiation zone identified in the mid S phase profiles while this figure dropped to 65% when comparing the early and late S phase initiation zones (Table S8). This difference is not unexpected given that initiation zones are more likely to replicate in early or mid S phase while termination zones are more likely to replicate in late S phase.
We then examined the frequency of initiation and termination zones as a function of replication time. In Drosophila, initiation sites are more abundant in late replicating DNA than in early replicating DNA with very little initiation occurring in mid S phase [14]. In Arabidopsis, we found that the distribution of replication times for the initiation zones reflected the distribution of replication times for chr4 with initiation zones prominent only in EM (37%) and L (42%) segments (compare Figure 4A and 4B). Thus, unlike Drosophila, initiation sites are no more abundant in late than in early replicating DNA. However, Arabidopsis appears similar to Drosophila [14] in that the majority of termination zones are located in L (61%) rather than EM (19%) segments (Figure 4B). These results indicate that DNA replication in late S phase includes elongation from origins that have fired earlier in S phase as well as initiation and elongation from late firing origins.
Higher eukaryotes do not possess replicons in the strictest sense of the term, but rather the concept of a “relaxed replicon” likely applies [2]–[4]. In this model, replication origins are not rigidly defined, and replicon boundaries can vary from cell to cell. We defined the boundaries of these relaxed replicons (hereafter referred to as replicons) using a subset of the termination zones. Where possible, we used termination zones that were identified in early, mid and late S phase cells. Where termination zones differed between experiments, we preferentially used termination zones enriched in late S phase cells or local minima from early or mid S phase cells for EM-replicating segments (Figure 3C and Table S7 and Materials and Methods). In this way, we identified 164 termination zones that defined 163 putative replicons across chr4 with a median length of 107 kb. This replicon size is consistent with previous measurements of single replicons in Arabidopsis [45], [48], although we cannot exclude the possibility that at least some of these replicons are clusters of smaller replicons. The majority (154) have at least one putative initiation zone (Figure 3C and Table S9). This strategy worked well for the euchromatic regions of chr4, particularly the distal long and distal short arms, where the predicted termination zones were consistent between early, mid and late S phase cells (Figure 3C). There was less agreement between profiles for the other chr4 regions, and replicon boundaries in the late-replicating regions are defined primarily from the late S phase profiles (Figure 3C and Table S7).
The assignment of a specific replication time to individual replicons is complex because a replicon can be comprised of DNA segments with replication times that cover the entirety of S phase. To simplify the analysis, we classified replicons based on the replication time of the probes comprising the greatest proportion of a replicon, e.g. a replicon comprised of 45% EM probes, 40% L probes and 15% M probes would be classified as EM. Figure 4C (top panel) shows a schematic representation of chr4 replicons with the replication times for the constituent probes. The complexity of replication time within replicons likely reflects several factors including time and efficiency of origin firing, the number of origins within initiation zones, and the rate of elongation by DNA polymerase in specific contexts [2]–[4], [24].
In Drosophila, the interval between termination zones varies between early S phase and late S phase, with increased initiation in late S phase resulting in more closely spaced termination zones [14]. The size of the Arabidopsis replicons does not vary significantly between EM and L replicons (Figure 4D). While M, ML and EML replicons are smaller than either EM or L replicons, the difference in size is not statistically significant (Figure 4D). The similar size of EM and L replicons follows from the previous observation that initiation zones are no more abundant in late replicating regions than in earlier replicating regions (Figure 4B).
In mouse cells, replicons are organized into replication domains consisting of large clusters of replicons with similar replication times [13], [22]. In Drosophila cells, clustering is less evident with replication profiles showing distinct peaks of early replication [14]. Arabidopsis appears more similar to Drosophila in this regard, but the 163 chr4 replicons could be organized into 41 replication domains based on their replication time (Figure 4C, middle panel, and Table S10). There are a few large replication domains, including a 4.5 Mb L domain (coordinates 2.6–7.1 Mb) that encompasses the entire pericentromere and portions of the proximal short and long arms, and a 2.3 Mb EM domain (coordinates 16.2–18.5 Mb) in the distal long arm (Figure 4C, middle panel). However, the mean length of chr4 replication domains is 450 kb which is considerably smaller than the 1 Mb reported for mouse cells [13]. This difference in replicon organization may be related to genome size. The genome sizes of Arabidopsis and Drosophila are similar at 115 and 122 Mb, respectively [54], [57], while the mouse genome is estimated at 2500 Mb [56].
Genetic and epigenetic features and replication time
Replication time has been correlated with both genetic and epigenetic features in other model systems [7], [8], [11]–[14]. The replication profiles (Figure 2) show that on the scale of the entire chromosome, EM replication is associated with euchromatic regions while L replication is associated with heterochromatic regions. To examine the relationships between replication time and both genetic and epigenetic features in more detail, we generated a database for computational analysis that incorporates our replication time data, the Arabidopsis TAIR 8 genome annotation [61], and epigenetic information for the Arabidopsis cell line [34]. We performed our analyses both on the level of individual probes and within the context of replicons.
To compare the genetic and epigenetic features of probes with different replication times, we partitioned the data into six smaller data sets based on the chr4 regions (Figure 2). This approach was necessary because heterochromatin replicates almost exclusively late, so any analysis that does not account for this fact merely compares heterochromatin to euchromatin. We then used a series of one-sample statistical tests to query whether probes with specific replication times were enriched or depleted for a specified genetic or epigenetic feature relative to the mean for that feature within a given region. This analysis is equivalent to comparing replication segments, but has the advantage of controlling for segment length by using probe numbers. Results for the proximal and distal portions of long arm are presented in Table 1. (The complete analysis is in Table S11.)

In animal systems, early replication positively correlates with gene and GC content when integrated over large domains [7], [12], [13], [62]. We found that the GC content of EM probes is depleted relative to the distal long arm, whereas the L probes are GC-enriched. EML probes have a GC content similar to EM probes, but M and ML probes are also GC-enriched. These results are likely linked to the gene coverage of these probes, with EM and EML probes showing depleted gene coverage and M, ML and L probes showing enriched gene coverage. The sequence content of the proximal long arm is different from the distal long arm, showing both a lower GC and gene content. However, the EM probes still show a lower GC content relative to the entire region. This depletion of gene and GC content in early-replicating regions contrasts with mammalian systems, and may reflect differences in genome structure.
In both animals and plants, H3K4me is almost exclusively genic and correlates with gene expression [27], [29], [30], [32], [34], [36], [37], with H3K4me3 having the strongest positive effect on gene expression in Arabidopsis [37]. H3K4me3 has been linked to early replication in mouse cells [13], and all forms of H3K4me correlate with early replication in human cells [12], [35]. We found that H3K4me1/2 is depleted in EM probes and enriched in ML and L probes in the distal long arm, consistent with the gene coverage. Despite its lower gene coverage, the proximal long arm has an abundance of H3K4me1/2 similar to that of the distal long arm, due in part to the gain of H3K4me1/2 by certain classes of TEs [34]. While we detected a depletion of H3K4me1/2 in EM probes, we did not detect a significant enrichment of H3K4me1/2 in L probes relative the proximal long arm as a whole.
DNA cytosine methylation (5mC) is found in the coding region of genes in the euchromatic regions of Arabidopsis, often in conjunction with H3K4me1 [33], [34], [37], [38], [63]. Like H3K4me1/2, 5mC is depleted in EM probes and enriched in ML and L probes in the distal long arm. The distribution of 5mC differs between the proximal long arm and the distal long arm. While 88% of 5mC is genic in the distal long arm, the percentage drops to 60% in the proximal long arm, and much of the 5mC in this region is associated with TEs and other repetitive sequences located in heterochromatin [33], [34]. We found a depletion of 5mC in EM, M and ML probes and an enrichment in L probes, which likely reflects the heterochromatic character of L probes in the proximal long arm.
To confirm this hypothesis, we examined the distribution of histone H3K9me2, which is associated with heterochromatin in Arabidopsis [31], [34], [64]. While H3K9me2 is not an abundant feature in the distal long arm, it is depleted in EM and M probes and enriched in L probes in this region, suggesting that some L probes are located in cryptic or facultative heterochromatin [28], [31], [65]. H3K9me2 is much more abundant in the proximal long arm, principally due to the elevated TE and repeat content of this region [33], [34], [58]. Again, H3K9me2 is depleted in EM, M and ML probes and enriched in L probes. The abundance of H3K9me2, 5mC and late replication in the proximal long arm suggests that much of this region should be considered cryptic or facultative heterochromatin.
Finally, we examined the correlation between H3K56ac and replication time. H3K56ac is associated with multiple biological processes that require an open chromatin conformation, including DNA replication, repair and transcription [40], [66]–[71]. H3K56ac is enriched in gene promoter regions in Arabidopsis suggesting a role in transcription [34]. In both the distal and proximal long arms, we detected enrichment of H3K56ac in EM probes and depletion in L probes. H3K56ac is also enriched in EL probes in both the proximal and distal long arms and in EML probes in the proximal long arm. The enrichment of H3K56ac in regions depleted for genes and the epigenetic marks associated with genes raises the possibility that some of the H3K56ac detected in our cells may be related to DNA replication rather than gene transcription.
Distribution of genetic features and epigenetic modifications within replicons
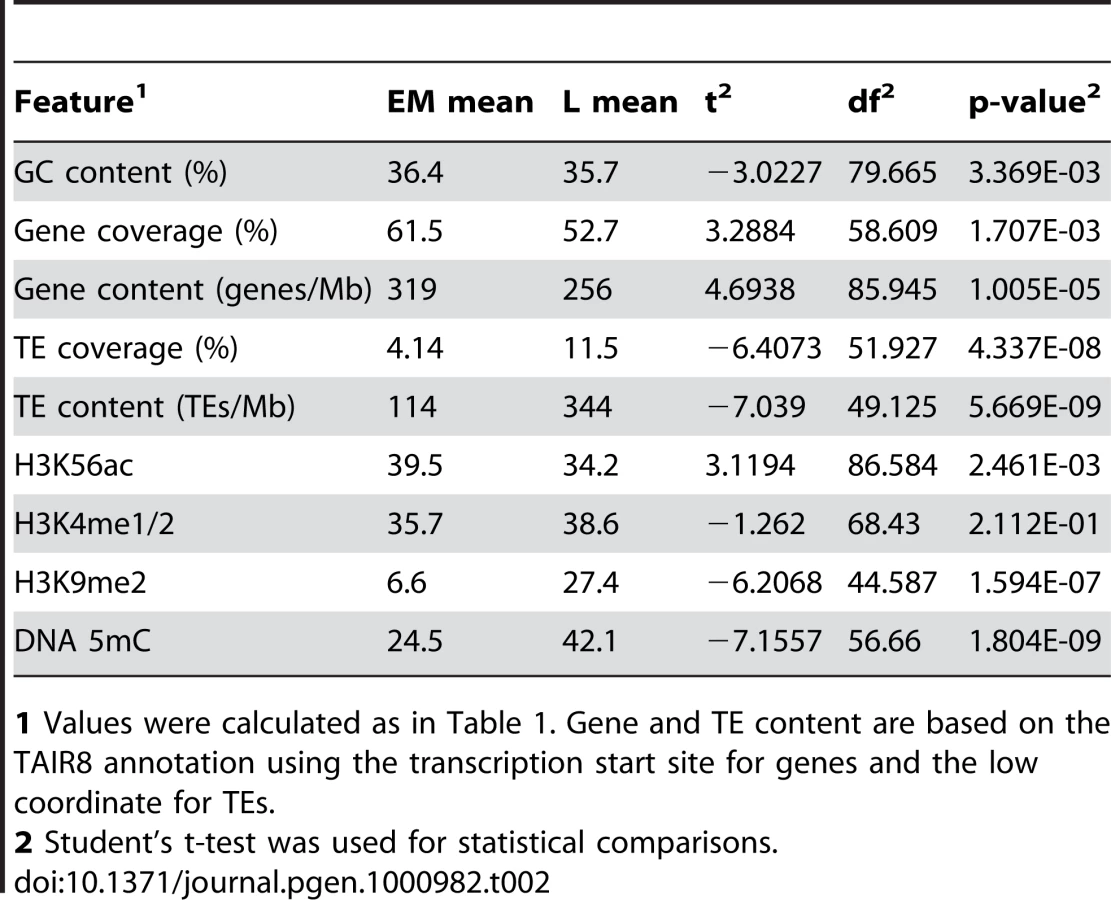
To explore the relationship between genetic and epigenetic features and replication time in more detail, we performed further analyses in the context of the replicons identified above, again restricting our analysis to the long arm of chr4. We compared the overall content of genetic features and epigenetic modifications between EM and L replicons. We found that gene coverage/content, GC content and H3K56ac are higher in EM than in L replicons, whereas L replicons are enriched for TEs, H3K9me2 and DNA 5mC (Table 2). H3K4me1/2 is similar in EM and L replicons (Table 2). While these results are more consistent with animal systems, the results for gene coverage, GC content and H3K4me1/2 seem to conflict with the probe-level analysis presented above. However, two factors must be considered. First, 62 of the 66 EM replicons are located in the distal long arm while 31 of the 42 L replicons are located in the proximal long arm, and the distal long arm has a higher gene content and GC content than the proximal long arm (Table 1). Second, many of the EM and L replicons are comprised of DNA segments that replicate in various parts of S phase, e.g. the termination zones of EM replicons often replicate in late S phase (Figure 3 and Figure 4C). Thus, integration of genetic and epigenetic features over large regions such as replicons may obscure finer relationships.
To further resolve these relationships, we devised an analysis that examined the distribution of features within an “average” replicon. A similar strategy was used to examine the distribution of epigenetic modifications across genes [33], [34]. Each putative replicon in the proximal and distal long arms was divided into 10 intervals, each comprising 10% of its length. Unlike genes that have a definite polarity, most replicons are products of bidirectional fork progression and can be treated as symmetrical [1]–[5]. Hence, we combined our 10 intervals into 5 bins with the two innermost intervals near initiation zones comprising bin 1 and the two outermost intervals near termination zones comprising bin 5. We determined the occurrence of gene-rich, AT-rich, H3K4me1/2, H3K9me2, H3K56ac and 5mC probes within each bin across EM and L replicons separately (Figure 5).

We detected spatial correlations for both genetic and epigenetic features in EM replicons (Figure 5). Both AT-rich (top 25%) and H3K56ac probes are more abundant near initiation zones and depleted near termination zones (Figure 5). In contrast, the distribution of gene-rich (top 25%), H3K4me1/2 and 5mC probes show opposite trends (Figure 5). H3K9me2 is sparse in EM replicons, and there is no spatial correlation (Figure 5). These results suggest that DNA replication initiates in AT-rich intergenic regions with an open chromatin conformation and proceeds by elongation into gene-rich regions where the epigenetic features associated with the gene regulation specify a more complex chromatin structure. Most of the spatial correlations do not apply to L replicons, although there is a clear enrichment of H3K56ac near initiation zones (Figure 5). This analysis reconciles the probe-level (Table 1) and replicon analyses (Table 2), demonstrating that genetic and epigenetic features have both short and long range influences on replication time.
DNA replication, gene expression, and epigenetic modifications
To determine if the increased H3K56ac near initiation zones is linked with gene expression, we looked more closely at the relationship between replication time, gene expression and epigenetic modifications. Previous analysis of these cells showed that H3K56ac is enriched at the 5′ end and promoters of genes, while H3K4me1/2 and 5mC are enriched in the body of genes [34]. To discern broad patterns of epigenetic modification and gene expression, we generated heat maps of the epigenetic data using a loess algorithm as we did for replication time. We determined gene expression in our cells using existing microarray data [34] and used two metrics to measure gene expression. The presence/absence of a transcript was determined using the Affymetrix Micro Array Suite 5.0 algorithm (MAS5) [72]. If the transcript was present, we considered the gene to be active. Gene expression levels were estimated using the gcRMA algorithm [73]. For the heat maps, we mapped the gcRMA expression values to the microarray probes prior to applying the loess algorithm. Representative late and early replicating regions of chr4 are shown in Figure 6. Elevated levels of H3K56ac are frequently associated with regions near replicon initiation zones whereas elevated levels of H3K4me1/2, H3K9me2 and 5mC are often near termination zones. Gene expression showed less clear-cut results sometimes colocalizing with H3K4me1/2 near termination zones and sometimes with H3K56ac near initiation zones.

We then examined the effect of epigenetic modifications on gene expression and replication time at the level of genes. The 2844 chr4 genes with available expression and epigenetic data were classified into 16 groups based on the pattern of all possible combinations of the four epigenetic modifications examined in our cells [34]. Replication time for each gene was derived from the overlapping probes. Using MAS5 presence/absence calls, we estimated that 61% of chr4 genes are active in our cells. Using this as a baseline, we ranked the 16 epigenetic patterns by increasing gene activity, with genes displaying pattern 1 having the highest probability of expression and genes with pattern 16 having the lowest (Table 3). Genes with pattern 1, which constitute the largest group, are positive for H3K4me1/2, H3K56ac and 5mC (Table 3). The presence of H3K4me1/2 and 5mC on expressed genes is consistent with previous studies showing that these marks can potentiate gene expression in Arabidopsis [37], [38], [63]. Strikingly, H3K56ac is the only epigenetic modification found in all patterns that show increased gene activity (Table 3). A positive correlation between gene expression and H3K56ac has been shown in other organisms [66], [70], [71], [74], and we show that this correlation exists in Arabidopsis. For the remaining patterns, H3K9me2 showed a clear association with reduced gene activity while genes lacking detectable H3K4me1/2, H3K9me2, H3K56ac or 5mC also showed low activity (Table 3).

Studies in other model organisms have shown a positive correlation between gene transcription and early replication [7]–[14]. When examined independent of epigenetic modifications, genes are significantly more likely to be expressed if they replicate EM rather than L (Table 4). Of chr4 genes, only genes with patterns 3 and 4 are more likely to replicate EM. Interestingly, genes with patterns 3 and 4 are distinguished from genes with patterns 1 and 2 by the lack of 5mC (Table 3). Despite their high frequency and levels of expression, genes with pattern 1 showed a slight tendency to replicate L and genes with pattern 2 showed no clear bias for either EM or L replication. Genes with patterns 7, 14 and 15 are more likely to replicate L than EM, and each of these patterns is characterized by the presence of H3K9me2 and 5mC (Table 3). In summary, the increased expression of EM-replicating genes is associated with enrichment of this population for genes displaying H3K56ac but lacking 5mC as well as with depletion of genes bearing the repressive combination of H3K9me2 and 5mC.

Allele-specific differences in replication time have been observed in animals [12], [60]. This can occur when one allele of a gene bears activating epigenetic modifications while the other allele bears repressive modifications, and could give rise to EL, EML or I replication time. Genes with patterns 6 through 9, 11 and 14 bear such modifications, and we did observe a slight enrichment of pattern 9 for EL genes and pattern 7 for EML genes (Table 3). However, the majority of the EL, EML and I segments cannot be explained by allele-specific replication timing. In many cases, genes that replicate EL, EML or I have only activating or repressive marks (Table 3). As stated above, many of these segments are associated with TEs and other repetitive elements.
The heat maps suggested that much of the H3K56ac on chr4 is associated with early replication and not gene expression (Figure 6). To examine this more closely, we determined whether the H3K56ac near the initiation zones of replicons in the long arm of chr4 was due to genes with epigenetic patterns 1 through 4 or reflected H3K56ac in intergenic sequences as well. Genes with pattern 3, positive only for H3K56ac, show a slight enrichment near initiation zones of EM replicons (Figure S4). An analysis of intergenic regions of chr4 revealed that the two most abundant epigenetic patterns are 3 (H3K56ac only) and 13 (no detected modifications) (Table S12). In the long arm of chr4, intergenic regions with pattern 3 are enriched near initiation zones and depleted near termination zones, but intergenic regions with pattern 13 are uniformly distributed across replicons (Figure S5). To determine if this enrichment for intergenic H3K56ac near initiation zones is associated with the promoters of expressed genes, we analyzed the distribution of expressed genes (regardless of epigenetic modifications) across replicons. This analysis showed that expressed genes are uniformly distributed (Figure S4), allowing us to conclude that much of the intergenic H3K56ac is associated with early replication and not gene expression.
Discussion
DNA replication and genome size
DNA replication has been profiled in Drosophila, mouse and human genomes [7]–[14], [22], [23], [60], [75]. Arabidopsis and Drosophila have a similar genome size (∼120 Mb each) and gene density (250 and 111 genes/Mb respectively) [54], [57], so it is not surprising that their replication profiles are similar. In contrast, the human and mouse genomes are substantially larger (3300 and 2500 Mb respectively) and have a much lower gene density (10 genes/Mb each) [55], [56]. Mammalian genomes are also characterized by large regions of uniform GC and gene content known as isochores [62], [76], [77]. In both human and mouse cells, replication time has been shown to correlate with isochore structure, and high GC, gene-rich isochores tend to replicate early in S phase [13], [62]. In contrast, it is not clear that a functionally equivalent isochore structure exists in Arabidopsis or Drosophila [77], [78]. Such differences in genome structure may explain why gene content and expression and the associated epigenetic modifications have a more subtle influence on replication time in Arabidopsis than in mammals. For example, in human cells, distance to the closest expressed gene is strongly correlated with replication time [23]. However, these distances are on the order of megabases. Such a correlation is meaningless in Arabidopsis where the median intergenic distance is less than one kilobase [54], [61]. Accordingly, we tailored our analysis to suit this compact genome, revealing many similarites and a few differences in the DNA replication programs of these model systems.
DNA replication in Arabidopsis is biphasic
A common approach to determine DNA replication timing utilizes the direct hybridization of BrdU labeled early and late S phase DNA to genomic tiling arrays to construct a replication profile that indicates the enrichment of a given sequence in early relative to late S phase [7]–[9], [13], [14]. In this approach, DNA replication in mid S phase is inferred rather than directly evaluated. We measured Arabidopsis DNA replication in early, mid, and late S phase cells in separate microarray experiments producing three independent replication profiles. This strategy revealed that the replication profiles for early and mid S phase cells are very similar to each other and clearly distinct from the late S phase profile.
The majority of euchromatin in chr4 replicates in early and mid S phase, and the bulk of the heterochromatin replicates in late S phase (Figure 2). Temporal separation of DNA replication for euchromatin and heterochromatin was first observed at least five decades ago in both plants and animals [25] and is consistent with recent findings in Drosophila, mouse and human cells [21]. Fiber autoradiography experiments in Arabidopsis identified two temporal classes of replicons but did not distinguish euchromatin from heterochromatin [48].
Surprisingly, there is little difference between the early and mid S phase replication profiles (Figure 2), even though FACS profiles for the early and mid S phase cells are distinct (Figure 1 and Figure S2). When interpreting these results, it is important to remember that while FACS takes a DNA content measurement for each cell, the replication profiles are derived from a population of cells. If DNA replication followed a totally random program, a population of early S phase cells could produce a replication profile that encompasses the entire genome. At the other extreme is a strict temporal program in which the order of origin activation is highly consistent between cells in a population. With our experimental design, such a program would produce early S phase profiles showing replication of approximately 20% of the genome, while mid S phase profiles would be distinct from the early S phase profiles because they would encompass an additional 30% of the genome.
Our results are an intermediate case between these two extremes and are best explained by a biphasic model of replication for Arabidopsis. In this model, the bulk of euchromatin replicates in early to mid S phase and the heterochromatin replicates late. Origin utilization is largely the same in early and mid S phase, suggesting that the temporal order of origin activation in the first half of S phase is stochastic. While we did not attempt to identify origins per se, we did identify initiation zones, and we detected few, if any, initiation zones specific to mid S phase cells (Figure 3C and Figure 4B). The segmentation analysis showed some merging of early S phase segments to form larger mid S phase segments, but this effect most likely reflects elongation of replicons rather than activation of additional origins (Figure 3). The relative enrichment for initiation zones is similar in early and mid S phase cells suggesting that there is no quantitative difference in origin activation (Figure 3C). In contrast, there are many putative initiation zones specific for late S phase (Figure 3C and Figure 4B).
The idea that DNA replication follows a strict temporal program derives largely from seminal work in budding yeast [6], [79]. Budding yeast is characterized by sequence specific origins in a compact genome and, as such, might not be a good model for eukaryotes with much larger genomes and no clear origin sequence specificity [1]–[4]. Single molecule studies showed that even in budding and fission yeast, origin activation is stochastic and varies from cell to cell in a population [15], [16]. Whole genome studies in Drosophila and mouse cells are also consistent with a biphasic model of DNA replication. In Drosophila, initiation zones are most abundant in early and late S phase [14], while mouse replicons and replication domains tend to segment as either early or late [13]. Increasingly, origin activation is being interpreted as a largely stochastic process at the level of individual cells, with temporal profiles corresponding to the most probable sequence of origin activation for a population of cells [17], [18], [20].
Replication time correlates with chromatin conformation
The replication time of any given DNA segment is related to three factors – distance from the closest origin, activation time of that origin, and rate of DNA elongation upstream of the segment. Chromatin conformation can influence the latter two factors, and chromatin remodeling factors have been shown to be critical for DNA replication [80]–[83]. Our analyses of replication time with respect to both genetic and epigenetic features revealed correlations that may reflect the effect of chromatin conformation on origin specification, origin activity and the rate of DNA elongation.
The heterochromatic knob and pericentromeric heterochromatin are entirely late replicating (Figure 4A). Both of these regions are depleted in genes, rich in TEs, and display abundant H3K9me2 and 5mC (Figure 2 and Table S11). This constitutive heterochromatin exists in a compact conformation throughout most of the cell cycle [59]. This conformation likely restricts both origin activation and DNA elongation [2]–[4]. In both budding and fission yeast, pericentromeric heterochromatin replicates in early S phase [6], [26], but pericentromeric DNA replicates in late S phase in animal cells [9], [84], [85]. In both cases, replication of heterochromatin is dependent on chromatin remodeling complexes [80], [82], [83], and it will be interesting to identify the complexes utilized by plants.
We focused our analyses on the long arm of chr4 because it represents a large contiguous, genomic segment generally regarded as euchromatic [33], [34], [58], [59]. However, we were surprised by the predominance of late replication in the proximal portion of the long arm (Figure 2 and Figure 4A). Probe and replicon level analyses revealed that relative to the distal long arm, the proximal long arm has considerable heterochromatic character, including decreased gene coverage/content, increased TE coverage/content, and elevated levels of both H3K9me2 and DNA 5mC (Figure 2, Table 1, and Table 2). Much of the proximal long arm likely adopts a chromatin state known as cryptic or facultative heterochromatin [28], [65]. Such regions share some of the biochemical features of constitutive heterochromatin, including hypoacetylation, H3K9me2 and DNA 5mC, but do not adopt the long range, highly condensed structure of constitutive heterochromatin. In mouse cells, replication domains that switch replication time upon differentiation are believed to be facultative heterochromatin [13], [21].
Despite the overall differences in replication time for the proximal long and distal long arm regions, we detected several correlations between replication time and genetic and epigenetic features that were similar in both regions. For example, EM-replicating probes show increased AT content, decreased gene coverage and decreased DNA 5mC (Table 1). Further, the histone modifications, H3K4me1/2 and H3K9me2, are decreased while H3K56ac is increased. The pattern is opposite for L-replicating probes. These observations suggest that DNA replication initiates in AT-rich intergenic regions with an open chromatin conformation and proceeds into regions where the epigenetic modifications associated with gene expression specify a more complex chromatin conformation. The distribution of genetic and epigenetic features within replicons further supports this hypothesis (Figure 5).
The EM replicons display trends that are consistent with a replicon model that has been termed the “relaxed replicon” model [2]–[4]. This model incorporates several mechanisms to explain ORC binding and replicon structure in higher eukaryotes. Mechanisms consistent with our work include a higher affinity of ORC for open chromatin and AT rich sequences [86], [87], transcriptional interference preventing ORC binding [88], and inhibition of ORC binding by DNA methylation [89]. The structure of EM replicons may be driven by the probability of both ORC binding and origin activation. Regions proximal to initiation zones have a higher AT content and elevated H3K56ac and may have a higher probability of binding ORC to form an origin (Figure 5). The lower gene density, lower H3K4me1/2 and reduced 5mC in these regions would also favor origin formation. Termination zones show opposite trends for these characteristics, consistent with a lower probability of binding ORC. In addition, elevated levels of H3K4me1/2 and 5mC may impede the progress of replication forks in these regions. Chromatin modified by DNA 5mC adopts a more compact conformation and impedes the progress of RNA polymerase [63], [90].
The trends for EM replicons are readily apparent when the epigenetic modifications are integrated over large regions (Figure 6). Most of the trends do not hold for L replicons, which in comparison to EM replicons, have greatly elevated and evenly distributed levels of H3K9me2 and 5mC indicative of a heterochromatic state (Table 2, Figure 5, and Figure 6). Replication may be delayed in these regions because it requires the activity of chromatin remodeling complexes, as discussed above for the heterochromatic knob and pericentromere. Additionally, L replicons may have a lower density of potential origins.
Gene expression and replication time
Gene expression shows a positive correlation with early replication in all higher eukaryotes examined to date [7]–[9], [11]–[14], [22], [23]. This correlation is strongest when integrated over large regions because there are many exceptions at the level of individual genes. We identified a similar correlation in Arabidopsis, with genes in EM replicating regions more likely to be expressed than genes in L replicating regions (Table 4). However, the relationship of specific epigenetic modifications to gene expression and replication time is complex (Table 3). From the standpoint of replication time, two effects are prominent. H3K56ac with a lack of H3K9me2 is favorable for both gene expression and early replication, whereas H3K9me2 with a lack of H3K56ac correlates with lower expression and late replication. Genes associated with both H3K9me2 and H3K56ac also tend toward low expression and late replication, but the effect is less clear-cut than H3K9me2 alone. Genes with both marks are similar to the “pan S” or “biphasic” genes in human cells which bear both active and repressive chromatin marks due to interallelic variation [12], [60]. We also observed an increase in EML replication for these genes in Arabidopsis (Table 3). Unlike the epigenetic modifications discussed above, integration of gene expression over large regions did not reveal a correlation between gene expression and replicon structure (Figure 6). This lack of correlation probably reflects the fact that the expression of an individual gene is more strongly modulated by epigenetic modifications specific to that gene rather than by the global characteristics of large regions containing many genes.
H3K56 acetylation and early replication
H3K56ac is thought to occur on all newly synthesized H3 histones and be required for nucleosome assembly [66], [69], [91]. H3K56ac is associated with regions of nucleosome exchange such as active promoters [70], [71], sites of DNA repair [67], [69], and nascent chromatin [40], [68]. In budding yeast, H3K56ac is most abundant during S phase and localizes to early origins in a cell cycle dependent manner [40], [68], [69]. Intriguingly, H3K56ac correlated with EM replication and was enriched at the center of Arabidopsis replicons (Figure 5 and Figure 6). Interpretation of this data must be tempered by the fact that the epigenetic profiling was performed on an unsorted population of cells so both replication dependent and independent H3K56ac is represented. Although there was a positive correlation between H3K56ac and gene expression (Table 3), integration of H3K56ac over large regions, including intergenic regions, showed a clear association with replication time and not with gene expression (Figure 6). H4K16ac correlates with early replication in Drosophila [14], while H3K56ac associates with early origins in budding yeast [40]. We have provided the first evidence, to our knowledge, linking H3K56ac to replication time in a higher eukaryote. Unlike H4K16, H3K56 is located in the core of the histone and is inaccessible to acetylation in the context of a fully assembled nucleosome [66], [92]. Therefore, H3K56ac might be associated with nascent DNA behind active replication forks rather than the disassembly of chromatin ahead of replication forks [68]. Nevertheless, H3K56ac may prove to be a valuable epigenetic mark for identifying replication origins.
Conclusions
We have presented a high-resolution analysis of the replication program for a plant chromosome. Arabidopsis DNA replication is biphasic, with euchromatin replicating in the first half of S phase and heterochromatin replicating in the last half. This pattern is similar to other eukaryotes [9], [84], [85], although exceptions do occur in yeast [6], [26]. Within each phase, origin activation appears to be largely stochastic because we could discern few differences between replication profiles for early and mid S phase cells. This result provides additional support for the emerging model of stochastic origin activation rather than strict temporal regulation [15]–[18], [20]. The replication profiles allowed us to construct a replicon map for chr4 and to correlate replication time with gene expression and specific epigenetic modifications. We showed that initiation zones are enriched for epigenetic features associated with open chromatin, providing support for the “relaxed replicon” model, which proposes that origin specification and activity are strongly influenced by both sequence content and chromatin conformation in higher eukaryotes [1]–[4]. Finally, we showed that early replicating regions and initiation zones are enriched for H3K56ac. This histone modification continues to be an area of intense research because of its role in DNA replication, DNA repair and gene expression. We provide evidence that H3K56ac has both replication independent and dependent roles in plants by showing that genes bearing H3K56ac have a higher probability of expression, whereas large regions with elevated H3K56ac levels are associated with early replication. Replication time and H3K56ac data in conjunction with other experiments may help us identify replication origins in plants. This study linking DNA replication and replicon structure to chromatin conformation provides a foundation for future studies that will investigate the impact of these processes on plant growth and development.
Materials and Methods
Cell culture
The Arabidopsis cell line (Col-0, ecotype Columbia) was maintained in Gamborg's B5 basal medium with minor salt (Sigma G5893) supplemented with 1.1 mg/L 2,4-dichlorophenoxyacetic acid, 3 mM MES and 3% sucrose. The cells were grown on a rotary shaker at 160 rpm under constant light at 23°C and subcultured every 7 days with a 1∶10 (inoculum∶fresh medium) dilution [34].
BrdU labeling was maximized using a ‘7-d split culture' by mixing 25 mL of fresh medium and 25 mL of the Arabidopsis culture at 7 days post subculture. The 7-d split culture was grown for 16 h and then labeled for 1 h with 100 µM BrdU (Sigma B9285). Labeled cells were fixed in 1% paraformaldehyde for 15 min, washed in 1× phosphate buffered saline (PBS) three times, and snap frozen in liquid nitrogen. Time course experiments showed that BrdU incorporation is highest between 12 and 16 h post-labeling (Figure S1C). Cells from six 7-d split cultures were combined for each biological replicate.
Nuclei isolation
The frozen cell pellet for each biological replicate was ground at 4°C in 150 mL lysis buffer (15 mM Tris-HCl pH 7.5, 2 mM EDTA, 80 mM KCl, 20 mM NaCl, 15 mM β-mercaptoethanol, and 0.1% Triton X-100) using a commercial blender. The ground cell suspension was incubated at 4°C for 5 min and filtered through a 3-tiered nylon mesh (100, 50, and 30 µm). The filtrate was centrifuged at 200 ×g for 5 min at 4°C, and the nuclei were resuspended in 8 mL of lysis buffer containing 2 µg/mL DAPI and 50 µg/mL RNase A. The isolated nuclei were filtered through a 20-µm nylon filter before flow cytometric analysis and sorting.
FACS analysis and flow sorting
Nuclei were sorted and recovered using an InFlux cell sorter (BD Biosciences) equipped with a 355-nm UV laser and a 488-nm sapphire laser. STE buffer (10 mM Tris-HCl pH 7.5, 1 mM EDTA, and 100 mM NaCl) was used as a sheath fluid, and nuclei were sorted into a 50-mL tube containing 5 mL STE buffer.
An analytical FACS profile for BrdU incorporation and DNA content was generated as described [93] with some modifications. BrdU-labeled cells were fixed in 70% ethanol on ice for 1 h and frozen in liquid nitrogen. Nuclei were isolated, denatured in 2N HCl and 0.5% Triton X-100 at room temperature for 30 min, neutralized by adding 0.1 M Na2B4O7 (pH 8.5), and washed twice with PBS-TBR (1x PBS, 1% BSA, 0.5% Tween-20 and 50 µg/mL RNase A). The nuclei were resuspended in PBS-TBR containing a 1∶50 dilution of anti-BrdU Alexa Fluor 488 conjugate (Invitrogen) by gentle agitation overnight at 4°C in the dark. The nuclei were washed once with PBS-TBR, incubated in PBS-TBR containing 10 µg/mL propidium iodide for at least 30 min, filtered through a 20-µm nylon filter, and analyzed by FACS. FlowJo (Version 8.8.6) software was used for the data analysis.
Genomic DNA extraction from sorted nuclei
To reverse the crosslinks, the sorted nuclei were treated with 50 mM EDTA, 1% sodium lauroyl sarcosine and 200 µg/mL proteinase K for 1 h at 42°C and then overnight at 65°C in the dark. The mixture was supplemented with 4 mg/mL phenylmethanesulphonylfluoride and incubated for 40 min at room temperature prior to extraction of genomic DNA using phenol/chloroform/IAA in a phase lock gel (Sigma). The upper aqueous phase was mixed with 150 µg/mL GlycoBlue (Ambion) and precipitated with 0.3 M sodium acetate and 2 volumes of cold ethanol. The DNA was centrifuged and the pellet was washed with 70% ethanol once, dried for 5 min using a SpeedVac in the dark, and resuspended in sterile water.
BrdU immunoprecipitation
BrdU-labeled DNA was immunoprecitated as described [94] with some minor modifications. Genomic DNA extracted from the sorted nuclei was sonicated in 450 µL of ChIP dilution buffer (0.1% BSA, 1.2 mM EDTA, 16.7 mM Tris-HCl pH 8, and 167 mM NaCl) to a shear-size of 500 to 1000 bp, followed by addition of Triton X-100 (1.1%). The sheared DNA was denatured at 95°C for 5 min and immediately cooled on ice for at least 5 min. One mL of cold ChIP dilution buffer containing 1.1% Triton X-100 was added and the sheared DNA was incubated with 0.5 µL anti-BrdU antibody (Invitrogen) for 3 h at 4°C. DNA containing BrdU was immunoprecipitated by adding 100 µL of 50% protein G-sepharose beads (Sigma) and incubating overnight in the dark at 4°C with gentle agitation. The beads were washed as previously described by Gendrel, et al. (2005). BrdU-labeled DNA was eluted from the beads with 0.2 M glycine (pH 2.5) and neutralized by adding 10% (v/v) of 1 M Tris-HCl (pH 8). Eluted DNA was treated with proteinase K for 1 h at 45°C, extracted with phenol/chloroform/IAA, and precipitated with sodium acetate and ethanol. Precipitated DNA was resuspended in RT-PCR grade water (Ambion) and used as template for random amplification and real-time quantitative PCR.
Microarray hybridization
BrdU immunoprecipitated DNA (target DNA) and input DNA (reference DNA) samples were amplified as described [95], purified and concentrated to 200–250 ng/µL using a QIAquick PCR Purification Kit (QIAGEN). Each amplified DNA sample (1.5 mg) was labeled with either Cy3 or Cy5 fluorescent dye and purified using a BioPrime Array CGH Genomic Labeling System (Invitrogen). The Cy dye-labeled target and reference samples were co-hybridized on a custom-printed tiling array [33] with a dye-swap experimental design. Each experiment comprised six microarrays representing the three biological replicates and the corresponding dye swaps. Microarray hybridization and washing were previously described [34] but modified to include DyeSaver2 coating reagent (Genisphere) to minimize oxidation of Cy5. Hybridized microarrays were scanned using a PerkinElmer ScanArray Express scanner and quantified using GenePix Pro software (version 6.01).
Microarray data normalization and analysis of replication time
Calculation of microarray probe enrichment ratios, loess and quantile normalizations were done in the R statistical computing environment with the limma package using default settings [96]–[98]. Probe ratios were loess-smoothed in a 150-kb window for replication profiles and identification of initiation and termination zones. Segments of contiguous replication time were defined as regions where smoothed probe ratios were greater than zero for a minimum of 10-kb. This filter minimized excessive replication time changes in regions with low probe enrichment ratios. Merging of the segmentations for early, mid and late S phase cells was done by determining the regions of overlap. The 10-kb length minimum was not used at this step. Initiation and termination zones were identified as the inflection points of the loess-smoothed profiles as described in the results. Zones were then defined as the 10-kb regions centered at the inflection point. Overlapping zones were merged into a single zone. Replication boundaries were chosen from the three sets of termination zones based on the following order of precedence: 1) termination zones present in early, mid and late S phase cells, 2) termination zones enriched in late S phase and 3) termination zones that manifest as local minima but enriched in early and/or mid S phase.
Bioinformatics and statistical analysis
All data manipulation and statistical analysis was performed with R and Bioconductor [96], [99]. A database incorporating probe ratios for replication time, histone modifications, DNA 5mC and the TAIR8 Arabidopsis genome annotation [61] was constructed to facilitate analysis. Gene and TE coverage values for probes and larger regions are the percentage of bases in that region that overlap with any gene or TE respectively. Overlapping genes or TEs were treated as one so that coverage values do not exceed 100%. Statistical comparisons of GC content and gene or TE coverage were performed by one-sample t-tests. AT-rich and gene-rich probes were defined as the top quartile of all probes on the array. AT-rich, gene-rich and probes positive for histone modifications or DNA methylation data were treated as binomial data, and a one-sample binomial test was used for analyses. Gene expression values were determined using the affy package in R [73]. MAS5 presence or absence calls and gcRMA expression values were calculated using default settings. The pattern of epigenetic modifications for chr4 genes was determined from the modifications of the overlapping probes again treating the modifications as binomial data. Heat maps for epigenetic modifications were generated by smoothing probe ratios in a 150-kb window as for replication profiles and ranking the data by deciles for the whole of chr4. Heat maps for gene expression were generated similarly but gcRMA expression values were used rather than probe ratios. R scripts for all analyses and figures are available upon request.
Supporting Information
Zdroje
1. BerezneyR
DubeyDD
HubermanJA
2000 Heterogeneity of eukaryotic replicons, replicon clusters, and replication foci. Chromosoma 108 471 484
2. GilbertDM
2004 In search of the holy replicator. Nat Rev Mol Cell Biol 5 848 855
3. AladjemMI
2007 Replication in context: dynamic regulation of DNA replication patterns in metazoans. Nat Rev Genet 8 588 600
4. HamlinJL
MesnerLD
LarO
TorresR
ChodaparambilSV
2008 A revisionist replicon model for higher eukaryotic genomes. J Cell Biochem 105 321 329
5. GondorA
OhlssonR
2009 Replication timing and epigenetic reprogramming of gene expression: a two-way relationship? Nat Rev Genet 10 269 276
6. RaghuramanMK
WinzelerEA
CollingwoodD
HuntS
WodickaL
2001 Replication dynamics of the yeast genome. Science 294 115 121
7. MacAlpineDM
RodriguezHK
BellSP
2004 Coordination of replication and transcription along a Drosophila chromosome. Genes Dev 18 3094 3105
8. SchubelerD
ScalzoD
KooperbergC
van SteenselB
DelrowJ
2002 Genome-wide DNA replication profile for Drosophila melanogaster: a link between transcription and replication timing. Nat Genet 32 438 442
9. WhiteEJ
EmanuelssonO
ScalzoD
RoyceT
KosakS
2004 DNA replication-timing analysis of human chromosome 22 at high resolution and different developmental states. Proc Natl Acad Sci U S A 101 17771 17776
10. WoodfineK
FieglerH
BeareDM
CollinsJE
McCannOT
2004 Replication timing of the human genome. Hum Mol Genet 13 191 202
11. JeonY
BekiranovS
KarnaniN
KapranovP
GhoshS
2005 Temporal profile of replication of human chromosomes. Proc Natl Acad Sci U S A 102 6419 6424
12. KarnaniN
TaylorC
MalhotraA
DuttaA
2007 Pan-S replication patterns and chromosomal domains defined by genome-tiling arrays of ENCODE genomic areas. Genome Res 17 865 876
13. HirataniI
RybaT
ItohM
YokochiT
SchwaigerM
2008 Global reorganization of replication domains during embryonic stem cell differentiation. PLoS Biol 6 e245 doi:10.1371/journal.pbio.0060245
14. SchwaigerM
StadlerMB
BellO
KohlerH
OakeleyEJ
2009 Chromatin state marks cell-type - and gender-specific replication of the Drosophila genome. Genes Dev 23 589 601
15. CzajkowskyDM
LiuJ
HamlinJL
ShaoZ
2008 DNA combing reveals intrinsic temporal disorder in the replication of yeast chromosome VI. J Mol Biol 375 12 19
16. PatelPK
ArcangioliB
BakerSP
BensimonA
RhindN
2006 DNA replication origins fire stochastically in fission yeast. Mol Biol Cell 17 308 316
17. RhindN
2006 DNA replication timing: random thoughts about origin firing. Nat Cell Biol 8 1313 1316
18. LygerosJ
KoutroumpasK
DimopoulosS
LegourasI
KouretasP
2008 Stochastic hybrid modeling of DNA replication across a complete genome. Proc Natl Acad Sci U S A 105 12295 12300
19. GoldarA
LabitH
MarheinekeK
HyrienO
2008 A dynamic stochastic model for DNA replication initiation in early embryos. PLoS ONE 3 e2919 doi:10.1371/journal.pone.0002919
20. GoldarA
Marsolier-KergoatMC
HyrienO
2009 Universal temporal profile of replication origin activation in eukaryotes. PLoS ONE 4 e5899 doi:10.1371/journal.pone.0005899
21. HirataniI
TakebayashiS
LuJ
GilbertDM
2009 Replication timing and transcriptional control: beyond cause and effect—part II. Curr Opin Genet Dev 19 142 149
22. Farkash-AmarS
LipsonD
PoltenA
GorenA
HelmstetterC
2008 Global organization of replication time zones of the mouse genome. Genome Res 18 1562 1570
23. DespratR
Thierry-MiegD
LaillerN
LajugieJ
SchildkrautC
2009 Predictable dynamic program of timing of DNA replication in human cells. Genome Res 19 2288 2299
24. DonaldsonAD
2005 Shaping time: chromatin structure and the DNA replication programme. Trends Genet 21 444 449
25. Lima-de-FariaA
JaworskaH
1968 Late DNA synthesis in heterochromatin. Nature 217 138 142
26. KimSM
DubeyDD
HubermanJA
2003 Early-replicating heterochromatin. Genes Dev 17 330 335
27. CedarH
BergmanY
2009 Linking DNA methylation and histone modification: patterns and paradigms. Nat Rev Genet 10 295 304
28. FranszP
ten HoopenR
TessadoriF
2006 Composition and formation of heterochromatin in Arabidopsis thaliana. Chromosome Res 14 71 82
29. HendersonIR
JacobsenSE
2007 Epigenetic inheritance in plants. Nature 447 418 424
30. BarskiA
CuddapahS
CuiK
RohTY
SchonesDE
2007 High-resolution profiling of histone methylations in the human genome. Cell 129 823 837
31. LippmanZ
GendrelAV
BlackM
VaughnMW
DedhiaN
2004 Role of transposable elements in heterochromatin and epigenetic control. Nature 430 471 476
32. MikkelsenTS
KuM
JaffeDB
IssacB
LiebermanE
2007 Genome-wide maps of chromatin state in pluripotent and lineage-committed cells. Nature 448 553 560
33. VaughnMW
TanurdzicM
LippmanZ
JiangH
CarrasquilloR
2007 Epigenetic natural variation in Arabidopsis thaliana. PLoS Biol 5 e174 doi:10.1371/journal.pbio.0050174
34. TanurdzicM
VaughnMW
JiangH
LeeTJ
SlotkinRK
2008 Epigenomic consequences of immortalized plant cell suspension culture. PLoS Biol 6 e302 doi:10.1371/journal.pbio.0060302
35. BirneyE
StamatoyannopoulosJA
DuttaA
GuigoR
GingerasTR
2007 Identification and analysis of functional elements in 1% of the human genome by the ENCODE pilot project. Nature 447 799 816
36. SchubelerD
MacAlpineDM
ScalzoD
WirbelauerC
KooperbergC
2004 The histone modification pattern of active genes revealed through genome-wide chromatin analysis of a higher eukaryote. Genes Dev 18 1263 1271
37. ZhangX
BernatavichuteYV
CokusS
PellegriniM
JacobsenSE
2009 Genome-wide analysis of mono-, di - and trimethylation of histone H3 lysine 4 in Arabidopsis thaliana. Genome Biol 10 R62
38. ZhangX
YazakiJ
SundaresanA
CokusS
ChanSW
2006 Genome-wide high-resolution mapping and functional analysis of DNA methylation in Arabidopsis. Cell 126 1189 1201
39. GorenA
TabibA
HechtM
CedarH
2008 DNA replication timing of the human beta-globin domain is controlled by histone modification at the origin. Genes Dev 22 1319 1324
40. KaplanT
LiuCL
ErkmannJA
HolikJ
GrunsteinM
2008 Cell cycle - and chaperone-mediated regulation of H3K56ac incorporation in yeast. PLoS Genet 4 e1000270 doi:10.1371/journal.pgen.1000270
41. KnottSR
ViggianiCJ
TavareS
AparicioOM
2009 Genome-wide replication profiles indicate an expansive role for Rpd3L in regulating replication initiation timing or efficiency, and reveal genomic loci of Rpd3 function in Saccharomyces cerevisiae. Genes Dev 23 1077 1090
42. JorgensenHF
AzuaraV
AmoilsS
SpivakovM
TerryA
2007 The impact of chromatin modifiers on the timing of locus replication in mouse embryonic stem cells. Genome Biol 8 R169
43. Lande-DinerL
ZhangJ
CedarH
2009 Shifts in replication timing actively affect histone acetylation during nucleosome reassembly. Mol Cell 34 767 774
44. FalboKB
ShenX
2009 Histone modifications during DNA replication. Mol Cells 28 149 154
45. Vant' HofJ
1996 DNA replication in plants.
DePamphilisML
DNA replication in eukaryotic cells New York Cold Spring Harbor Laboratory Press 1005 1014
46. ShultzRW
LeeTJ
AllenGC
ThompsonWF
Hanley-BowdoinL
2009 Dynamic localization of the DNA replication proteins MCM5 and MCM7 in plants. Plant Physiol 150 658 669
47. ShultzRW
TatineniVM
Hanley-BowdoinL
ThompsonWF
2007 Genome-wide analysis of the core DNA replication machinery in the higher plants Arabidopsis and rice. Plant Physiol 144 1697 1714
48. Vant' HofJ
KuniyukiA
BjerknesCA
1978 Size and number of replicon families of chromosomal DNA of Arabidopsis thaliana. Chromosoma 68 269 285
49. MartienssenRA
KlocA
SlotkinRK
TanurdzicM
2008 Epigenetic inheritance and reprogramming in plants and fission yeast. Cold Spring Harb Symp Quant Biol 73 265 271
50. FinneganEJ
DennisES
2007 Vernalization-induced trimethylation of histone H3 lysine 27 at FLC is not maintained in mitotically quiescent cells. Curr Biol 17 1978 1983
51. FinneganEJ
KovacKA
2000 Plant DNA methyltransferases. Plant Mol Biol 43 189 201
52. PandeyR
MullerA
NapoliCA
SelingerDA
PikaardCS
2002 Analysis of histone acetyltransferase and histone deacetylase families of Arabidopsis thaliana suggests functional diversification of chromatin modification among multicellular eukaryotes. Nucleic Acids Res 30 5036 5055
53. SpringerNM
NapoliCA
SelingerDA
PandeyR
ConeKC
2003 Comparative analysis of SET domain proteins in maize and Arabidopsis reveals multiple duplications preceding the divergence of monocots and dicots. Plant Physiol 132 907 925
54. The Arabidopsis Genome Initiative 2000 Analysis of the genome sequence of the flowering plant Arabidopsis thaliana. Nature 408 796 815
55. LanderES
LintonLM
BirrenB
NusbaumC
ZodyMC
2001 Initial sequencing and analysis of the human genome. Nature 409 860 921
56. WaterstonRH
Lindblad-TohK
BirneyE
RogersJ
AbrilJF
2002 Initial sequencing and comparative analysis of the mouse genome. Nature 420 520 562
57. AdamsMD
CelnikerSE
HoltRA
EvansCA
GocayneJD
2000 The genome sequence of Drosophila melanogaster. Science 287 2185 2195
58. MayerK
SchullerC
WambuttR
MurphyG
VolckaertG
1999 Sequence and analysis of chromosome 4 of the plant Arabidopsis thaliana. Nature 402 769 777
59. FranszP
De JongJH
LysakM
CastiglioneMR
SchubertI
2002 Interphase chromosomes in Arabidopsis are organized as well defined chromocenters from which euchromatin loops emanate. Proc Natl Acad Sci U S A 99 14584 14589
60. HansenRS
ThomasS
SandstromR
CanfieldTK
ThurmanRE
2009 Sequencing newly replicated DNA reveals widespread plasticity in human replication timing. Proc Natl Acad Sci U S A
61. SwarbreckD
WilksC
LameschP
BerardiniTZ
Garcia-HernandezM
2008 The Arabidopsis Information Resource (TAIR): gene structure and function annotation. Nucleic Acids Res 36 D1009 1014
62. CostantiniM
BernardiG
2008 Replication timing, chromosomal bands, and isochores. Proc Natl Acad Sci U S A 105 3433 3437
63. ZilbermanD
GehringM
TranRK
BallingerT
HenikoffS
2007 Genome-wide analysis of Arabidopsis thaliana DNA methylation uncovers an interdependence between methylation and transcription. Nat Genet 39 61 69
64. GendrelAV
LippmanZ
YordanC
ColotV
MartienssenRA
2002 Dependence of heterochromatic histone H3 methylation patterns on the Arabidopsis gene DDM1. Science 297 1871 1873
65. TrojerP
ReinbergD
2007 Facultative heterochromatin: is there a distinctive molecular signature? Mol Cell 28 1 13
66. XuF
ZhangK
GrunsteinM
2005 Acetylation in histone H3 globular domain regulates gene expression in yeast. Cell 121 375 385
67. DasC
LuciaMS
HansenKC
TylerJK
2009 CBP/p300-mediated acetylation of histone H3 on lysine 56. Nature 459 113 117
68. LiQ
ZhouH
WurteleH
DaviesB
HorazdovskyB
2008 Acetylation of histone H3 lysine 56 regulates replication-coupled nucleosome assembly. Cell 134 244 255
69. MasumotoH
HawkeD
KobayashiR
VerreaultA
2005 A role for cell-cycle-regulated histone H3 lysine 56 acetylation in the DNA damage response. Nature 436 294 298
70. RufiangeA
JacquesPE
BhatW
RobertF
NouraniA
2007 Genome-wide replication-independent histone H3 exchange occurs predominantly at promoters and implicates H3 K56 acetylation and Asf1. Mol Cell 27 393 405
71. WilliamsSK
TruongD
TylerJK
2008 Acetylation in the globular core of histone H3 on lysine-56 promotes chromatin disassembly during transcriptional activation. Proc Natl Acad Sci U S A 105 9000 9005
72. HubbellE
LiuWM
MeiR
2002 Robust estimators for expression analysis. Bioinformatics 18 1585 1592
73. GautierL
CopeL
BolstadBM
IrizarryRA
2004 affy—analysis of Affymetrix GeneChip data at the probe level. Bioinformatics 20 307 315
74. XieW
SongC
YoungNL
SperlingAS
XuF
2009 Histone h3 lysine 56 acetylation is linked to the core transcriptional network in human embryonic stem cells. Mol Cell 33 417 427
75. WoodfineK
BeareDM
IchimuraK
DebernardiS
MungallAJ
2005 Replication timing of human chromosome 6. Cell Cycle 4 172 176
76. BernardiG
2000 Isochores and the evolutionary genomics of vertebrates. Gene 241 3 17
77. OliverJL
Bernaola-GalvanP
CarpenaP
Roman-RoldanR
2001 Isochore chromosome maps of eukaryotic genomes. Gene 276 47 56
78. ZhangR
ZhangCT
2004 Isochore structures in the genome of the plant Arabidopsis thaliana. J Mol Evol 59 227 238
79. FriedmanKL
BrewerBJ
FangmanWL
1997 Replication profile of Saccharomyces cerevisiae chromosome VI. Genes Cells 2 667 678
80. CollinsN
PootRA
KukimotoI
Garcia-JimenezC
DellaireG
2002 An ACF1-ISWI chromatin-remodeling complex is required for DNA replication through heterochromatin. Nat Genet 32 627 632
81. FalboKB
ShenX
2006 Chromatin remodeling in DNA replication. J Cell Biochem 97 684 689
82. QuivyJP
GerardA
CookAJ
RocheD
AlmouzniG
2008 The HP1-p150/CAF-1 interaction is required for pericentric heterochromatin replication and S-phase progression in mouse cells. Nat Struct Mol Biol 15 972 979
83. VincentJA
KwongTJ
TsukiyamaT
2008 ATP-dependent chromatin remodeling shapes the DNA replication landscape. Nat Struct Mol Biol 15 477 484
84. TakebayashiS
SugimuraK
SaitoT
SatoC
FukushimaY
2005 Regulation of replication at the R/G chromosomal band boundary and pericentromeric heterochromatin of mammalian cells. Exp Cell Res 304 162 174
85. WuR
SinghPB
GilbertDM
2006 Uncoupling global and fine-tuning replication timing determinants for mouse pericentric heterochromatin. J Cell Biol 174 185 194
86. VasheeS
CveticC
LuW
SimancekP
KellyTJ
2003 Sequence-independent DNA binding and replication initiation by the human origin recognition complex. Genes Dev 17 1894 1908
87. StanojcicS
LemaitreJM
BrodolinK
DanisE
MechaliM
2008 In Xenopus egg extracts, DNA replication initiates preferentially at or near asymmetric AT sequences. Mol Cell Biol 28 5265 5274
88. SahaS
ShanY
MesnerLD
HamlinJL
2004 The promoter of the Chinese hamster ovary dihydrofolate reductase gene regulates the activity of the local origin and helps define its boundaries. Genes Dev 18 397 410
89. HarveyKJ
NewportJ
2003 CpG methylation of DNA restricts prereplication complex assembly in Xenopus egg extracts. Mol Cell Biol 23 6769 6779
90. LorinczMC
DickersonDR
SchmittM
GroudineM
2004 Intragenic DNA methylation alters chromatin structure and elongation efficiency in mammalian cells. Nat Struct Mol Biol 11 1068 1075
91. HanJ
ZhouH
HorazdovskyB
ZhangK
XuRM
2007 Rtt109 acetylates histone H3 lysine 56 and functions in DNA replication. Science 315 653 655
92. HanJ
ZhouH
LiZ
XuRM
ZhangZ
2007 The Rtt109-Vps75 histone acetyltransferase complex acetylates non-nucleosomal histone H3. J Biol Chem 282 14158 14164
93. DolbeareF
GratznerH
PallaviciniMG
GrayJW
1983 Flow Cytometric Measurement of Total DNA Content and Incorporated Bromodeoxyuridine. Proc Natl Acad Sci U S A 80 5573 5577
94. GendrelAV
LippmanZ
MartienssenR
ColotV
2005 Profiling histone modification patterns in plants using genomic tiling microarrays. Nature Methods 2 213 218
95. LippmanZ
GendrelAV
ColotV
MartienssenR
2005 Profiling DNA methylation patterns using genomic tiling microarrays. Nat Methods 2 219 224
96. Team RDC 2009 R: A language and environment for statistical computing. Vienna R Foundation for Statistical Computing
97. SmythGK
SpeedT
2003 Normalization of cDNA microarray data. Methods 31 265 273
98. SmythGK
2005 Limma: linear models for microarray data. In: Gentleman R, Carey V, Dudoit S, Irizarry R, Huber W, editors. Bioinformatics and Computational Biology Solutions using R and Bioconductor. New York Springer 397 420
99. GentlemanRC
CareyVJ
BatesDM
BolstadB
DettlingM
2004 Bioconductor: open software development for computational biology and bioinformatics. Genome Biol 5 R80
Štítky
Genetika Reprodukční medicínaČlánek vyšel v časopise
PLOS Genetics
2010 Číslo 6
Nejčtenější v tomto čísle
- Web-Based, Participant-Driven Studies Yield Novel Genetic Associations for Common Traits
- The IG-DMR and the -DMR at Human Chromosome 14q32.2: Hierarchical Interaction and Distinct Functional Properties as Imprinting Control Centers
- Cushing's Syndrome and Fetal Features Resurgence in Adrenal Cortex–Specific Knockout Mice
- Amplification of a Cytochrome P450 Gene Is Associated with Resistance to Neonicotinoid Insecticides in the Aphid