
The Transcription Factor REST Is Lost in Aggressive Breast Cancer
The function of the tumor suppressor RE1 silencing transcription factor (REST) is lost in colon and small cell lung cancers and is known to induce anchorage-independent growth in human mammary epithelial cells. However, nothing is currently known about the role of this tumor suppressor in breast cancer. Here, we test the hypothesis that loss of REST function plays a role in breast cancer. To assay breast tumors for REST function, we developed a 24-gene signature composed of direct targets of the transcriptional repressor. Using the 24 - gene signature, we identified a previously undefined RESTless breast tumor subtype. Using gene set enrichment analysis, we confirmed the aberrant expression of REST target genes in the REST–less tumors, including neuronal gene targets of REST that are normally not expressed outside the nervous system. Examination of REST mRNA identified a truncated splice variant of REST present in the REST–less tumor population, but not other tumors. Histological analysis of 182 outcome-associated breast tumor tissues also identified a subpopulation of tumors that lack full-length, functional REST and over-express the neuroendocrine marker and REST target gene Chromogranin A. Importantly, patients whose tumors were found to be REST–less using either the 24-gene signature or histology had significantly poorer prognosis and were more than twice as likely to undergo disease recurrence within the first 3 years after diagnosis. We show here that REST function is lost in breast cancer, at least in part via an alternative splicing mechanism. Patients with REST–less breast cancer undergo significantly more early disease recurrence than those with fully functional REST, regardless of estrogen receptor or HER2 status. Importantly, REST status may serve as a predictor of poor prognosis, helping to untangle the heterogeneity inherent in disease course and response to treatment. Additionally, the alternative splicing observed in REST–less breast cancer is an attractive therapeutic target.
Published in the journal:
. PLoS Genet 6(6): e32767. doi:10.1371/journal.pgen.1000979
Category:
Research Article
doi:
https://doi.org/10.1371/journal.pgen.1000979
Summary
The function of the tumor suppressor RE1 silencing transcription factor (REST) is lost in colon and small cell lung cancers and is known to induce anchorage-independent growth in human mammary epithelial cells. However, nothing is currently known about the role of this tumor suppressor in breast cancer. Here, we test the hypothesis that loss of REST function plays a role in breast cancer. To assay breast tumors for REST function, we developed a 24-gene signature composed of direct targets of the transcriptional repressor. Using the 24 - gene signature, we identified a previously undefined RESTless breast tumor subtype. Using gene set enrichment analysis, we confirmed the aberrant expression of REST target genes in the REST–less tumors, including neuronal gene targets of REST that are normally not expressed outside the nervous system. Examination of REST mRNA identified a truncated splice variant of REST present in the REST–less tumor population, but not other tumors. Histological analysis of 182 outcome-associated breast tumor tissues also identified a subpopulation of tumors that lack full-length, functional REST and over-express the neuroendocrine marker and REST target gene Chromogranin A. Importantly, patients whose tumors were found to be REST–less using either the 24-gene signature or histology had significantly poorer prognosis and were more than twice as likely to undergo disease recurrence within the first 3 years after diagnosis. We show here that REST function is lost in breast cancer, at least in part via an alternative splicing mechanism. Patients with REST–less breast cancer undergo significantly more early disease recurrence than those with fully functional REST, regardless of estrogen receptor or HER2 status. Importantly, REST status may serve as a predictor of poor prognosis, helping to untangle the heterogeneity inherent in disease course and response to treatment. Additionally, the alternative splicing observed in REST–less breast cancer is an attractive therapeutic target.
Introduction
Identification of tumor suppressors is hampered by the fact that their loss of function can occur through any one of many mechanisms including inactivating mutations, aberrant splicing and copy number aberration. Transcription factor tumor suppressors control many downstream genes in a given cell; however, using the absence or presence of a downstream gene as a proxy for loss of tumor suppressor function is problematic because each gene is likely to be regulated by multiple transcription factors. Genome-wide transcription profiling has opened up the possibility of simultaneously measuring expression levels of multiple, if not all, downstream target genes of a tumor suppressor. In this report we describe the generation of such a signature for the tumor suppressor RE1 Silencing Transcription Factor (REST Enterez GeneID 5978), also known as Neuron Restrictive Silencing Factor (NRSF), and the identification of this signature in breast cancer.
REST was originally isolated from a screen for factors that confer neuron-restricted gene expression upon neuronal genes [1], [2]. REST represses transcription by binding to the 17–33 base pair Repressor Element 1 (RE1) found in the regulatory regions of target genes [3], [4]. Around 2,000 genes in the human and mouse genomes have been identified as direct targets of REST [4], [5]. REST represses transcription by recruiting chromatin modifying enzymes such as histone deacetylases (HDACs) and histone methyltransferases (HMTs) via the N-terminal and C-terminal repression domains respectively and possesses a DNA binding domain (DBD) consisting of 8 zinc fingers[6]–[10].
Alternative splicing of REST occurs in the mouse brain during seizures and results in the expression of the truncated splice variant, REST4 [11]. The inclusion of an alternative exon into the coding region of REST results in the insertion of a premature stop codon, generating a truncated protein containing just the N-terminal repression domain and five of the eight zinc fingers. REST4 is a poor repressor of transcription because of reduced DNA binding ability and loss of at least one repression domain [8].
Splicing of REST mRNA into its REST4 form also occurs in small cell lung cancer (SCLC), resulting in the overexpression of REST target genes and imparting a neuroendocrine phenotype on the cells [12]. Re-expression of functional REST in REST4-expressing SCLC cells induces apoptosis, suggesting that suppression of REST function is key to survival of these cells [13]. In an unbiased tumor suppressor screen, REST loss conferred anchorage-independent growth upon immortalized human mammary epithelial cells [14]. The authors described a truncating point mutation that eliminates the C-terminal repression domain in colon cancer, the expression of which was sufficient to induce anchorage-independent growth. However, no role for REST in breast cancer was reported.
To determine whether the tumor suppressor REST is lost in breast cancer, we developed a gene signature-based approach to screen for loss of REST function by measuring the expression of a cohort of REST target genes. Using this gene signature as well as an immuno-histochemical screen, we show here that an aggressive subset of breast cancers lack functional REST (“REST–less tumors”), instead, often expressing the truncated REST splice variant REST4.
Results
REST expression in BC tumors
Given that loss of REST induces anchorage-independent growth in mammary epithelial cells, and is lost in colon [14] and small cell lung cancers [12], we asked whether REST also plays a role in breast cancer. REST function is regulated at multiple post-transcriptional levels during differentiation and disease [15]–[18] and so we needed a method of detecting a loss of REST function in a tumor, regardless of the underlying mechanism responsible for the loss of the tumor suppressor. To accomplish this, we developed a gene signature comprised of direct targets of REST repression with which to interrogate tumor microarray datasets to search for a loss of REST function.
There are approximately 2,000 RE1-bearing genes in the mouse and human genomes; however, not all of these genes are repressed by REST in every cell type [19], [20]. Therefore, in order to generate a gene signature with which to interrogate tumor microarrays for loss of REST function, we first sought to identify a set of REST target genes that are coordinately up-regulated when REST function is lost in multiple cell types, including tumorigenic and non-tumorigenic breast cells. To that end, we stably infected three disparate cell lines, the non-tumorigenic MCF10a mammary epithelial cell line, T47D breast cancer line and the unrelated human embryonic kidney-293 line with lentivirus expressing a non-targeting control shRNA (shCon) or an anti-REST shRNA (shREST), which resulted in the robust knockdown of REST protein (Figure 1A). RNA from shCon and shREST cells was harvested and subjected to gene expression microarray analysis. Of those genes that were up-regulated at least twofold upon REST knockdown, 93 were up-regulated in at least 2 cell lines, and 24 in all three cell lines (Figure 1B, Table S1). All of the 24 commonly upregulated genes are either known REST targets or putative REST targets as defined by the presence of a 17–33 bp REST binding element (RE1) within 12 kb of the coding region (Table S1). These genes formed the first iteration of our 24-gene signature (Figure 1B).

REST function is lost in breast cancer
Using our 24-gene signature, we screened a microarray dataset containing 129 breast tumors [21] for loss of REST function. In a subset of tumor samples, we observed a concerted over-expression of REST target genes, and designated this group as REST–less (Figure 2A). To find other genes that showed this coordinated upregulation in REST–less tumors, we screened the microarray data for transcripts differentially expressed between REST–less and full-length REST (RESTfl for REST-full-length) expressing tumors using a random-variance t-test (Figure 2B). Of the 72 genes whose expression is most closely associated with the putative REST–less tumors (p<10−7), 63 (87.5%) either contain perfect consensus RE1 sites, are upregulated two-fold or greater upon REST knockdown, or were bound by REST in a genome-wide ChIP-Seq screen performed by Johnson et al. [4] (2), suggesting that they are direct targets of REST repression. To determine whether loss of REST function occurs exclusively in neoplastic mammary tissue, we used the 24-gene signature to screen 66 non-neoplastic mammary samples, half of which came from non-tumor bearing normal breast and half of which were adjacent normal stroma from a tumor-bearing breast [22]. We found no evidence of the 24-gene signature in any of the 66 stromal samples (Figure 2C), suggesting that the carcinoma cells carry this defect in tumors.

To further test whether REST function was lost in REST–less tumors, we performed Gene Set Enrichment Analysis (GSEA) on the above breast tumors using the 24-gene signature (Figure 3A). This method compares the expression of a set of experimentally-defined REST target genes (termed “S”) between REST–less and RESTfl tumors, and assesses the relative enrichment of ‘S’ in either tumor group. The positive enrichment score obtained from these analyses, along with the low nominal P-value (p<0.001) and false discovery rate q-value (FDR q-value<0.001), are indicative of high level enrichment of REST target gene expression in the REST–less tumor subset not likely to occur by random chance. We also tested the gene set identified by the class comparison analysis (minus the 24-gene signature) using GSEA, and found that gene set to be strongly enriched in the REST–less tumor subgroup (Figure 3B). GSEA was also performed using an expanded list of genes that are at least two-fold over-expressed across the average of all three REST-knock-down cell lines (minus the 24-gene signature). This analysis found that REST–less tumors have a widespread and statistically significant loss of REST function (Figure 3C, nominal p-value<0.001, FDR q-value<0.001). Finally, we performed GSEA using an unbiased list of REST targets derived from a published ChIPSeq assay performed in a wholly different cell system, Jurkat T cells (Figure 3D)[4]. This unprejudiced approach also found that REST–less tumors, with respect to their RESTfl counterparts, are strongly enriched in the expression of REST target genes (nominal p-value<0.001, FDR q-value <0.01).

REST mRNA levels are not altered in REST–less breast cancer
We tested the possibility that the abrogation of REST function may be due to a loss of REST mRNA by comparing transcript levels in REST–less and RESTfl tumor samples. We saw no difference in REST transcript levels between the two tumor types (Figure 4A). Intriguingly, we noticed that REST mRNA levels were significantly higher in tumors than in normal tissue in three independent datasets representing over 250 normal and neoplastic tissue samples (Figure 4B). Furthermore, analysis of REST transcript levels in an additional 700 samples across multiple datasets found that REST mRNA levels are unaltered across tumors of increasing stage, grade, or likelihood to eventually relapse (Figure 4C).

REST–less tumors show increased levels of the REST splice variant REST4
Alternative splicing of REST to generate the truncated REST4 variant results in a protein with diminished DNA binding ability and loss of repressive function, and has been identified in the nervous system and in SCLC [8], [12], [23]–[25]. We therefore asked whether aberrant REST splicing could explain the loss of REST function in breast cancer. We were able to obtain RNA from two REST–less and seven RESTfl tumor samples which we amplified and interrogated for splicing by Reverse Transcription PCR using primers flanking the alternative REST4 exon. This analysis detected high levels of alternative splicing, resulting in the inclusion of the REST4 exon in REST–less tumors, which could not be detected in RESTfl tumors (Figure 5A). Selective amplification of REST4 using a primer placed in the REST4 exon confirmed the presence of the splice variant expression exclusively in the REST–less tumors (Figure 5A and 5B). Statistical analysis of these data using Fisher's exact test suggest that the presence of REST4 splicing in REST–less tumors alone was unlikely to have occurred by random chance (p<0.05). These data demonstrate that REST4 splicing is at least one mechanism by which full length REST may be lost in breast cancer.
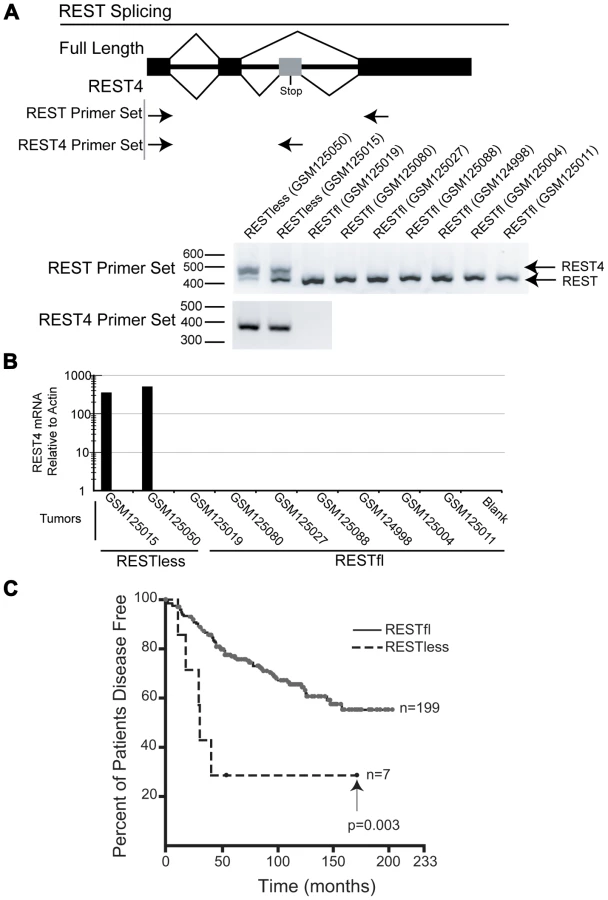
We then used the 24-gene signature to classify the breast tumor superseries GSE6532 into REST–less and RESTfl tumors and determined how REST status associated with patient outcome (Figure 5C) [26]. This analysis shows that REST–less tumors identified by the REST gene signature manifest an extremely aggressive disease progression profile (logrank p-value<0.005). In this dataset, 57% of REST–less tumors recur within 3 years, compared to 13% of RESTfl tumors. Intriguingly, the REST–less tumors identified by gene signature show no additional relapse after 3.5 years, despite high levels of early aggression.
Full-length REST is lost in breast cancer
To determine the frequency of REST protein loss in breast cancer, we developed an immunohistochemical (IHC) screen using an antibody directed to the C-terminus of REST (Atlas Antibodies, Stockholm). To test the specificity of the REST antibody, we utilized the REST-expressing breast cancer cell line MCF7. Cells were stably infected with lentiviruses bearing either non-targeting or REST-targeting shRNA (Figure 6A), then paraffin-embedded, sectioned and stained for REST C-terminus (Figure 6B). Non-targeting control shRNA expressing cells showed strong nuclear REST staining, whereas the REST knockdown cells show a severely depleted nuclear REST stain, suggesting specificity for the antibody at levels of REST observed in breast cancer cells. REST4 and the truncated form of REST identified as a SNP in colon cancer [14] are not recognized by this antibody, allowing us to identify tumors that lack full-length REST.

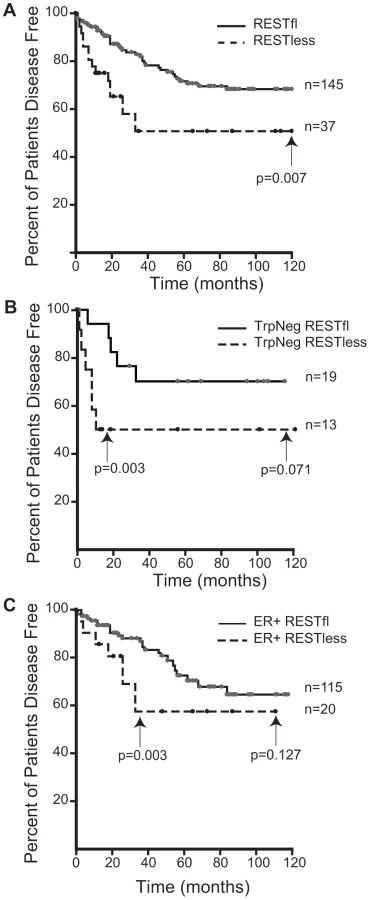
Immunohistochemical analysis of 182 breast tumors in a tissue microarray confirmed the lack of full-length (functional) REST predicted by the REST4 splicing in 37 (20.3%) tumor samples (Figure 7B). Additionally, these REST–less tumors showed a significant enrichment in staining for the ectopic expression of the REST target gene chromogranin-A (CHGA Enterez GeneID 1113), consistent with a loss of REST repression (Figure 7D, p<0.001). Importantly, we found that REST–less status correlated significantly with poor disease-free survival (Figure 8A, p = 0.007), and the average time to relapse for REST–less tumors (14 months) is less than half of that for RESTfl tumors (35.9 months p = 0.0217). REST–less tumors from this cohort have significantly increased tumor size and lymph node involvement, alongside several other markers of aggressive, treatment-resistant breast cancers summarized in Table 1. Patients with REST–less triple negative (TN) tumors (Estrogen Receptor (ER)/Progesterone Receptor/HER2-) endure significantly greater disease recurrence within 2 years than TN/RESTfl patients (50% versus 20% recurrence, p = 0.044, n = 32) (Figure 8B). Patients with REST–less ER+ breast tumors are also more prone to relapse in the first 3 years (Figure 8C, p = 0.003, n = 135). Strikingly, 100% of disease recurrence events for patients with REST–less tumors occurred in the first 36 months, compared to just 61% of all recurrence events for patients with RESTfl tumors. After 3 years there were no additional recurrences of REST–less tumors. This suggests that the loss of REST leads to a more uniquely aggressive disease that is most likely to recur within 3 years of diagnosis with no observed occurrence thereafter. Importantly, the IHC staining for REST C-terminus has the ability to identify tumors that have lost full-length REST via multiple mechanisms, including REST4 splicing, ubiquitin-mediated degradation or truncating mutation, as has been seen in colon cancer [14].


Discussion
In this study we demonstrate that REST function is lost in a fraction of breast tumors. Loss of REST is defined by either the presence of a 24 gene signature in tumors or by loss of immunohistochemical stain with a antibody raised to the C-terminus of REST. REST–less tumors (as determined by either IHC or 24-gene signature) are associated with an aggressive, rapid recurrence prognosis. At this time it is not known whether REST–less tumors defined by gene signature represent a subset of those determined to be REST–less by IHC or are a distinct group of malignancies. Answering this question will allow for the elucidation of the suite of mechanisms by which REST function can be lost in breast cancer and will require the analysis of patient cohorts that have associated patient outcome data, tissue micro-arrays as well as gene expression data.
A 24-gene signature identifies a distinct cohort of breast tumors expressing REST4
We have developed two complementary methods of screening tissue and tumors for their levels of functional REST. For samples associated with microarray data, a signature of 24 genes indicates loss of functional REST. Histological sections can be stained for the C-terminus of REST in combination with the REST target gene, chromogranin-A.
It is known that post-transcriptional regulation of REST occurs during neuronal differentiation and during oncogenic transformation such that protein levels are significantly reduced in the absence of altered mRNA levels [15], [16], [27]. These observations support our findings that REST function cannot be directly measured by its mRNA levels in breast tumor oligonucleotide arrays. However, the development of a gene signature for loss of REST in vitro allowed for the identification of a class of REST–less breast tumors. Analysis of tumors so characterized showed that REST was aberrantly spliced to generate the REST4 truncated variant. REST4 was originally identified in the hippocampii of mice after kainic acid induced seizures [23] and results in the inclusion of an alternative exon (exon ‘N’ which is 62 bp in humans) between exons V and VI of the REST transcript that encoded a stop codon and places the downstream mRNA out of frame. REST4 transcript is therefore 62 bp longer than REST transcript but REST4 protein possesses only 5 of the 8 zinc fingers in the DNA binding domain and lacks the C-terminal repression domain [6], [23]. The conversion of REST to REST4 in the hippocampus was associated with de-repression of the REST target gene BDNF.
Importantly, REST4 splicing is regulated by cell signaling pathways and in the case of seizure models, the alternative splicing of REST occurs within a limited time window before full-length, functional REST transcript splicing is restored. Indeed, in SCLC cell lines reintroduction of full-length REST induces apoptosis. Similarly, reintroduction of full-length REST into REST–less colon cancer cell lines restores anoikis, blocking anchorage-independent cell growth [14]. Therefore, we believe that the signaling pathways regulating potentially reversible REST4 splicing represent an attractive pharmacological opportunity for combating REST–less breast cancer.
Lack of REST function correlates with poor outcome
To better understand the disease course taken by REST–less tumors we took advantage of the fact that REST4 lacks the C-terminus. This allowed us to verify loss of full-length REST via an immunohistochemical screen utilizing an antibody raised to the C-terminus of REST, which will not detect REST4, degraded REST, or any previously characterized truncated mutant of REST. IHC on a panel of 182 tumor samples with associated outcome data showed that patients with REST–less tumors experience a 20% reduction in disease free survival when compared to their RESTfl counterparts over 10 years (Figure 8A). The majority of the outcome disparity between patients with REST–less and RESTfl tumors occurs in the first three years post-diagnosis in REST–less tumors identified by either the gene signature or IHC method. In both cases, at least 50% of patients with REST–less tumors showed recurrence within three years. By comparison, less than 20% of patients with RESTfl tumors showed recurrence within three years in both datasets examined. Tumors that stain negative for the REST C-terminus correlate strongly with decreased time to disease recurrence, increased tumor size, and a higher number of lymph node metastases, all of which indicate a more aggressive disease course (Table 1).
Remarkably, a subset of tumors from all histological classes of breast cancer stained negative for REST C-terminus, and all classes showed a worse prognosis without REST. REST–less triple negative tumors showed a particularly aggressive disease course. Of the 32 triple negative tumors screened, 13 were found to be REST–less, six (46%) of which recurred in the first 12 months post-diagnosis, compared to just 1 of the 19 (5%) RESTfl triple negative tumors (p = 0.003). However, no triple negative REST–less tumor recurred after 12 months in 10 years of patient outcome data. ER+ REST–less tumors showed a similar pattern of early recurrence, wherein 8 of 21 (38%) patients saw disease recurrence in the first 36 months, compared to just 11% of ER+ RESTfl patients (p = 0.003). Thereafter, none of the remaining 13 disease-free patients with ER+ REST–less tumors experienced recurrence, compared to 12 of the 102 remaining disease-free ER+ RESTfl patients. These data suggest that REST–less tumors represent a distinct, aggressive subset of breast tumors with a unique disease course.
In their recent paper, Reddy et al. examine REST levels in 19 samples of normal and neoplastic breast tissues. Using 3 control tissue samples and 16 tumors spread among 3 tumor stages, they suggest that REST protein and mRNA levels undergo a stepwise, statistically significant decrease with each increasing tumor stage [28]. We examined gene expression in over 250 samples of tumor and normal tissue in three different publicly available databases and find that breast tumors express REST mRNA at levels at or above those in normal tissue. We did not find a single tumor with REST mRNA levels lower than that of the control tissue. After further analysis of over 700 additional tumors of varying grade, stage, and eventual recurrence, we find that REST mRNA levels are invariant with any of these conventional measures of tumor aggression (Figure 4C). Reddy et al. reported that they did not observe any alternate splice variants in the tumor samples in which they find REST to be lost (Reddy et al. – data not shown). However, we have found alternative REST splicing in tumors where REST function is lost (Figure 5). The reason for these discrepancies is not clear at this time, but understanding the breadth and mechanism of REST loss in breast cancer is key to understanding its role in the disease, and thus should be based on robust and consistent data.
Breast cancer is a heterogeneous disease, with histologically identical tumors often displaying very different disease courses and responses to treatment. Unsupervised hierarchical clustering of breast tumors based on their transcriptional profiles has uncovered at least five unique subtypes of breast cancer [29]–[31]. Additionally, at least two different gene signature based molecular diagnostics (Oncotype DX and Mammaprint) are currently in use clinically to help physicians and patients predict risk of metastasis and response to treatment [32]. Importantly, the 24-gene REST gene signature does not have any genes in common with any of the above genesets, and is unique in that the cause of the gene signature is known. Understanding the origin of this unique breast cancer subtype is important, as it may lead to the development of REST-targeted therapies.
In summary, we show here that REST–less tumors represent a distinct, aggressive subset of breast tumors with a unique disease course. We find that the REST–less gene signature is closely associated with the presence of the truncated REST4 splice variant and that REST status is an important predictor of poor prognosis that correlates with increased lymph node metastasis and early disease recurrence.
Materials and Methods
Cell culture conditions
All cells were grown in 5% CO2 at 37°C. HEK-293 and MCF7 cells were grown in DMEM with 4.5 g/L glucose, 2 mM L-Glutamine, and 10% fetal bovine serum from HyClone (Logan, UT). T47D cells were grown in RPMI with L-glutamine, 10 ug/mL insulin, and 10% fetal bovine serum. MCF10a cells were grown in DMEM/F12 with 5% horse serum, 10 mg/mL insulin, 20 ng/mL epidermal growth factor, and 0.5 mg/mL hydrocortisone.
Lentiviral knockdown
Stable REST knockdown in HEK-293, T47D and MCF10a cells for microarray analysis was achieved using a Dharmacon SMARTvector lentiviral shRNA delivery system as per manufacturer's instructions. Briefly, cells were infected in the presence of 8 mg/mL polybrene at an MOI of 5 with virus expressing a non-targeting control or REST shRNA. Puromycin selection was begun 48 hours after infection and maintained during cell expansion and experimentation. SMARTvector Lentiviral Particles (catalog #SH-042194-01-25) towards REST targeted the sequence GCAAACACCTCAATCGCCA, Non-Targeting SMARTvector shRNA Lentiviral particles (catalog #S-005000-01) were used as an infection control.
Microarray data generation and processing
RNA was extracted using TRIzol (Invitrogen) as per the manufacturer's instructions from four independent plates of each cell line T47D, HEK-293 and MCF10a, with two biological replicates of cells expressing REST shRNA and another two biological replicates expressing a non-targeting control shRNA.
All RNA reverse transcription, amplification and hybridizations were performed by the University of Wisconsin-Madison Gene Expression Center (http://biotech.wisc.edu/GEC/). RNA integrity and quality were assessed by comparing 28S/18S rRNA ratio using Agilent RNANano6000 chips on an Agilent 2100 Bioanalyzer. First and second strand cDNA synthesis steps, followed by in vitro transcription, were performed using the Ambion Amino Allyl Messageamp II kit. Cy3 and Cy5 (Amersham) dyes were coupled to the aRNA, with each fluorophore labeling a separate biological replicate, before fragmentation and dual hybridization to Nimblegen HG18 60mer 385k Gene Expression Arrays (Nimblegen, Cat #A4542-00-01). For dual hybridization, shControl and shREST samples from the same cell line were competitively hybridized. Arrays were scanned on an Axon4000B and the gene expression data was extracted, and RMA normalized using software provided by Nimblegen.
Bioinformatic analyses on the microarray data were performed using BRB-ArrayTools v3.7 (developed by Dr. Richard Simon and BRB-ArrayTools Development Team) and MultiExperiment Viewer 4.5.1. Tumor gene expression data were obtained from the NCBI Gene Expression Omnibus, and are identified by their GEO dataset record number. Dataset E-TABM-276 was downloaded from the Ensembl ArrayExpress. Analysis of dataset GSE6532 was performed to determine the aggressiveness of tumors identified as being REST–less using the gene signature method. All samples from this dataset that included information on duration of relapse free survival as well as relapse event information were included in our analysis, for a total of 206 outcome-associated tumors. Hierarchical clustering was performed using a one-minus correlation metric with average linkage over centered genes. Cluster diagrams were produced using BRB Arraytools, Cluster 3.0 and TreeView software. Class comparison analysis between REST–less and RESTfl tumors was performed using a random variance model for univariate tests with a significance threshold of p<10−7 to reduce false positives.
Gene Set Enrichment Analysis (GSEA) was performed using the GSEA program provided by the Broad Institute. GSEA compares the expression of a set of experimentally defined REST target genes (termed “S”) between REST–less and RESTfl tumors, and assesses the relative enrichment of S in either tumor group. The positive enrichment scores obtained from these analyses are indicative of high level enrichment of REST target gene expression in the REST–less tumor subset. To determine whether this enrichment could arise by random chance, 1,000 permutations of the above analysis were performed with each permutation randomly assigning tumors as being either REST–less or RESTfl and then assessing enrichment in each group for S. The fraction of permutations that result in an enrichment for REST target genes in the randomly assigned “REST–less” tumor group serves as an estimate of statistical significance and is presented as a nominal p-value (Subramanian et al.PNAS 2005). Similarly, the false discovery rate (FDR) q-value is a measure of the likelihood that a geneset S may be a false positive, but this statistic is controlled for gene set size and may therefore be compared between multiple genesets with normalized enrichment scores. The list of REST target genes identified in the Johnson et al. ChIP-Seq were chosen on the basis of their enrichment in both experiments 1 and 2 in a region carrying an RE1 site with a p-value of <10−4. Genesets used in GSEA analysis are available as Table S3.
Amplifying REST4 from tumor RNA
The work with human tumor RNA was found to be exempt from institutional review by the UW institutional review board (IRB). Tumor RNA was amplified in duplicate according to the Affymetrix manual on Eukaryotic Target Preparation, Section 2.1 (https://www.affymetrix.com/support/downloads/manuals/expression_s21_manual.pdf). Briefly, a first strand of cDNA was generated from 100 ng of tumor RNA using T7-oligo(dT) primers, incubated at 70°C for 10 minutes, followed by 2 minutes on ice. A first-strand reaction mix with dNTPs, DTT and SuperScript III Reverse Transcriptase (Invitrogen) was added to each sample and incubated for an hour at 42°C, then transferred to ice. The second strand of cDNA synthesis was performed using a second-strand reaction mix, dNTPs, E. coli DNA ligase, E. coli DNA polymerase, and RNase H, and was incubated at 16°C for 2 hours. T4 DNA polymerase was added for the final 5 minutes of this incubation period, generating full-length double-stranded cDNA. The cDNA was purified on MinElute PCR purification columns (Qiagen) as per manufacturer's instructions. The Megascript T7 RNA polymerase kit (Ambion) was used to generate aRNA from the tumor cDNA as per the manufacturer's instructions. The aRNA was purified from the reaction mix using Trizol (Invitrogen) as per the manufacturer's instructions, and 500 ng of tumor aRNA was used to generate tumor cDNA using SuperScript III RT Kit (Invitrogen) as per manufacturer's instructions. This cDNA then served as a template for the PCR amplification of REST using Pfx Platinum high fidelity polymerase (Invitrogen) as per manufacturer's instructions.
Quantitative real-time PCR analysis of REST 4 was performed using a 5 ng aRNA equivalent of cDNA, the SYBR qRT-PCR System (Takara) and hREST4 Forward and hREST SV Region Reverse primers over 35 cycles.
Primers used to amplify the exon junctions surrounding introns 1 and 2:
hREST SV region forward: GAGCGAGTATCACTGGAGGAAACATTT
hREST SV region reverse: ATAGTCACATACAGGGCAATTGAACTGC
Primers used to amplify REST4:
hREST4 forward (Used with hREST SV reverse): CATTCAGTGGGGTATGGATACC
hREST4 reverse (Used with hREST SV forward): GCTTCTCACCCATCTAGATCAC
Immunohistochemistry on tissue microarray and outcome analysis
Four-micron sections of previously characterized tissue microarrays, which contain duplicate tissue cores from 207 human breast carcinomas, were used for the labeling experiments [33]. Chromogranin A labeling was performed on an automated Ventana instrument (Ventana Medical Systems, Tucson, AZ). After a standard deparaffinization procedure, epitope retrieval was performed with CC1 high-pH buffer (Ventana). In the automated protocol, the prediluted anti-chromogranin A antibody (Clone LK2H10, Ventana) was added for 32 minutes at 42°C. After addition of a universal secondary antibody, target detection was accomplished with an indirect biotin-avidin-peroxidase procedure. Labeling for REST was performed on a Lab Vision Autostainer 360. After deparaffinization, heat-induced epitope retrieval with citrate buffer and endogenous peroxidase inhibition, the slides were blocked with Background Sniper (Biocare Medical). The sections were then incubated with rabbit anti-REST antibody (HPA006079, Sigma-Aldrich) at a concentration of 0.5 µg/ml for 60 minutes. After washing, the Mach 3 detection system (Biocare Medical) was applied. The labeling reaction was manually scored by a board-certified pathologist (AF) for the cytoplasmic and nuclear carcinoma cell compartments, using the method described by Harvey and colleagues [34].
Kaplan Meier plots were generated using SigmaStat 3.0, and Kaplan Meier curves were compared using the logrank test. We report as significant only those curves that have reached a level of p≤0.05. Correlations between REST status and disease parameters were tested using Pearsons Chi-squared test, and are reported as significant p≤0.05.
Supporting Information
Zdroje
1. ChongJA
Tapia-RamirezJ
KimS
Toledo-AralJJ
ZhengY
1995 REST: a mammalian silencer protein that restricts sodium channel gene expression to neurons. Cell 80 949 957
2. SchoenherrCJ
AndersonDJ
1995 The neuron-restrictive silencer factor (NRSF): a coordinate repressor of multiple neuron-specific genes. Science 267 1360 1363
3. SchoenherrCJ
PaquetteAJ
AndersonDJ
1996 Identification of potential target genes for the neuron-restrictive silencer factor. Proc Natl Acad Sci U S A 93 9881 9886
4. JohnsonDS
MortazaviA
MyersRM
WoldB
2007 Genome-wide mapping of in vivo protein-DNA interactions. Science 316 1497 1502
5. BruceAW
DonaldsonIJ
WoodIC
YerburySA
SadowskiMI
2004 Genome-wide analysis of repressor element 1 silencing transcription factor/neuron-restrictive silencing factor (REST/NRSF) target genes. Proc Natl Acad Sci U S A 101 10458 10463
6. Tapia-RamirezJ
EggenBJ
Peral-RubioMJ
Toledo-AralJJ
MandelG
1997 A single zinc finger motif in the silencing factor REST represses the neural-specific type II sodium channel promoter. Proc Natl Acad Sci U S A 94 1177 1182
7. HuangY
MyersSJ
DingledineR
1999 Transcriptional repression by REST: recruitment of Sin3A and histone deacetylase to neuronal genes. Nat Neurosci 2 867 872
8. RoopraA
SharlingL
WoodIC
BriggsT
BachfischerU
2000 Transcriptional repression by neuron-restrictive silencer factor is mediated via the Sin3-histone deacetylase complex. Mol Cell Biol 20 2147 2157
9. RoopraA
QaziR
SchoenikeB
DaleyTJ
MorrisonJF
2004 Localized domains of G9a-mediated histone methylation are required for silencing of neuronal genes. Mol Cell 14 727 738
10. DingN
ZhouH
EstevePO
ChinHG
KimS
2008 Mediator links epigenetic silencing of neuronal gene expression with x-linked mental retardation. Mol Cell 31 347 359
11. PalmK
MetsisM
TimmuskT
1999 Neuron-specific splicing of zinc finger transcription factor REST/NRSF/XBR is frequent in neuroblastomas and conserved in human, mouse and rat. Brain Res Mol Brain Res 72 30 39
12. CoulsonJM
EdgsonJL
WollPJ
QuinnJP
2000 A splice variant of the neuron-restrictive silencer factor repressor is expressed in small cell lung cancer: a potential role in derepression of neuroendocrine genes and a useful clinical marker. Cancer Res 60 1840 1844
13. Gurrola-DiazC
LacroixJ
DihlmannS
BeckerCM
von Knebel DoeberitzM
2003 Reduced expression of the neuron restrictive silencer factor permits transcription of glycine receptor alpha1 subunit in small-cell lung cancer cells. Oncogene 22 5636 5645
14. WestbrookTF
MartinES
SchlabachMR
LengY
LiangAC
2005 A Genetic Screen for Candidate Tumor Suppressors Identifies REST. Cell 121 837 848
15. BallasN
GrunseichC
LuDD
SpehJC
MandelG
2005 REST and its corepressors mediate plasticity of neuronal gene chromatin throughout neurogenesis. Cell 121 645 657
16. WestbrookTF
HuG
AngXL
MulliganP
PavlovaNN
2008 SCFbeta-TRCP controls oncogenic transformation and neural differentiation through REST degradation. Nature 452 370 374
17. ZuccatoC
TartariM
CrottiA
GoffredoD
ValenzaM
2003 Huntingtin interacts with REST/NRSF to modulate the transcription of NRSE-controlled neuronal genes. Nat Genet 35 76 83
18. Garriga-CanutM
SchoenikeB
QaziR
BergendahlK
DaleyTJ
2006 2-Deoxy-D-glucose reduces epilepsy progression by NRSF-CtBP-dependent metabolic regulation of chromatin structure. Nat Neurosci 9 1382 1387
19. BelyaevND
WoodIC
BruceAW
StreetM
TrinhJB
2003 Distinct RE1 silencing transcription factor (REST)-containing complexes interact with different target genes. J Biol Chem
20. JohnsonR
TehCH
KunarsoG
WongKY
SrinivasanG
2008 REST regulates distinct transcriptional networks in embryonic and neural stem cells. PLoS Biol 6 e256 doi:10.1371/journal.pbio.0060256
21. LuX
WangZC
IglehartJD
ZhangX
RichardsonAL
2008 Predicting features of breast cancer with gene expression patterns. Breast Cancer Res Treat 108 191 201
22. FinakG
SadekovaS
PepinF
HallettM
MeterissianS
2006 Gene expression signatures of morphologically normal breast tissue identify basal-like tumors. Breast Cancer Res 8 R58
23. PalmK
BelluardoN
MetsisM
TimmuskT
1998 Neuronal expression of zinc finger transcription factor REST/NRSF/XBR gene. J Neurosci 18 1280 1296
24. ShimojoM
PaquetteAJ
AndersonDJ
HershLB
1999 Protein kinase A regulates cholinergic gene expression in PC12 cells: REST4 silences the silencing activity of neuron-restrictive silencer factor/REST. Mol Cell Biol 19 6788 6795
25. TimmuskT
PalmK
LendahlU
MetsisM
1999 Brain-derived neurotrophic factor expression in vivo is under the control of neuron-restrictive silencer element. J Biol Chem 274 1078 1084
26. LoiS
Haibe-KainsB
DesmedtC
LallemandF
TuttAM
2007 Definition of clinically distinct molecular subtypes in estrogen receptor-positive breast carcinomas through genomic grade. J Clin Oncol 25 1239 1246
27. GuardavaccaroD
FrescasD
DorrelloNV
PeschiaroliA
MultaniAS
2008 Control of chromosome stability by the beta-TrCP-REST-Mad2 axis. Nature 452 365 369
28. ReddyBY
GrecoSJ
PatelPS
TrzaskaKA
RameshwarP
2009 RE-1-silencing transcription factor shows tumor-suppressor functions and negatively regulates the oncogenic TAC1 in breast cancer cells. Proc Natl Acad Sci U S A 106 4408 4413
29. PerouCM
JeffreySS
van de RijnM
ReesCA
EisenMB
1999 Distinctive gene expression patterns in human mammary epithelial cells and breast cancers. Proc Natl Acad Sci U S A 96 9212 9217
30. SorlieT
PerouCM
TibshiraniR
AasT
GeislerS
2001 Gene expression patterns of breast carcinomas distinguish tumor subclasses with clinical implications. Proc Natl Acad Sci U S A 98 10869 10874
31. VendrellJA
RobertsonKE
RavelP
BraySE
BajardA
2008 A candidate molecular signature associated with tamoxifen failure in primary breast cancer. Breast Cancer Res 10 R88
32. MorrisSR
CareyLA
2007 Gene expression profiling in breast cancer. Curr Opin Oncol 19 547 551
33. BabaF
SwartzK
van BurenR
EickhoffJ
ZhangY
2006 Syndecan-1 and syndecan-4 are overexpressed in an estrogen receptor-negative, highly proliferative breast carcinoma subtype. Breast Cancer Res Treat 98 91 98
34. HarveyJM
ClarkGM
OsborneCK
AllredDC
1999 Estrogen receptor status by immunohistochemistry is superior to the ligand-binding assay for predicting response to adjuvant endocrine therapy in breast cancer. J Clin Oncol 17 1474 1481
Štítky
Genetika Reprodukční medicínaČlánek vyšel v časopise
PLOS Genetics
2010 Číslo 6
Nejčtenější v tomto čísle
- Web-Based, Participant-Driven Studies Yield Novel Genetic Associations for Common Traits
- The IG-DMR and the -DMR at Human Chromosome 14q32.2: Hierarchical Interaction and Distinct Functional Properties as Imprinting Control Centers
- Cushing's Syndrome and Fetal Features Resurgence in Adrenal Cortex–Specific Knockout Mice
- Amplification of a Cytochrome P450 Gene Is Associated with Resistance to Neonicotinoid Insecticides in the Aphid