
The Fitness Landscapes of -Acting Binding Sites in Different Promoter and Environmental Contexts
The biophysical nature of the interaction between a transcription factor and its target sequences in vitro is sufficiently well understood to allow for the effects of DNA sequence alterations on affinity to be predicted. But even in relatively simple in vivo systems, the complexities of promoter organization and activity have made it difficult to predict how altering specific interactions between a transcription factor and DNA will affect promoter output. To better understand this, we measured the relative fitness of nearly all Escherichia coli binding sites in different promoter and environmental contexts by competing four randomized promoter libraries controlling the expression of the tetracycline resistance gene (tet) against each other in increasing concentrations of drug. We sequenced populations after competition to determine the relative enrichment of each −35 sequence. We observed a consistent relationship between the frequency of recovery of each −35 binding site and its predicted affinity for that varied depending on the sequence context of the promoter and drug concentration. Overall the relative fitness of each promoter could be predicted by a simple thermodynamic model of transcriptional regulation, in which the rate of transcriptional initiation (and hence fitness) is dependent upon the overall stability of the initiation complex, which in turn is dependent upon the energetic contributions of all sites within the complex. As implied by this model, a decrease in the free energy of association at one site could be compensated for by an increase in the binding energy at another to produce a similar output. Furthermore, these data show that a large and continuous range of transcriptional outputs can be accessed by merely changing the , suggesting that evolved or engineered mutations at this site could allow for subtle and precise control over gene expression.
Published in the journal:
. PLoS Genet 6(7): e32767. doi:10.1371/journal.pgen.1001042
Category:
Research Article
doi:
https://doi.org/10.1371/journal.pgen.1001042
Summary
The biophysical nature of the interaction between a transcription factor and its target sequences in vitro is sufficiently well understood to allow for the effects of DNA sequence alterations on affinity to be predicted. But even in relatively simple in vivo systems, the complexities of promoter organization and activity have made it difficult to predict how altering specific interactions between a transcription factor and DNA will affect promoter output. To better understand this, we measured the relative fitness of nearly all Escherichia coli binding sites in different promoter and environmental contexts by competing four randomized promoter libraries controlling the expression of the tetracycline resistance gene (tet) against each other in increasing concentrations of drug. We sequenced populations after competition to determine the relative enrichment of each −35 sequence. We observed a consistent relationship between the frequency of recovery of each −35 binding site and its predicted affinity for that varied depending on the sequence context of the promoter and drug concentration. Overall the relative fitness of each promoter could be predicted by a simple thermodynamic model of transcriptional regulation, in which the rate of transcriptional initiation (and hence fitness) is dependent upon the overall stability of the initiation complex, which in turn is dependent upon the energetic contributions of all sites within the complex. As implied by this model, a decrease in the free energy of association at one site could be compensated for by an increase in the binding energy at another to produce a similar output. Furthermore, these data show that a large and continuous range of transcriptional outputs can be accessed by merely changing the , suggesting that evolved or engineered mutations at this site could allow for subtle and precise control over gene expression.
Introduction
While we have a reasonable understanding of the biophysical forces that determine the affinity of a transcription factor to its target sequences [1]–[4], we still have a poor understanding of how the affinity of a factor for a site affects the output of the promoter in which it sits. The major challenge is that these relationships are highly context dependent. A high affinity site tightly bound in isolation will have no function in that it will not affect the rate of transcription of a gene, whereas a low affinity site weakly bound in the context of the initiation complex will. More subtly, a single base pair difference in the spacing between sites can affect the function of those sites [5], [6]. Here, we attempt to better understand how binding site affinity and context relate to promoter output by determining the relative fitness of binding sites within specific variations of an engineered promoter in the bacteria Escherichia coli.
The engineered promoter that we use contains three binding sites: one for the transcriptional activator MarA [6], and another for the and the that are recognized by [7]. In the simplest thermodynamic model of transcriptional regulation in prokaryotes, the rate of transcriptional output varies as a direct function of the stability of the initiation complex [8]–[11]. The stability of the initiation complex in turn is dependent upon the cooperative binding of multiple DNA-binding transcription factors, each of which recognizes a degenerate set of sequences with different affinities [4]. The binding strengths of these sites are distributed such that there is a single optimal site that is bound with the highest affinity (the consensus site) and an increasing number of sequences that are bound with lower affinities as the sequences deviate from the consensus [1]–[3]. At some point the deviation becomes so great, that the site is no longer specifically bound and all remaining sequences have the same non-specific binding energy. The general assumption has been that the greater the affinity that the factor has for a site, the greater the occupancy at that site and the greater the probability that it will affect transcription [10]. This has only recently been tested for large libraries of sequences, and indeed much of the variance in expression can be explained by differences in binding site affinity [12]. Given this relationship, the distribution of binding energies for a factor defines the range of regulatory phenotypes that can be selected [2], [13], the number of possible DNA sequences that can be used to generate that phenotype, and subsequently the likelihood of a sequence of that strength evolving.
How multiple binding sites combine to determine the stability of the initiation complex is poorly understood, mainly because there are a large number of proteins that can cooperate to regulate transcription through a variety of mechanisms [9], [14], including direct stabilization or destabilization of the initiation complex through protein-protein interactions or occlusion [15], [16] or by perturbations of DNA structure that affect promoter-DNA binding [17], [18]. MarA has been shown to modulate transcription through multiple mechanisms depending on its binding context [6]. Here we use MarA as a Class I activator that increases the rate of expression by stabilizing interactions with the carboxy-terminal domain of the alpha subunit (CTD) [6], [9], [19]. The ordering, spacing and orientation of binding sites can also mediate transcriptional regulation [11], [20]. Differences in the spacing between the and the [5], [21] and between MarA and the have been shown to affect the rate of transcription [6].
Here, we examine the effects of varying a binding site on promoter output by measuring the relative fitness of binding sites in different promoter and environmental contexts. To do this we placed the tetracycline resistance gene under control of the MarA-activated promoter on the plasmid pBR322. We generated four libraries that contained different strength and MarA binding sites, to yield four varied energetic contexts for selection. By increasing the tetracycline concentration, we can change the range of selected viable transcriptional outputs. We competed variants within a library in liquid culture for 24 hours, and sequenced the competed population with an Illumina Solexa sequencer. Using this approach, we were able to map the fitness of a large population of binding sites in multiple promoter and environmental contexts relatively easily.
Results
Selection system
We generated four plasmid libraries that contained the tetracycline resistance gene (tet) under the control of a MarA-activated promoter with a randomized binding site. Each library contained a different combination of and MarA binding sites (Figure 1). The was either the consensus (TATAAT) or the weaker variant (TTTAAT). The MarA binding site was either the one that regulates the mar operon [22], or the anti-consensus site, which is not expected to bind or be activated by MarA. We will refer to each library based on which MarA binding site (Mar or Anti), and which binding site (TAT or TTT) it contains. The four libraries therefore are named Mar:TAT, Anti:TAT, Mar:TTT and Anti:TTT.

To test the dependency of cell growth in tetracycline on the sequence at the , we created promoters that contained either the consensus TTGACA or the anti-consensus GCCGGC in the Mar:TTT context. The anti-consensus site did not allow growth at as low as 5 g/ml of tetracycline, where the consensus allowed for growth in tetracycline concentrations at least as high as 100 g/ml suggesting that cell survival is dependent upon the binding site (data not shown).
binding site competitions
Promoter competitions were performed as described in Materials and Methods. Briefly we transformed each library into E. coli cells and grew the cells overnight. The following morning, fresh LB cultures containing increasing concentrations of tetracycline were inoculated with the overnight cultures. Cells were competed for 24 hours and the competed populations were sequenced on a Solexa sequencer to determine the relative frequency of each hexamer. We sequenced 24 competed populations that covered 20 distinct selection conditions. Each competed population is named based on the competed library and on the concentration of tetracycline used in the competition. We carried out two independent competitions with the Mar:TAT and Mar:TTT libraries. The first was performed over the range of 5 to 30 g/ml tetracycline. We expanded the range to 50 g/ml tetracycline for all other experiments. To distinguish between different competitions with the same library, each culture that came from the same starter is given a common number (1 or 2). For example, Mar:TAT Tet-5 (1) and Mar:TAT Tet-10 (1) came from the same Mar:TAT overnight culture, but Mar:TAT Tet-50 (2) came from a different one.
The number of sequencing reads are given in Table S1. Differences in read numbers are most likely a result of sample loss in the Solexa prep and to the lower cell density in higher tetracycline concentrations, especially with libraries containing the TTT . All but four of the sequenced competed populations had at least 25,000 reads. As expected, Mar:TAT Tet-5 (1) was the most variable, and appeared to show only a slight preference for the sequence at the binding site. We observed 3918 of the 4096 possible hexamers in this population, suggesting that the coverage of all sequences in our library is essentially complete.
We sequenced Anti:TAT Tet-5 (1) and Mar:TTT Tet-5 (2) on two independent sequencing runs to determine if the number of sequenced DNA molecules gave an accurate and reproducible representation of the competed promoter populations. These runs generated 29,803 and 93,863 reads for the Anti:TAT Tet-5 (1) library and 33,229 and 11,263 reads for the Mar:TTT Tet-5 (2) library. We compared the relative frequency of each as determined from sequencing run 1 against run 2 and observed an for both samples (data not shown). This suggested that for the more degenerate TAT libraries, as few reads sufficiently covers the distribution of binding sites. As few as reads are sufficient for the TTT libraries.
Sequence logos are shown for the population of binding sites from each promoter context at 5, 10, 20 and 50 g/ml tetracycline (Figure 2). Logos generated from the Mar:TAT (1) and Mar:TTT (1) competitions over the smaller range of 5 to 30 g/ml were similar (data not shown). We observed a decrease in the variability for each library as the amount of tetracycline used for selection was increased, with the population converging towards the consensus binding site TTGACA, suggesting that only stronger sites (those closer to the consensus) are viable under more stringent selection conditions. We observed a similar decrease in variability as we decreased the energetic contribution of the other components in the promoter, strongly suggesting that a decrease in the affinity of the or MarA binding sites can be compensated by an increase in the strength of the . The single base-pair mutation in the had a major effect on the population variability. Whereas completely destroying the MarA binding site by replacing it with the anti-consensus affected the population variability considerably less.

For most populations, the first position of the hexamer is the least variable, and the site increases in variability towards the end. The first three positions are much more conserved than the last three, and position 6 appears to be relatively non-specific for most populations. This is consistent with the logo made from naturally occurring sites [11]. Only at the most stringent selective condition (Anti:TTT Tet-50) does the consensus sequence dominate.
We compared the information content () [23] for each competed population as a function of tetracycline concentration for the Mar:TAT and Mar:TTT libraries (Figure 3). This figure includes data for both competition series with these libraries. Both libraries show a linear increase in information content from 5 to 30 g/ml, with a leveling at 50 g/ml. As apparent from the sequence logos in Figure 2, the information content of the Mar:TTT library is much greater than that of the Mar:TAT library at all concentrations of tetracycline, suggesting that a weaker needs to be compensated for by a stronger for the promoter to be viable. Duplicate selections at 5 and 10 g/ml showed similar information contents for both libraries.

fitness as a function of binding affinity
We predicted the relative affinity () of to each using the information theory based approach described in [2], [4] and the model presented in [11] (see Materials and Methods). The sites ranged in strength from to bits of information. Conventionally, sites with more than 0 bits are thought to be specifically bound [24]. 418 of the 4096 binding sites were bits. The relative fitness of each in the population was calculated by dividing the number of occurrences of that by the number of occurrences of the most frequently observed . We ranked all binding sites according to their , and compared the relative frequency for each in each experiment in Figure 4, and only those sites with an bits in Figure S1.

The majority of hexamers were present in all libraries that contained the sequence TATAAT. As seen in Figure 2, there is a decrease in the variability of observed binding sites as we increased the concentration of tetracycline used in selection and as the strengths of the and MarA sites are decreased in the promoter. We also observed a convergence of the viable sites towards those with higher information (sites closer to the consensus sequence).
Several competitions contained scattered low affinity sites with significantly higher fitness than the sites around them. We ordered all hexamers alphabetically (AAAAAA, AAAAAC, AAAAAG … TTTTTT) to see if there were sets of binding sites close in sequence space that had a high relative fitness, but not a high predicted affinity (Figure S2). We identified clusters of hexamers that contained a strong shifted one base to right (orange boxes in Figure S2 and Figure 5). That is, the second base of the randomized hexamer was the first base of the binding site. Differences in spacing between the and have been shown to affect the rate of initiation [5]. We tried to limit the number of binding sites with sub-optimal spacings from our libraries by placing bases disfavored by the model at the positions flanking the randomized hexamer [11] (see Materials and Methods). Since the last two bases of the hexamer are fairly non-specific, it is difficult to exclude viable s with shorter spacings.

The fitnesses of the binding sites were reduced at shorter spacings compared to the larger optimal spacing, and only the strongest sites were viable and only under the mildest selection conditions (Figure 5). To quantify this, we calculated the average relative fitness of four sets of hexamers that had shifted binding sites (Table 1). These sets of binding sites contained the 16 sites that had the consensus ‘TTG’ at the first three positions (positions 2–4 of the randomized hexamer) and a ‘G’ at the sixth position (TTGNNG). This ‘G’ is the base immediately of the randomized region, and is therefore fixed. The four sets only varied in which base was of the , and should be the highest affinity sites at this spacing according to the binding site model [11]. The average relative fitness was calculated across all experiments for these sequences (Table 1). The four sets had a similar average fitness to each other and a significantly higher fitness relative to 100,000 randomly chosen 16 hexamers (p), but on average were half as fit as the same set of sites at the optimal spacing (TTGNNG) and one third as fit as the 16 binding sites closest to the consensus (TTGANN) (Table 1).

To directly compare sequence activity to and relative fitness, we measured the transcriptional output of 8 binding sites in the Mar:TTT promoter context and 7 in the Mar:TAT context by quantitative PCR (Figure 6). The sequences of these sites, their predicted affinities and their transcriptional activities are reported in Table 2. For both libraries, output generally increased with . The data was best fit by a single exponential curve, but weakly; and for Mar:TTT and Mar:TAT respectively (these values were only calculated for sites with an bits) (Figure 6A). Sites similar in sequence produced almost equivalent outputs. In the Mar:TTT context, TTGCGT, TTGCAG and TTGCTT vary only at their last two bases, and have similar activities (Table 2). In the Mar:TAT context, TGGAGC and TGGCTA vary at the last three bases and have the same output, and TTGCTC, TTGATG and TTGCTT have similar outputs. We suspect the model is slightly overestimating the contributions of the last 3 bases of the hexamer, and this can account for inconsistencies between our predicted affinity and transcriptional output.


Expression from the Mar:TAT context was much greater than from the Mar:TTT context. The weak TAGACG in conjunction with the consensus TATAAT produced an output greater than the strongest that we assayed in the Mar:TTT context, TTGACT. Additionally, the activity of the same sequence (TTGCTT) in both contexts was 2.8 fold greater with the stronger . As seen in Figure 2 and Figure 3, these results indicate that differences in the have a significant effect on transcriptional activity.
Two of the binding sites in the Mar:TTT context had an bits, and both produced the same weak expression level (Table 2). We expect all non-specifically bound s to have this same output. One of these sites (CTTGAC) contained a strong that was shifted one base closer to the , but showed no activity (blue triangle in Figure 6). Additionally, we characterized two hexamers in the Mar:TAT context with an bits. One of these sequences (CCGTTC) showed a significantly reduced output relative to all other Mar:TAT sequences, but a high output relative to the Mar:TTT sequences. We expect this to be the transcriptional output for all non-specific s in this context. The other sequence (CTTGCC) contained a strong that was shifted one base to the right (orange triangle in Figure 6), but unlike the shifted site in the Mar:TTT context displayed high activity. This suggests that s with shorter spacings are only functional with the stronger , as seen in Figure 5.
There was a strong correspondence between transcriptional output and relative fitness for the 8 characterized s in the Mar:TTT context (Figure 6B). At 5 g/ml of tetracycline, fitness increased as a function of output for the 5 lowest expressing s and then slightly decreased for the 3 highest expressing. At 10 g/ml, the increase in fitness extended to all but the strongest , and at 20 and 50 g/ml, fitness increased with output for all sequences. The cellular advantage for producing more of the tetracycline resistance protein may be outweighed by the cellular cost in low concentrations of drug [25]. This may explain this decrease in the overall fitness at greater outputs. The relationship between output and fitness for the Mar:TAT characterized s was less striking (Figure 6C). At 5 and 10 g/ml of tetracycline, we observed an initial increase in fitness from the lowest to the second lowest expressing , and then no consistent trend. It is important to note that the differences in fitness between variants in this context are relatively small, especially compared to the Mar:TTT examples, and there could possibly be no effect on fitness at these high expression levels in these low concentrations of drug. More data points are needed to determine this. At 20 and 50 g/ml of tetracycline, we observed a general increase in fitness with output. Unlike in the Mar:TTT context, there was a gradual increase in fitness across these sites.
Fitness landscapes for individual hexamers across 16 different conditions are shown in Figure 7. We chose a series of five hexamers that decrease in predicted binding affinity from the consensus TTGACA, and differ from their neighboring sequence by a single nucleotide mutation. We also show a fitness landscape for the anti-consensus binding site GCCGGC. As expected the anti-consensus is not viable under any condition. There is an interesting contrast in the fitness landscape of the consensus sequence (TTGACA) to the weaker site TTGTTG. The consensus sequence shows a general increase in fitness to more stringent selective conditions, with a relatively low fitness in weak selective conditions. Conversely, TTGTTG is most fit in the weakest conditions and not viable at stringent conditions. TTGACG like TTGACA shows low fitness in the TATAAT libraries, but has a greater fitness for most of the selections with the weaker TTTAAT binding site, except for the most stringent. The fitness profile for TTGATG is weaker than expected for a site of that strength suggesting that its actual affinity may be lower than predicted. Regardless of our prediction of site strength, the difference between the TTGACG and TTGATG landscapes is large, illustrating how a single nucleotide mutation can radically change the fitness landscape of a binding site.

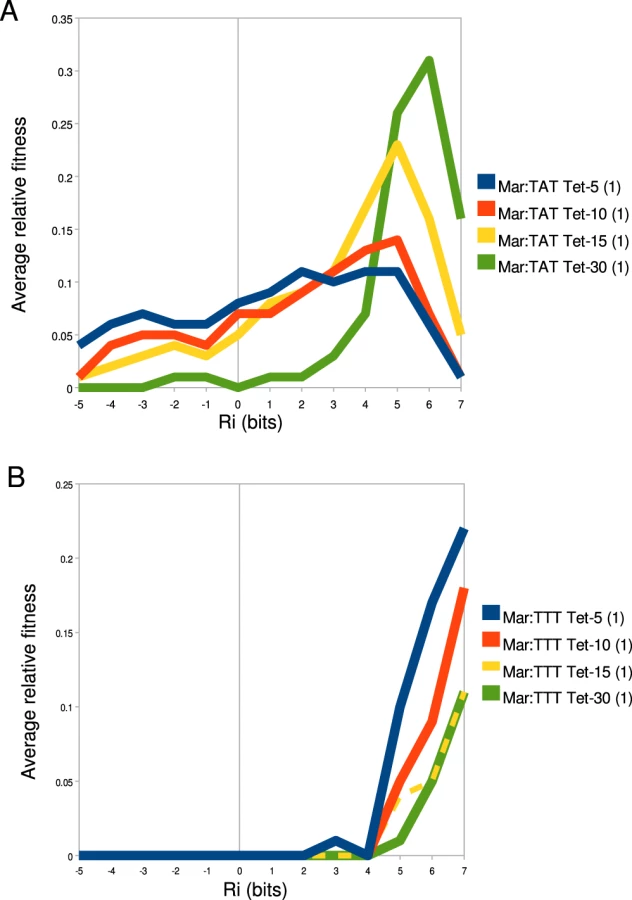
To better understand how binding site strength correlates with relative fitness in different promoter and environmental contexts, we calculated the average relative fitness for all sites within 1 bit bins (Figure 8). For the Mar:TAT library (Figure 8A), we observed that the range that has the greatest average fitness is not the highest one. We did observe an increase in the strength of the optimal fitness range as we increased the selection concentration of tetracycline, but for all tetracycline concentrations we saw a decrease in fitness at the highest range of binding sites. For the Mar:TTT library, we observed a general increase in relative fitness as a function of binding site strength for all tetracycline concentrations. Interestingly we did not observe the decrease here as we observed in Figure 6B. We did observe a similar decrease in fitness at higher information sites for the Anti:TAT library at 5 g/ml tetracycline, but not at higher concentrations. The Anti:TTT library only showed an increase in fitness at higher binding site strengths (data not shown).
Discussion
To decipher cis-regulatory information and subsequently understand how it evolves, we need to be able to experimentally associate expression phenotype to genotype for large libraries of sequences. While there has been some success in doing this [12], these datasets are still extremely challenging to generate because it is difficult to maintain genotypic information in bulk reactions, requiring a large number of independent assays. Here we were able to overcome this problem by measuring the abundance of a genotype in a competed population of promoters, where cellular fitness is a function of its transcriptional phenotype (production of the tet gene). Given a mapping of phenotype to genotype for large libraries of sequences, it is still difficult to parse out the effects of single nucleotide differences on transcription since the rate of initiation is dependent upon many variables. Here we reduced this problem by generating libraries of promoters that only differ by the sequence of a single binding site (the ). The method worked well. For the first time, we were able to generate experimentally determined fitness landscapes for a large set of sequences in multiple promoter and environmental contexts. These data give insight into both the mechanism and evolution of transcriptional regulation at the level of an individual binding site.
Promoter fitness varies as a function of binding site strength
The fitness of the transcriptional output of a binding site is a complex function of the cellular gain and cost associated with the production of expressed gene [25]. The cellular gain in our synthetic system is the increased ability to export tetracycline from the cell. The cellular cost is the toxic effect of over-expressing the tetracycline efflux pump [26], [27]. While we do not fully understand the absolute relationship between binding site strength, transcriptional output and the fitness of that output, clearly these things are related (Figure 8, Figure 6) and highly context dependent (Figure 7).
The relative frequency of recovery of a binding site in a competed population is dependent upon two variables, (Minimum Viable Stability) and (Optimal Stability). is the minimum stability of the initiation complex needed to produce enough of the tet gene to survive. is the stability of the initiation complex that produces the maximally fit output given a concentration of tetracycline. For a to be viable in our selection, it must have an affinity that in combination with the other binding sites produces an initiation complex stability that is stronger than . As the strength of the other sites or the output requirement changes, so does the boundary of the minimum viable binding site strength. This is indeed what we observe in Figure 4 and Figure S1. As we increased the concentration of tetracycline (decrease ) or as we decreased the strength of the or MarA binding sites, only stronger s remained in the selected population. This is also illustrated in Figure 2 and Figure 3 as a decrease in the variability of the population and a convergence on the consensus sequence at more stringent (energetically demanding) selection conditions. Compensation in binding energies between sites to produce similar stabilities has been previously predicted computationally for binding sites [11] and is shown clearly here. Interestingly, the information content of the competed populations increases linearly as a function of tetracycline concentration over the range of 5 to 30 g/ml and levels off at 50 g/ml for both the Mar:TTT and Mar:TAT libraries (Figure 3). We are not sure why the information content levels off. One possibility is that we are approaching the maximum stability where the transcriptional initiation rate is limited by the stability of the closed complex.
The most fit in a given context should have an affinity, that in combination with the other binding sites, equals . We expect that fitness will increase with the overall stability of the initiation complex from to . We observe this qualitatively for libraries containing the weaker TTTAAT binding site or libraries selected at high concentration of tetracycline. Here, sites generally increase in fitness as a function of binding site strength (Figure 4, Figure S1). Some sequences show an unexpected high or low fitness compared to their neighboring sequences with similar predicted affinities. These could be partially explained by insufficient sequencing depth, but we expect to a small degree since technical replicates suggest that for most conditions our depth gives an accurate representation of the population. Another possibility could be that some promoters may be under or over-represented in the initial library. We expect that to some extent these discrepancies are due to inaccuracies in the binding model that we used. A comparison between and transcriptional output suggests that the model may be slightly overestimating the energetic contributions of the last three bases of the hexamer to binding site strength (Figure 6). A large number of sequence anomalies can also be attributed to binding sites with shifted spacings relative to the (Figure 5).
When the average fitness is calculated for binding sites with similar affinities (reducing the effects of anomalous s), we see a smooth relationship between fitness and binding site strength (Figure 8). In strong selection conditions (high tetracycline concentration, weak ), exceeds the maximum stability that can be accessed by only varying the binding site, so here an increase in binding affinity always increases fitness (Figure 6B and 6C, Figure 8B). In weak selection conditions (low tetracycline, strong ), the optimal binding site does not appear to be the strongest (Figure 6B, Figure 8A). That is, is within the range of affinities that can be accessed by changing the . The additional energy from the presumably shifts the distribution of outputs for the binding sites into a range where there is no longer an increased advantage or even a disadvantage for transcribing that much tet.
Overall, we observed a large and continuous range of fitnesses suggesting a similar scope of potential outputs can be evolved or engineered by solely mutating the . Fitness landscapes of individual sequences illustrate the large effect on fitness by even a single mutation (Figure 7). It is not clear what the maximum stability of the initiation complex is where increases in stability will no longer increase output (closed-complex stability is not limiting). It has been shown for some promoters that too strong of an interaction can actually decrease transcriptional output, presumably because it is difficult for the polymerase to dissociate from the DNA [28]. A decrease in fitness from the highest affinity consensus binding site compared to a single base pair mutation of the consensus in the Anti:TTT context (Figure 7), suggests that the range of affinities of binding sites alone does not exceed that maximum. There may have been selection on to keep the range of affinities below this maximum, to maximize its output range.
Binding sites do not contribute equally to the fitness of the promoter
The relative contributions of the and MarA binding sites do not appear to be equivalent. A single mutation in the second position of the consensus greatly reduces the variability of the binding site populations. Whereas completely removing the MarA binding site has a significantly reduced effect. This suggests that binding at the contributes more to the stability of the initiation complex than does binding by MarA. The decrease in effect from the MarA site could be related to the energetics in the contact with the CTD which we do not understand [11], or MarA expression could be low resulting in a low occupancy of the site.
The significant effect of mutating the on transcript production is clearly shown in Figure 6A. The expression levels of all s in the Mar:TAT context, except for the non-specifically bound one, are greater than the expression from the most active in the Mar:TTT context that we characterized. This suggests that differences in the may contribute more than differences in the to the overall output. Open complex formation occurs through melting at the [11], [29], [30]. A mutation in the sequence could have a greater effect on the rate of initiation because it could lead to both a change in promoter stability and the rate of open complex formation. We expect that regardless of whether differences in the affect the stability of the closed complex or open complex formation, selection on the will be on its binding site strength. The larger range of outputs in the Mar:TAT context compared to the Mar:TTT context suggests some cooperativity between sites (Figure 6A). We do not have enough data to determine to what extent.
As previously mentioned, the spacing between the and can affect the rate of initiation [5]. While we tried to minimize the number of binding sites with alternative spacings from our library, this proved difficult because the last two positions of the hexamer are fairly non-specific. We observed that binding sites were viable with a 1 bp shorter spacing relative to the , but only in weak selective conditions (low tetracycline, strong and MarA binding sites) and only the strongest sites (Figure 5). This was confirmed by quantitative PCR, where we observed that only in the Mar:TAT context, could shifted sites produce an output above that of a non-specifically bound (Figure 6). The additional energy of the may be able to compensate for the energetic cost of binding the with a sub-optimal spacing [11]. We observed a similar average fitness for related sets of binding sites with a shifted (Table 1), suggesting that differences in the position of the do not affect transcriptional initiation. These sets of binding sites were on average about half as fit as the same set of sites with the larger optimal spacing, suggesting that differences in spacing significantly decrease transcriptional activity.
Materials and Methods
Binding site library construction
We placed the tetracycline resistance gene (tet) under control of a MarA-activated promoter on the E. coli plasmid pBR322. pBR322 has several advantages: (1) It confers resistance to both ampicillin and tetracycline, allowing for maintenance of the plasmid to be either independent of or dependent on the promoter of tet. (2) It is a relatively low copy plasmid (15–20 copies per cell) [31]. This eliminates the high expression of tet associated with large copy numbers. We generated four promoter libraries where the was randomized and contained either one of two MarA and binding sites (Figure 1).
Variability in the relative spacing between binding sites can affect the rate of transcription [5], [6]. We designed the promoter insert to strongly favor a single spacing between the and the to avoid having to consider spacing effects on the fitness of the promoter in the analyses. We used the optimal spacing between the and [11], where deviations from this spacing would result in a decrease in binding affinity. Additionally, the two bases immediately (‘CA’) and the two bases immediately (‘GC’) of the hexamer are disfavored at the first and last two positions of the respectively [11], further reducing the possibility of strong binding sites with different relative spacers. The sequence between the and MarA binding site is a slight variant of the sequence found between the MarA site and the in the mar promoter [22]. We shortened the spacer by one base at the end to have the disfavored ‘CA’ immediately adjacent to the . Martin et al. showed that this shortened spacing has a minimal effect on the degree of MarA activation [6]. We also changed three bases in the spacer to create a BstBI site (TTCATT is now TTCGAA).
The weaker (TTTAAT) in the promoter of the tet gene was mutated to the consensus (TATAAT) by QuickChange according to Zheng et al. [32]. These two pBR322 variants, pBR322 and pBR322, were used for subsequent library construction. The of the tet gene on pBR322 is flanked by two unique restriction sites, EcoRI and ClaI. These sites were used to clone in MarA binding site and variants as described below.
The randomized library inserts were created by DNA synthesis (Integrated DNA Technologies). Variation of the binding site was done by mixing equal quantities of each base at those positions. Two library inserts were synthesized that contained either the stronger mar MarA binding site [22], or the non-specific anti-consensus MarA binding site. The latter has the least frequently observed base at each position based on the MarA binding model (model not published but generated from sequences in [6]) and should not be bound. These inserts will be referred to as Ins and Ins. The DNA was made double stranded by second strand synthesis with Klenow (NEB), and the fragments were purified with a QIAquick PCR purification kit (Qiagen).
pBR322, pBR322, Ins, and Ins were cut with EcoRI and ClaI (New England Biolabs) for two hours at C and gel purified using a QIAquick gel extraction kit (Qiagen). All four combinations of plasmids and inserts were mixed and ligated overnight at C with T4 DNA ligase (NEB) generating 4 libraries (Mar:TAT, Anti:TAT, Mar:TTT and Anti:TTT). The ligated libraries were transformed by electroporation into DH10B cells (Gibco BRL), and plated on 100 ml LB+30 g/ml ampicillin plates. The number of transformants for each library was ca. . The colonies were suspended from the plate in 10 ml LB, and mini-prepped using a QIAquick miniprep kit (Qiagen).
Promoter competition
Libraries were transformed by electroporation into the E. coli strain DH10B (Gibco BRL). The number of transformants was ca. as determined by plating. After transformation, cells were recovered in 500 l LB for 1 hour, and grown further in 5 ml LB+30 g/ml of ampicillin overnight at C, with shaking at 225 RPM. Fresh 5 ml LB cultures containing from 5 to 50 g/ml of tetracycline were inoculated with 100 l of the promoter libraries grown overnight. Promoter libraries were competed against each other for 24 hours at C, with shaking at 225 RPM. Plasmids were purified from the competed libraries using a QIAquick miniprep kit.
Measurement of transcriptional output by quantitative PCR
The Mar:TTT and Mar:TAT libraries were plated on LB agar plates containing 0 to 100 g/ml of tetracycline. Individual colonies were sequenced from these plates, and 8 variants in the Mar:TTT context and 7 variants in the Mar:TAT context were chosen that covered a large range of predicted binding strengths for further analysis. 5 ml LB cultures containing 30 g/ml of ampicillin were inoculated with E. coli containing a single binding site variant and grown overnight. A fresh 5 ml LB+30 g/ml ampicillin culture was started at and grown to an . cells were added to RNAprotect Bacteria reagent (Qiagen), and RNA was purified using the RNeasy Mini kit with on-column DNase digestion (Qiagen). cDNA was made from 2 g of RNA using the Superscript III RT kit (Invitrogen). QPCR was performed with the SYBR green mix from NEB. QPCR primers specific to the tet and gyrA gene were both used. The relative expression of the tet gene was determined by the ratio of tet transcript abundance over gyrA transcript abundance for each sample. A serial dilution of the Mar:TTT, TTGACT sample was used as a standard for both primer sets. The expression of the tet gene for all variants was calculated relative to this. All sequences used, their predicted affinity () and the expression values are reported in Table S2.
Solexa sample prep and sequencing
Conversion of pBR322 to pBR322 destroyed a HindIII site that overlapped the first two bases of the hexamer. Libraries that contained the wild type (TTTAAT) were digested with HindIII and PvuI (NEB) for 2 hours at C. pBR322 libraries were digested with ClaI and PvuI (NEB) for 2 hours at C. base pair fragments were gel purified for all four libraries using the QIAquick gel extraction kit. Excised fragments from all four promoter libraries, selected at a single tetracycline concentration, were mixed at equal concentration. Solexa libraries were then generated from this mixed population.
The Illumina genomic library protocol was slightly modified (Illumina, Inc.). We used a 1∶10 dilution of the Solexa genomic adapter, and ran the PCR for 16 rounds. We gel purified the final product after the PCR step instead of before as suggested. This allowed the removal of potential adapter contaminants. Sample purity and concentration were measured using a Bioanalyzer (Agilent Technologies). A 45 bp single-end run was performed on a GAII machine according to the Illumina protocol.
Analysis of fitness data
For each tetracycline concentration, the reads were identified as originating from one of the four promoter types. We used only those sequences that had an exact match to 14 or 21 specific bases that flanked the −35 region for the TAT and TTT libraries respectively. We did this to ensure that this sequence was not mutated, the spacing between the −10 and −35 was not changed, and to increase our confidence in the accuracy of the −35 sequence. We used 7 additional bases for the TTT libraries because those libraries were cut 7 bases further from the −35 than the TAT libraries. These additional bases were used to determine which variant was present for that sequence. Additionally, we required an additional 10 bases before and overlapping the MarA binding site to exactly match to confidently distinguish between the Mar and Anti libraries. The number of reads for each competition that pass these criteria are reported in Table S1.
Each was counted for each competed library at a tetracycline concentration. To determine the relative fitness of a in a competed population, the number of reads containing that was divided by the number of reads of the most frequently observed . For two of the competitions, Anti:TAT Tet-5 and Anti:TAT Tet-10, three hexamers (TGCCCA, TCCATT and CTGGAT) were disproportionally high relative to the others. Interestingly, if two of these hexamers are put in the context of the promoter sequence, CA-TCCATT-G is only one base different from the reverse complement of CA-CTGGAT-G (C-ATCCAG-TG). The hexamer sequence is separated from surrounding sequence by ‘-’. These sequences may encode for the binding site of some unknown factor which may explain their increased fitness. At greater tetracycline concentrations though, these were observed much less frequently. For these competitions, the fitness of the hexamers were calculated relative to the fourth most frequently observed hexamer.
Sequence logos were generated from the alignment of all reads for a single library at a single tetracycline concentration using the delila software [33].
Inference of binding affinity
We used the program scan to predict the relative affinity () of to each hexamer. Briefly, scan compares an individual sequence to an information theory based weight matrix and sums the information contribution of each base across all positions in a site [2]. The weight matrix that we used is the one generated from 401 experimentally verified promoters in E. coli presented in [11] and is given in the supplemental materials of this paper (Table S3).
There are several advantages to this approach. First, the weight matrix is generated from a large number of experimentally verified promoters, and should not be skewed by binding site selection biases [34]. Second, has been shown experimentally to be directly proportional to and more specifically [4]. Third, the information theory approach predicts a clear demarcation between specifically and non-specifically bound sites at 0 bits [24].
Supporting Information
Zdroje
1. von HippelPH
BergOG
1986 On the specificity of DNA-protein interactions. Proc Natl Acad Sci USA 83 1608 1612
2. SchneiderTD
1997 Information content of individual genetic sequences. J Theor Biol 189 427 441
3. MaerklSJ
QuakeSR
2007 A systems approach to measuring the binding energy landscapes of transcription factors. Science 315 233 237
4. ShultzabergerRK
RobertsLR
LyakhovIG
SidorovIA
StephenAG
2007 Correlation between binding rate constants and individual information of E. coli Fis binding sites. Nucleic Acids Res 35 5275 5283
5. DombroskiAJ
JohnsonBD
LonettoM
GrossCA
1996 The sigma subunit of Escherichia coli RNA polymerase senses promoter spacing. Proc Natl Acad Sci USA 93 8858 8862
6. MartinRG
GilletteWK
RheeS
RosnerJL
1999 Structural requirements for marbox function in transcriptional activation of mar/sox/rob regulon promoters in Escherichia coli: sequence, orientation and spatial relationship to the core promoter. Mol Microbiol 34 431 441
7. HawleyDK
McClureWR
1983 Compilation and analysis of Escherichia coli promoter DNA sequences. Nucleic Acids Res 11 2237 2255
8. McClureWR
1985 Mechanism and control of transcription initiation in prokaryotes. Annu Rev Biochem 54 171 204
9. BrowningDF
BusbySJ
2004 The regulation of bacterial transcription initiation. Nat Rev Microbiol 2 57 65
10. BintuL
BuchlerN
GarciaH
GerlandU
HwaT
2005 Transcriptional regulation by the numbers: models. Current opinion in genetics & development 15 116 124
11. ShultzabergerRK
ChenZ
LewisKA
SchneiderTD
2007 Anatomy of Escherichia coli σ70 promoters. Nucleic Acids Res 35 771 788
12. GertzJ
SiggiaE
CohenB
2008 Analysis of combinatorial cis-regulation in synthetic and genomic promoters
13. MustonenV
KinneyJ
CallanC
LassigM
2008 Energy-dependent fitness: A quantitative model for the evolution of yeast transcription factor binding sites. Proceedings of the National Academy of Sciences 105 12376
14. FryC
FarnhamP
1999 Context-dependent transcriptional regulation
15. HochschildA
DoveS
1998 Protein–Protein Contacts Minireview that Activate and Repress Prokaryotic Transcription. Cell 92 597 600
16. RoyS
GargesS
AdhyaS
1998 Activation and repression of transcription by differential contact: two sides of a coin
17. KimJ
ShapiroD
1996 In simple synthetic promoters YY1-induced DNA bending is important in transcription activation and repression. Nucleic acids research 24 4341
18. SheridanS
BenhamC
HatfieldG
1998 Activation of gene expression by a novel DNA structural transmission mechanism that requires supercoiling-induced DNA duplex destabilization in an upstream activating sequence. Journal of Biological Chemistry 273 21298 21308
19. MartinR
GilletteW
MartinN
RosnerJ
2002 Complex formation between activator and RNA polymerase as the basis for transcriptional activation by MarA and SoxS in Escherichia coli. Molecular Microbiology 43 355 370
20. ShultzabergerRK
ChiangDY
MosesAM
EisenMB
2007 Determining physical constraints in transcriptional initiation complexes using DNA sequence analysis. PLoS ONE 2 e1199 doi:10.1371/journal.pone.0001199
21. MandeckiW
ReznikoffWS
1982 A lac promotor with a changed distance between −10 and −35 regions. Nucleic Acids Res 10 903 912
22. MartinR
JairK
WolfR
RosnerJ
1996 Autoactivation of the marRAB multiple antibiotic resistance operon by the MarA transcriptional activator in Escherichia coli. Journal of bacteriology 178 2216 2223
23. SchneiderTD
StormoGD
GoldL
EhrenfeuchtA
1986 Information content of binding sites on nucleotide sequences. J Mol Biol 188 415 431
24. SchneiderTD
1991 Theory of molecular machines. II. Energy dissipation from molecular machines. J Theor Biol 148 125 137
25. DekelE
AlonU
2005 Optimality and evolutionary tuning of the expression level of a protein. Nature 436 588 592
26. NguyenT
PhanQ
DuongL
BertrandK
LenskiR
1989 Effects of carriage and expression of the TnlO tetracycline-resistance operon on the fitness of Escherichia coli K12. Molecular Biology and Evolution 6 213 225
27. LenskiR
SouzaV
DuongL
PhanQ
NguyenT
1994 Epistatic effects of promoter and repressor functions of the Tn10 tetracycline-resistance operon on the fitness of Escherichia coli. Molecular Ecology 3 127 135
28. EllingerT
BehnkeD
BujardH
GrallaJ
1994 Stalling of Escherichia coli RNA polymerase in the+ 6 to+ 12 region in vivo is associated with tight binding to consensus promoter elements. Journal of molecular biology 239 455 465
29. FentonMS
LeeSJ
GrallaJD
2000 Escherichia coli promoter opening and −10 recognition: mutational analysis of σ70. EMBO J 19 1130 1137
30. SclaviB
ZaychikovE
RogozinaA
WaltherF
BuckleM
2005 Real-time characterization of intermediates in the pathway to open complex formation by Escherichia coli RNA polymerase at the T7A1 promoter. Proc Natl Acad Sci USA 102 4706 4711
31. SambrookJ
FritschEF
ManiatisT
1989 Molecular Cloning, A Laboratory Manual Cold Spring Harbor, New York Cold Spring Harbor Laboratory, second edition
32. ZhengL
BaumannU
ReymondJ
2004 An efficient one-step site-directed and site-saturation mutagenesis protocol. Nucleic acids research 32 e115
33. SchneiderTD
StephensRM
1990 Sequence logos: A new way to display consensus sequences. Nucleic Acids Res 18 6097 6100
34. ShultzabergerRK
SchneiderTD
1999 Using sequence logos and information analysis of Lrp DNA binding sites to investigate discrepancies between natural selection and SELEX. Nucleic Acids Res 27 882 887
Štítky
Genetika Reprodukční medicínaČlánek vyšel v časopise
PLOS Genetics
2010 Číslo 7
Nejčtenější v tomto čísle
- CHD7 Targets Active Gene Enhancer Elements to Modulate ES Cell-Specific Gene Expression
- Extensive DNA End Processing by Exo1 and Sgs1 Inhibits Break-Induced Replication
- Question and Answer: An Anniversary Interview with Jane Gitschier
- Multi-Variant Pathway Association Analysis Reveals the Importance of Genetic Determinants of Estrogen Metabolism in Breast and Endometrial Cancer Susceptibility