
Regulator of G Protein Signaling 3 Modulates Wnt5b Calcium Dynamics and Somite Patterning
Vertebrate development requires communication among cells of the embryo in order to define the body axis, and the Wnt-signaling network plays a key role in axis formation as well as in a vast array of other cellular processes. One arm of the Wnt-signaling network, the non-canonical Wnt pathway, mediates intracellular calcium release via activation of heterotrimeric G proteins. Regulator of G protein Signaling (RGS) proteins can accelerate inactivation of G proteins by acting as G protein GTPase-activating proteins (GAPs), however, the possible role of RGS proteins in non-canonical Wnt signaling and development is not known. Here, we identify rgs3 as having an overlapping expression pattern with wnt5b in zebrafish and reveal that individual knockdown of either rgs3 or wnt5b gene function produces similar somite patterning defects. Additionally, we describe endogenous calcium release dynamics in developing zebrafish somites and determine that both rgs3 and wnt5b function are required for appropriate frequency and amplitude of calcium release activity. Using rescue of gene knockdown and in vivo calcium imaging assays, we demonstrate that the activity of Rgs3 requires its ability to interact with Gα subunits and function as a G protein GAP. Thus, Rgs3 function is necessary for appropriate frequency and amplitude of calcium release during somitogenesis and is downstream of Wnt5 activity. These results provide the first evidence for an essential developmental role of RGS proteins in modulating the duration of non-canonical Wnt signaling.
Published in the journal:
. PLoS Genet 6(7): e32767. doi:10.1371/journal.pgen.1001020
Category:
Research Article
doi:
https://doi.org/10.1371/journal.pgen.1001020
Summary
Vertebrate development requires communication among cells of the embryo in order to define the body axis, and the Wnt-signaling network plays a key role in axis formation as well as in a vast array of other cellular processes. One arm of the Wnt-signaling network, the non-canonical Wnt pathway, mediates intracellular calcium release via activation of heterotrimeric G proteins. Regulator of G protein Signaling (RGS) proteins can accelerate inactivation of G proteins by acting as G protein GTPase-activating proteins (GAPs), however, the possible role of RGS proteins in non-canonical Wnt signaling and development is not known. Here, we identify rgs3 as having an overlapping expression pattern with wnt5b in zebrafish and reveal that individual knockdown of either rgs3 or wnt5b gene function produces similar somite patterning defects. Additionally, we describe endogenous calcium release dynamics in developing zebrafish somites and determine that both rgs3 and wnt5b function are required for appropriate frequency and amplitude of calcium release activity. Using rescue of gene knockdown and in vivo calcium imaging assays, we demonstrate that the activity of Rgs3 requires its ability to interact with Gα subunits and function as a G protein GAP. Thus, Rgs3 function is necessary for appropriate frequency and amplitude of calcium release during somitogenesis and is downstream of Wnt5 activity. These results provide the first evidence for an essential developmental role of RGS proteins in modulating the duration of non-canonical Wnt signaling.
Introduction
The Wnt signaling network is classified into β-catenin-dependent and β-catenin-independent pathways [1]–[3]. β-catenin-dependent Wnt signaling acts through the stabilization of β-catenin and subsequent transcriptional activation of β-catenin targets [4], whereas β-catenin-independent Wnt signaling influences cell polarity (known as Planar Cell Polarity or PCP in Drosophila). β-catenin-independent Wnt signaling has also been shown to lead to calcium (Ca2+) release as well as activation of Rac, Rho and other cytoskeletal components in vertebrates [5], [6]. In zebrafish, Wnt-5 and -11 function in Wnt/Ca2+ signaling [7], [8]. Wnt11 is enriched in the anterior and mutants show anterior extension and eye fusion defects, while Wnt5b is enriched in the posterior and mutants show altered cell movements during gastrulation, often resulting in convergence extension and somite defects [9]–[11].
Zebrafish embryos demonstrate Ca2+ release dynamics during epiboly, gastrulation, convergent extension and organogenesis [12]–[21]. Two distinct types of Ca2+ release events, aperiodic transient fluxes found mainly in the enveloping layer and dorsal forerunner cells [17], [18], [22], [23] and sustained increases in Ca2+ levels in the deep cell layer and yolk syncytial layer [24], [25], have been described. We have shown that early Ca2+ transients are, in part, modulated by Wnt5 [15], [26]. The zebrafish wnt5b genetic mutant (pipetail) shows reduced Ca2+ release [24] and the ventralized maternal effect mutant hecate shows ectopic Ca2+ release [18]. Moreover, inhibition of Ca2+ release results in alteration of dorsal ventral patterning, cell movement and left-right patterning [17], [26]. These observations suggest that the kinetics of Ca2+ release, both transient and sustained, translate into distinct developmental outputs [16].
Wnts interact with receptors of the Frizzled (Fz) family [27] and due to structural similarities to G protein coupled receptors (GPCR), Fz receptors are hypothesized to stimulate heterotrimeric G protein activation [28]–[30]. We have shown previously that Wnt proteins work though specific Fz homologues to activate G proteins and to modulate Ca2+ release in zebrafish embryos [15], [22], [26], [31]. Moreover, in Drosophila, Wnt target genes have been shown to be upregulated when Gαo is over-expressed and constitutively active Gαo is sufficient to restore Wnt signaling in the absence of Fz activity [32]. In addition, epistasis experiments support that G proteins function downstream of Fz and upstream of Disheveled (Dvl) [32].
G protein signaling is regulated by the lifetime of active Gα and βγ subunits. Activated Gα subunits have an intrinsic GTPase activity that converts the GTP-bound conformation to the Gα-GDP bound conformation allowing reassembly with Gβγ subunits to form the inactive Gαβγ heterotrimer [33]. Regulator of G protein Signaling (RGS) proteins have been shown to influence the duration of G protein signaling [34]–[37]. RGS proteins share a conserved RGS domain of 130 amino acids that binds to activated Gα subunits and accelerates their rates of GTP hydrolysis by up to 1000-fold [38]–[40]. By functioning as GTPase-activating proteins (GAPs) for G proteins, RGS proteins are uniquely situated to modulate the intensity and duration of Wnt signaling. However, no studies have ascertained the possible importance of RGS proteins in non-canonical Wnt signaling or whether changes in frequency and or amplitude of signaling result in biological defects.
To investigate potential roles of RGS proteins in vertebrate development, we utilize gene knockdown in zebrafish. We focus on rgs3, which was identified in an expression screen in zebrafish [41]. We find that rgs3 is expressed in overlapping and adjacent domains with wnt5b at multiple stages of zebrafish development. Morpholino knockdown of rgs3 in zebrafish embryos causes convergence and extension (CE) defects that resemble phenotypes observed in the wnt5b genetic mutant, pipetail [42]. To this end, we have identified a genetic interaction between rgs3 and wnt5b. Additionally, we describe endogenous Ca2+ release dynamics during somite stages and show that Rgs3 and Wnt5b impact the frequency of Ca2+ release. Moreover, we show that Rgs3 modulates the extent and duration of Wnt5b induced Ca2+ activity. Functional analyses show that both the rescue of the rgs3 knockdown defect and impact on Wnt5-induced Ca2+ release requires a key asparagine in the RGS domain of Rgs3 necessary for Gα binding and acceleration of its GTPase activity. This research identifies a link between Wnt5b signaling and Rgs3 activity relative to the frequency of Ca2+ release, thus revealing obligatory roles for RGS proteins in vertebrate development in the context of the whole animal. Our results also demonstrate that the biological outcome of Wnt signaling depends greatly upon regulating the duration of its signal, as shown here with Rgs3.
Results
Expression of rgs3
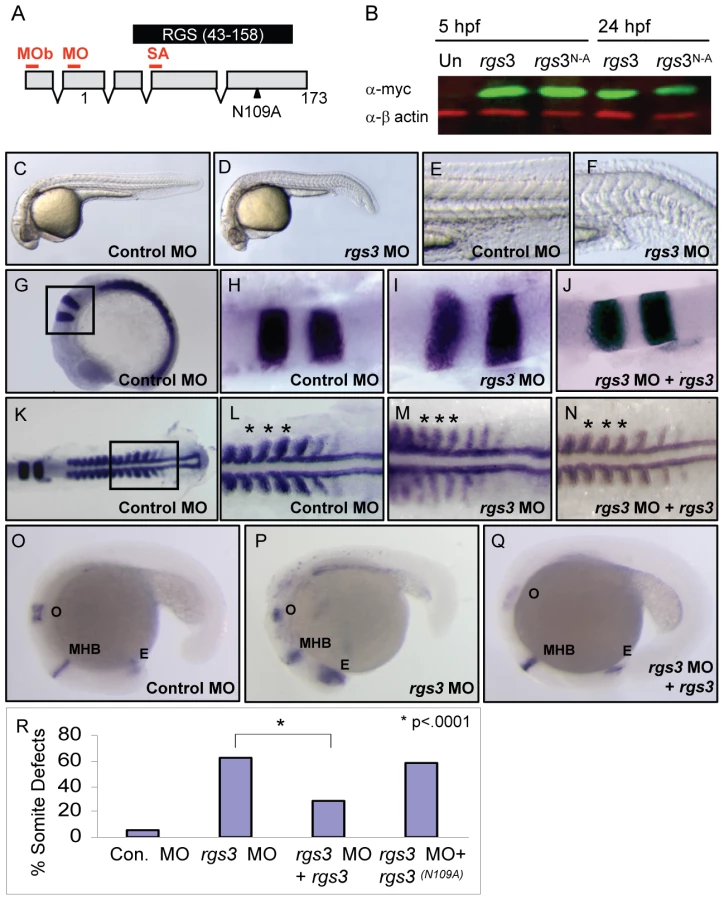
Zebrafish rgs3 was identified in an expression screen during early somitogenesis stages [41] and is poised to interact with the Wnt signaling network. Utilizing Reverse Transcriptase Polymerase Chain Reaction (RT-PCR), we determined that rgs3 expression begins during the blastula period shortly after zygotic transcription initiates (2.5–5 hours post fertilization, hpf), and persists through the segmentation period (10–24hpf) (Figure 1A). Whole Mount In Situ Hybridization (WMISH) demonstrated ubiquitous rgs3 expression during epiboly and gastrulation stages. During somite stages (10–20 hpf), rgs3 expression resolves in the somites, tailbud, and brain (Figure 1B–1G), with discrete rgs3 expression in the midbrain/hindbrain boundary as demonstrated by overlap with the molecular marker engrailed 1 (eng1) at 28 hpf (Figure S1F), and enriched rgs3 expression in the posterior (caudal) portion of developing somites (Figure 1D). rgs3 and wnt5b show both overlapping and adjacent expression domains in the somites and in the posterior tailbud (Figure 1E–1G and Figure S1A, S1B, S1C, S1D). rgs3 expression is enriched around the Kupffer's vesicle (Figure S1C), a ciliated organ in the zebrafish embryo that has been shown to influence left-right patterning, yet rgs3 does not appear to be required for organ laterality (data not shown). As Wnt5b is a secreted ligand, the proximity of rgs3 to wnt5b producing cells suggests that Rgs3 may function in modulating Wnt5b signaling.

Rgs3 is sufficient to suppress Wnt5b-induced Ca2+ dynamics
In zebrafish, wnt5b induces increased Ca2+ release during the blastula stage in a G protein dependent manner [15], [22], [26]. To determine if rgs3 over-expression is sufficient to negatively regulate Wnt5b signaling (Figure 2A), we tested the impact of rgs3 on wnt5b induced Ca2+ release. In vivo imaging in blastula stage embryos is accomplished with the Ca2+ sensor Fura-2. Upon binding Ca2+, Fura-2 exhibits an absorption shift that can be determined by collection at two wavelengths (340nm, Ca2+-saturated and 380nm, Ca2+-free). A ratio image is derived as the quotient of the 340-nm image divided by the 380-nm image on a pixel-by-pixel basis, and provides spatial and temporal measurement of Ca2+ dynamics. Ca2+ release activity was monitored over a 75 minute time course during the blastula stage. Sequential ratiometric images were analyzed by a subtractive algorithm to identify changes in Ca2+ release activity (transients) over time as well as the location of the activity as described previously [13], [43]–[45]. Transients identified during the time course are presented as a composite image with location of Ca2+ release mapped on the embryo. The number of Ca2+ transients during the cellular blastoderm stage is represented by height of the peaks and color coded where purple is low and yellow/red is high number of events. The composite image of a wild-type (wt) embryo during the blastula stage indicates endogenous Ca2+ levels throughout the embryo (Figure 2C) compared to those observed during increased Ca2+ release in an embryo injected with wnt5b (Figure 2B). Co-injection of rgs3 with dextran-conjugated Texas Red (TxR) lineage tracer into a subset of cells in embryos uniformly expressing wnt5b co-mixed with Fura-2 supports that rgs3 is sufficient to suppress wnt5b induced Ca2+ release as demonstrated by the reduction of Ca2+ levels (Figure 2D) in the rgs3/TxR positive region (Figure 2F).

We next investigated if Rgs3 suppression of wnt5b induced Ca2+ release requires GAP activity. A conserved asparagine within the RGS domain of RGS proteins is necessary for GAP activity for Gα subunits [46]–[48]. Substitution of this key asparagine (N) with Alanine (A) results in a loss of the GAP activity of RGS proteins towards Gα subunits in culture cells [46], [48]. To elucidate the role of the GAP function of Rgs3, we created an N to A mutation in zebrafish rgs3 (rgs3N109A)(Figure 3A). We evaluated the impact of rgs3N109A expression on Wnt5b induced Ca2+ release. Unlike rgs3, the rgs3N109A is unable to suppress wnt5b induced Ca2+ release (Figure 2E) as demonstrated by no change in the Ca2+ activity in the rgs3N109A /TxR positive region of embryos (Figure 2G). To rule out the possibility that lack of suppression by Rgs3N109A was due to differences in its expression or localization compared to Rgs3, we generated and expressed N-terminal myc-tagged rgs3 and rgs3N109A constructs in embryos. Western analysis reveals robust and comparable expression of Rgs3 and Rgs3N109A at the time of Ca2+ imaging as well as through 24hpf (Figure 3B). Immunostaining for anti-myc in epiboly stage embryos also indicates that both proteins localize to the membrane and cytoplasm (Data not shown). Together these data strongly indicate that rgs3 is sufficient to inhibit wnt5b-induced Ca2+ signaling and that this action requires the GAP activity of Rgs3.
Endogenous requirement for rgs3 during embryogenesis
Since Rgs3 is sufficient to modulate Wnt5 activity in an over-expression assay, we next evaluated the necessary role of rgs3 during development. To knockdown Rgs3, we utilized antisense morpholino oligonucleotides (MO) [49]. Three separate MOs were designed to bind rgs3 5′UTR (MO and MOb) or splice junction (SA) (Figure 3A). All MOs designed to knockdown Rgs3 produced similar defects. Control-injected embryos at 28 hpf are fully extended with a characteristic anterior-posterior (A-P) length (Figure 3C). In contrast, rgs3 MO-injected embryos have shorter A-P extension and a kinked tail (Figure 3D) reminiscent of defects observed in the wnt5b (pipetail) genetic mutant [42]. Zebrafish somites develop sequentially anterior to posterior and form a distinct chevron shape [50] (Figure 3E). rgs3 morphants display tighter packed and rounded somites (Figure 3F). To evaluate anterior-posterior extension alterations at an earlier developmental stage (15 hpf), molecular markers were used. Control-injected embryos have a characteristic spacing of krox20 expression in the hindbrain rhombomeres 3 and 5, as well as regular spaced blocks of myoD expression in the developing somites flanking the midline (Figure 3G–3H and 3K–3L). In contrast, krox20 and myoD expression in rgs3 morphants reveal a failure of cells to converge on the midline resulting in a lateral expansion of the rhombomeres and somites (Figure 3I and 3M). Additionally, rgs3 morphants fail to extend along the anterior-posterior (A-P) axis leading to closer spaced myoD (Figure 3M, asterisks). The A-P extension defects were further confirmed with pax2, a marker expressed in the anterior retina, midbrain/hindbrain, and otic vesicle of 18 hpf embryos (Figure 3O). rgs3 morphants display compression of these regions along the A-P axis (Figure 3P). Together these data strongly indicate that rgs3 is required for normal anterior-posterior axis extension.
The specificity of the rgs3 knockdown as well as structural functional analyses were determined by RNA co-injection experiments. Injection of control 5bp mismatch MO resulted in negligible defects compared to rgs3 MO which induced morphological somite defects (Figure 3R). Co-injection of rgs3 MO with rgs3 RNA suppressed the MO-induced defects evaluated by molecular markers krox20 (Figure 3J), myoD (Figure 3N, asterisks) and pax2 (Figure 3Q). Moreover, wild-type rgs3 RNA leads to significant suppression of MO-induced defects (Figure 3R and Table S1). In contrast, rgs3N109A mutant RNA does not suppress the MO-induced defect (Figure 3R and Table S1). These results demonstrate that Rgs3 GAP activity is required for its developmental functions.
rgs3 function is necessary for endogenous Ca2+ dynamics in somites
The functional requirement of rgs3 during anterior-posterior axis extension and the finding that over-expression of rgs3 is sufficient to inhibit wnt5b-induced Ca2+ signaling, raised the possibility that rgs3 may negatively modulate Ca2+ release dynamics during somitogenesis. In fact, Ca2+ signals along the trunk of zebrafish embryos during somitogenesis have been described using the bioluminescent Ca2+ reporter R-aequorin [12], [51], [52]. In order to compare changes in Ca2+ release dynamics upon rgs3 manipulation, we performed a detailed analysis of endogenous Ca2+ release in tissues that express both wnt5b and rgs3. To this end, we utilized Fura-2 imaging to monitor Ca2+ activity with a focus on the developing somites and tailbud in either a dorsal (Figure 4A) or a lateral (Figure S2A) orientation. The pseudocolored ratio image provides a spatial and temporal measurement of Ca2+ dynamics with low Ca2+ represented by blue and high Ca2+ represented by yellow/red. Representative pseudocolored ratio images from a time-lapse series of Ca2+ measurements (Video S1), spanning the 3–13 somite stages are shown (Figure 4B–4E). The notochord and forming somites can be identified in the grayscale fluorescence images (Figure 4B′–4E′). Overlay of grayscale and ratio images illustrate the regions of increased Ca2+ levels relative to morphology (Figure 4B″–4E″).

Ca2+ release activity during somitogenesis is dynamic with sustained Ca2+ levels in the presomitic mesoderm, lateral to the somite forming region and flanking the midline/notochord (Figure 4B″–4E″). As somitogenesis proceeds, sustained Ca2+ levels appear distinctly between the somites (Figure 4C″–4E″, arrowheads). In addition, we observe localized short-lived increases in Ca2+ release (referred to as transients). To demonstrate a transient, a region of interest (ROI) is noted by dashed circle (Figure 5A–5C). In the ROI, an increase in Ca2+ is observed from time 0s to time 15s and the local increase subsides by time 30s. Since rgs3 may function to influence the frequency of Ca2+ release, we determined the number of transients as a function of developmental age (Figure 5D). In wt embryos, we observe an average of 5.3 Ca2+ transients per hour (n = 3) (Figure 5E). A similar frequency is found when analyzing the data from a lateral view (Figure S2B, S2C, S2D, and S2K).

Having defined endogenous Ca2+ release dynamics during somitogenesis, we next determined the impact of rgs3 knockdown. From the development of somite 6 to somite 12, rgs3 morphants have statistically more Ca2+ transients, with an average of 21.7 per hour (n = 3), when compared to wt embryos (Figure 5D and 5E). rgs3 morphants have sustained Ca2+ levels in the lateral regions similar to wt. However the dynamics within the somite region frequently show initiating transients leading to responses in neighboring cells, resulting in larger areas of increased Ca2+ release (Figure 5I–5K, Video S2). These large and robust transients are not observed in wt embryos (Figure 5F–5H, Video S1) or in morphant embryos co-injected with rgs3 RNA (Video S3). The same dramatic increase in both the frequency of release and amplitude is observed in lateral views as well (Figure S2E, S2F, S2G, and S2K). The change in Ca2+ release dynamics in rgs3 morphants is consistent with a delayed shut-off of G protein signaling, i.e. normally mediated by the GAP activity of Rgs3. These data indicate that during the segmentation period Rgs3 functions to limit the extent and duration of endogenous Ca2+ release activity.
Previously, we reported reduced Ca2+ release in blastula stage Wnt5b (pipetail) genetic mutants [24]. When compared to wild-type embryos, wnt5b morphant embryos show a statistically reduced number of Ca2+ transients, averaging 1.3 per hour (n = 2) during the segmentation period (Figure 5D–5E, 5L, and 5M; Video S4). A similar decrease in frequency is also observed in a lateral view (Figure S2H, S2I, S2J, S2K). The size and duration of Ca2+ transients observed in wnt5b morphants are comparable to wt embryos (Video S4). In order to determine if the increased frequency of Ca2+ transients associated with rgs3 knockdown is dependent upon wnt5b signaling, we simultaneously knocked down wnt5b and rgs3. Embryos co-injected with wnt5b MO and rgs3 MO and imaged during the segmentation period show a statistically reduced number of Ca2+ transients, 1.8 per hour (n = 5) (Figure 5D–5E). The reduced Ca2+ release in the double knockdown is not significantly different than wnt5b single knockdown, demonstrating that the rgs3 morphant phenotype is dependent upon Wnt signaling.
rgs3 and wnt5b interaction
Studies have shown that increased Wnt/Fz signaling leads to degradation of Dvl [53]–[55]. In addition Drosophila genetics places active G protein signaling upstream of Dvl [32]. Therefore, it seemed essential to determine whether Rgs3 plays a role in modulation of Dvl levels. In the absence of an antibody to evaluate Dvl levels, we generated a myc-tagged (MT) form of zebrafish Dvl2 that is readily detected by western blot after injection into embryos (Figure 6A). We find that wnt5b co-expression reduced Dvl-MT levels (Figure 6A). Reduction of Rgs3 function, via MO knockdown, also leads to decreased Dvl-MT levels. These data demonstrate that endogenous Rgs3 functions in the non-canonical Wnt pathway upstream of Dvl, thereby functioning to modulate the duration and robustness of Wnt5 signaling. To further explore interaction between Rgs3 and Wnt5b, we defined a low dose for wnt5b MO which results in a mild A-P extension phenotype and determined whether rgs3 enhances or suppresses the wnt5b gene knockdown defects. Phenotypes were evaluated by morphology (Figure 6B, 6E, 6H, and 6K) and molecular markers, krox20 and myoD (Figure 6C–6D, 6F, 6G, 6I, 6J, 6L, and 6M). Compared to wt (Figure 6B–6D), low dose wnt5b MO (2 ng) results in a mild phenotype (Figure 6E–6G). We next defined a sub-phenotypic dose for rgs3 MOsa (0.8 ng), which produced a phenotype (Figure 6H–6J) indistinguishable from wt (Figure 6B–6D). Individual injection of low dose rgs3 MOsa or wnt5b MO did not induce any severe defects (Figure 6N). However, wnt5b MO (2 ng) combined with rgs3MOsa (0.8 ng) resulted in a 92% penetrance of severe defects (Figure 6K–6N). Our Ca2+ imaging implicated Rgs3 function in limiting the extent and duration of endogenous Ca2+ release activity and that this was dependent upon Wnt5. However, in the presence of low level Wnt5 activity (low-dose MO), partial knockdown of rgs3 could lead to discordant changes in the frequency and amplitude of Ca2+ release result in the dramatic phenotypic penetrance and severity.

Discussion
These results provide new evidence for an essential role of Rgs3 in modulating the duration of Wnt5b signaling. We show that Rgs3 is necessary for proper gastrulation and somite patterning during zebrafish development. These actions of Rgs3 require its ability to interact with and accelerate the rate of GTP hydrolysis by G proteins, as revealed by studies employing an Rgs3 mutant defective in these activities. We describe endogenous Ca2+ release dynamics during somitogenesis. The frequency of Ca2+ transients as well as the observation of sustained Ca2+activity in the trunk and tail region are consistent with previous reports of Ca2+ activity during zebrafish somitogenesis [12], [51], [52], [56]. Of particular significance is the dramatic change in frequency of endogenous Ca2+ release upon rgs3 knockdown.
RGS proteins were identified as negative regulators of G protein signaling in the mid 1990s [57], [58] and the role of G proteins in Wnt/Ca2+ signaling was first demonstrated in 1997 [22]. Subsequent reports further implicated G proteins in canonical Wnt signaling [31], [59], [60]. Heterotrimeric G protein activation and inactivation are tightly regulated to provide precise control of the amplitude and duration of G protein signaling. Receptor-stimulated GTP binding activates G proteins, while their intrinsic GTPase activity functions to terminate signaling. RGS proteins by definition accelerate this GTPase activity. Over-expression studies in cell culture [61] and in Xenopus embryos [62] have indicated that specific RGS proteins are sufficient to regulate canonical Wnt signaling. Although G protein signaling is required for normal cell movement during zebrafish gastrulation [11], the role of RGS proteins in noncanonical Wnt signaling has not been investigated. Our current study identifies a member of the RGS protein family that has a direct impact on frequency and amplitude of Wnt5b signaling. We find that Rgs3 activity is sufficient to modulate wnt5b induced Ca2+ release and this ability requires GAP activity consistent with the known role of G proteins in the activation of Wnt signal transduction pathways [5], [63], [64]. We report the key novel finding that knockdown of Rgs3 results in increased frequency and amplitude of Ca2+ release that this dramatic impact on Ca2+ dynamics in the somites is dependent upon Wnt5 supporting that Wnt/Ca2+ signaling activity is an in vivo target of RGS proteins. Moreover, rgs3 demonstrates a complex genetic interaction with wnt5b. rgs3 is expressed in and near wnt5b expressing tissues and we find that combined low doses of wnt5b MO and rgs3 MOsa result in a large penetrance of severe somite defects which is not observed during their individual knockdown. Our data suggest that both the frequency and amplitude of wnt5b signaling must be tightly regulated to result in correct cell movement and somite patterning.
Wnt5b modulates both transient Ca2+ release activity in small populations of cells, as well as, sustained activity in a large region of cells [16]. While the transient release correlates with limiting β-catenin activity [17], [26], we hypothesize that the sustained activity correlates with polarized cell movement, for example in convergence-extension movements during gastrulation or neural and vascular outgrowth [16]. This concept is supported by vascular outgrowth defects in pipetail genetic mutants [65] as well as the observation of a reduction in sustained Ca2+ activity at the somite boundaries (data not shown). It is of interest to determine if interactions between rgs3 and wnt5b influence directed vascular outgrowth.
Modulation of G protein signaling (impacting frequency as well as duration) is likely to influence directed cell migration, vascular development as well as numerous other developmental processes [66]–[68]. Our findings clearly justify the need for further investigations into the role of RGS proteins in this process and other interactions between Rgs3 and Wnt signaling to provide new insights into their mechanistic role in directed cell movement and disease. Our loss of function analysis coupled with rescue and in vivo physiological analysis in whole embryos has provided compelling functional insight into the developmental role of RGS proteins in the Wnt signaling network.
Materials and Methods
Zebrafish
Adults were maintained in a 14-hour light / 10-hour dark cycle at 28°C. Embryos were collected from natural pairwise matings and staged by hours post fertilization (hpf) at 28.5°C and morphological criteria described in Kimmel et al. [50], [69].
Zebrafish rgs3 point mutants
rgs3 (clone IBD5096) was isolated in an expression screen in zebrafish [41] and generously provided by Dr. I. Dawid. MO-resistant rgs3 was generated by RT-PCR and directionally cloned (5′-3′) into the pCS2+, pCS2+ myc or pCS2+ Flag expression vector. The Quick Change II site-directed mutagenesis kit (Stratagene) was used to generate an Asparagine (N) to Alanine (A) substitution at amino acid 109 which is located in the RGS domain of Rgs3. Synthetic RNA was then in vitro transcribed using SP6 RNA polymerase and the mMessage mMachine system (Ambion).
Micro-injections
Antisense morpholino oligonucleotides (MO) were designed to target the 5′-UTR/ATG (rgs3 MO and rgs3 MOb) to inhibit translation and an intron-exon junction in the RGS domain (rgs3 MOsa) to alter splicing. As a control rgs3 MOmm (5 bp mismatch in lowercase letters) was designed (Gene-Tools):
rgs3 MO 5′-AGTCGGTTCTTCATGTCTTTGGCCC-3′,
rgs3 MOb 5′-TCTCCGAGAAATCCACCATAGTGTG-3′,
rgs3 MOsa 5′-CCAGTCCATCTGATGAGGGAGAGAG-3′.
rgs3 MOmm 5′-TCaCCcAGAAATCCtCCATtGTcTG-3′.
MOs (5–20ng) were pressure-injected into one cell-stage embryos. For low-dose knockdown, 0.8ng rgs3 MOsa and/or 2 ng wnt5b MO [65] were injected into one cell zebrafish embryos. Control rgs3 MOmm did not produce any phenotype at 25 ng. For rescue, in vitro-transcribed MO-resistant rgs3 (500 pg) was co-injected with 20 ng rgs3 MO. Injected embryos were characterized by morphological and molecular analysis.
Whole-mount in situ hybridization
Embryos were fixed overnight in 4% paraformaldehyde and dechorionated. Single label WMISH was performed as previously described [24], [70], using digoxigenen (Dig)-labeled or dinitrophenyl (DNP)-labeled antisense and sense RNA probes. Detection was carried out using BM purple (Roche Applied Science). Double label WMISH was performed as previously described [71], using both Dig and DNP-labeled antisense probes. Purple color was developed with AP-conjugated anti-Dig and BM purple (Roche Applied Science), and red color was developed with AP-conjugated anti-DNP and INT RED (Roche Applied Science). Reactions were stopped in phosphate-buffered saline (PBS). Embryos were mounted on bridged coverslips and photographed using a Zeiss Stemi M13 Stereoscope and an Axiocam digital camera.
Western analysis
To compare levels of MT-Rgs3 and mutant MT-Rgs3, embryos were injected with either myc-rgs3 or myc-rgs3(N109A) (750 pg). To investigate Rgs3's impact on Dvl, C-terminal myc tagged zebrafish dvl2 (300 pg) was injected alone, with rgs3 MOsa (5ng), with wnt5b (250pg), and with both rgs3 MOsa (5ng) and wnt5b (250pg). Injected Embryos were allowed to develop to the appropriate stage (5 hpf and 24 hpf) before incubating in lysis buffer (20 µM Tris, 100µM NaCl, 1µM EDTA, 5% Triton, .5%SDS, 10% Leupeptin and 0.1µM PMSF) at room temperature for 3 minutes. Embryos were then disrupted using a pestle, centrifuged at 13,000 rpm for 10 minutes at 4°C and the clear supernatant containing whole zebrafish protein was collected. Approximately 10µg of protein was loaded in each well and separated with SDS-PAGE gel electrophoresis. Proteins were transferred onto nitrocellulose membrane (Li-Cor) and incubated with the following primary antibodies: mouse anti-myc (1∶2,000; Cell Signaling Technology) and rabbit anti-β actin (1∶2,000; Sigma), and then incubated with the following secondary antibodies: IRDye800 anti-mouse (1∶20,000; Li-Cor) and IRDye680 anti-rabbit (1∶20,000; Li-Cor). The signal was visualized using the Odyssey Infrared Imaging System (Li-Cor).
Immunohistochemistry
Embryos injected with either myc-rgs3 or myc-rgs3(N109A) (200 pg) were fixed 1–3 hrs in 4% PFA/1× PBS at sphere/dome stage. Mouse anti–myc antibody (1∶1,500; Cell Signaling Technology), followed by goat-anti-mouse Alexa488 conjugated secondary antibody (1∶400; Molecular Probes) was used to detect the rgs3 products. Nuclei were identified with 5 µM TO-PRO-3 (Molecular Probes). Embryos were mounted in an animal pole orientation in bridged coverslips and optically sectioned using two-channel imaging on a scanning laser confocal microscope, Leica TCS SP2. Wide-field fluorescence and bright–field images from a Zeiss Stemi M13 Bio Stereoscope were photographed using Axiovision (Zeiss) software and an Axiocam 5000 camera. Images were merged using Adobe Photoshop CS.
Intracellular calcium (Ca2+) imaging
The ratiometric Ca2+-sensing dye Fura-2 or Bis-Fura-2 (Molecular Probes) was injected into 1-cell zebrafish embryos. The excitation spectra are different between Ca2+ bound Fura-2 (340-nm) and Ca2+ free (380-nm) forms. By taking the ratio of the fluorescence intensity at these wavelengths an estimate of intracellular-free Ca2+ can be derived. To stimulate Wnt signaling, in vitro transcribed wnt5b RNA (400 pg) was co-injected with Fura-2 at the one cell stage. rgs3 or rgs3N109A RNA (400 pg) was unilaterally injected at the 16-cell stage mixed with dextran-conjugated Texas Red (TxR) lineage tracer. TxR distribution was determined by collecting a reference exposure at 540-nm excitation. For cellular blastoderm stage imaging, embryos were oriented in a lateral position in a glass-bottomed dish on a Zeiss axiovert epifluorescence microscope. Image pairs at 340 and 380-nm excitation wavelengths (510-nm emission) were collected at 15-second intervals. Each imaging session collected 300 image pairs. The ratio image, a pixel by pixel match of both excitation wavelengths, is calculated by computer software (RatioTool, Inovision). The sequence of ratio images was processed and the Ca2+ fluxes (transients) were determined by a subtractive analog patterned after [72], [73] and described in [13], [43]. The ratio image (340nm, Ca2+-saturated and 380nm, Ca2+-free) imported for publication is encoded in 8 bits and converted to pseudocolor with low ratio (low Ca2+) represented by blue and high ratio (high Ca2+) represented by yellow/red.
For somite imaging, 2–6 somite stage embryos were oriented in low melt agarose (0.4%) in a dorsal or lateral orientation. Time courses collected images pairs until 12–15 somite stage at 15-second intervals (Approximately 1000 images pairs). Image pairs were converted to ratio images as described above. Sequential ratio images were manually analyzed for changes in Ca2+ transients. Somite stage Ca2+ transients were defined as a localized increase in Ca2+ which persists no longer than thirty seconds.
Statistical analysis
Calculations for MO rescue experiments were made using the Fisher's exact test and the two-tailed p-value was reported. Calculations for analysis of somite stage Ca2+ transients in morphant embryos were made using One-Way Analysis of Variance (one-way ANOVA) with Tukey HSD test p-values reported.
Supporting Information
Zdroje
1. CadiganKM
NusseR
1997 Wnt signaling: a common theme in animal development. Genes Dev 11 3286 305
2. KestlerHA
KuhlM
2008 From individual Wnt pathways towards a Wnt signalling network. Philos Trans R Soc Lond B Biol Sci 363 1333 47
3. WidelitzR
2005 Wnt signaling through canonical and non-canonical pathways: recent progress. Growth Factors 23 111 6
4. WillertK
NusseR
1998 Beta-catenin: a key mediator of Wnt signaling. Curr Opin Genet Dev 8 95 102
5. KohnAD
MoonRT
2005 Wnt and calcium signaling: beta-catenin-independent pathways. Cell Calcium 38 439 46
6. CadiganKM
LiuYI
2006 Wnt signaling: complexity at the surface. J Cell Sci 119 395 402
7. DaleTC
1998 Signal transduction by the Wnt family of ligands. Biochem J 329(Pt 2) 209 23
8. KuhlM
SheldahlLC
ParkM
MillerJR
MoonRT
2000 The Wnt/Ca2+ pathway: a new vertebrate Wnt signaling pathway takes shape. Trends Genet 16 279 83
9. HeisenbergCP
Solnica-KrezelL
2008 Back and forth between cell fate specification and movement during vertebrate gastrulation. Curr Opin Genet Dev 18 311 6
10. SepichDS
MyersDC
ShortR
TopczewskiJ
MarlowF
2000 Role of the zebrafish trilobite locus in gastrulation movements of convergence and extension. Genesis 27 159 73
11. LinF
ChenS
SepichDS
PanizziJR
ClendenonSG
2009 Galpha12/13 regulate epiboly by inhibiting E-cadherin activity and modulating the actin cytoskeleton. J Cell Biol 184 909 21
12. WebbSE
MillerAL
2000 Calcium signalling during zebrafish embryonic development. Bioessays 22 113 23
13. SlusarskiDC
CorcesVG
2000 Calcium imaging in cell-cell signaling. Methods Mol Biol 135 253 61
14. SlusarskiDC
PelegriF
2007 Calcium signaling in vertebrate embryonic patterning and morphogenesis. Dev Biol 307 1 13
15. SlusarskiDC
Yang-SnyderJ
BusaWB
MoonRT
1997 Modulation of embryonic intracellular Ca2+ signaling by Wnt-5A. Dev Biol 182 114 20
16. FreisingerCM
SchneiderI
WestfallTA
SlusarskiDC
2008 Calcium dynamics integrated into signalling pathways that influence vertebrate axial patterning. Philos Trans R Soc Lond B Biol Sci 363 1377 85
17. SchneiderI
HoustonDW
RebagliatiMR
SlusarskiDC
2008 Calcium fluxes in dorsal forerunner cells antagonize beta-catenin and alter left-right patterning. Development 135 75 84
18. Lyman GingerichJ
WestfallTA
SlusarskiDC
PelegriF
2005 hecate, a zebrafish maternal effect gene, affects dorsal organizer induction and intracellular calcium transient frequency. Dev Biol 286 427 39
19. ReinhardE
YokoeH
NieblingKR
AllbrittonNL
KuhnMA
1995 Localized calcium signals in early zebrafish development. Dev Biol 170 50 61
20. GillandE
MillerAL
KarplusE
BakerR
WebbSE
1999 Imaging of multicellular large-scale rhythmic calcium waves during zebrafish gastrulation. Proc Natl Acad Sci U S A 96 157 61
21. WebbSE
MillerAL
2003 Imaging intercellular calcium waves during late epiboly in intact zebrafish embryos. Zygote 11 175 82
22. SlusarskiDC
CorcesVG
MoonRT
1997 Interaction of Wnt and a Frizzled homologue triggers G-protein-linked phosphatidylinositol signalling. Nature 390 410 3
23. WestfallDJ
1997 Managed indemnity insurance–a clear choice for health plan sponsors. Empl Benefits J 22 26 8
24. WestfallTA
BrimeyerR
TwedtJ
GladonJ
OlberdingA
2003 Wnt-5/pipetail functions in vertebrate axis formation as a negative regulator of Wnt/beta-catenin activity. J Cell Biol 162 889 98
25. HollowayBA
Gomez de la Torre CannyS
YeY
SlusarskiDC
FreisingerCM
2009 A novel role for MAPKAPK2 in morphogenesis during zebrafish development. PLoS Genet 5 e1000413 doi:10.1371/journal.pgen.1000413
26. WestfallTA
HjertosB
SlusarskiDC
2003 Requirement for intracellular calcium modulation in zebrafish dorsal-ventral patterning. Dev Biol 259 380 91
27. WodarzA
NusseR
1998 Mechanisms of Wnt signaling in development. Annu Rev Cell Dev Biol 14 59 88
28. MalbonCC
2004 Frizzleds: new members of the superfamily of G-protein-coupled receptors. Front Biosci 9 1048 58
29. FredrikssonR
LagerstromMC
LundinLG
SchiothHB
2003 The G-protein-coupled receptors in the human genome form five main families. Phylogenetic analysis, paralogon groups, and fingerprints. Mol Pharmacol 63 1256 72
30. WangHY
LiuT
MalbonCC
2006 Structure-function analysis of Frizzleds. Cell Signal 18 934 41
31. AhumadaA
SlusarskiDC
LiuX
MoonRT
MalbonCC
2002 Signaling of rat Frizzled-2 through phosphodiesterase and cyclic GMP. Science 298 2006 10
32. KatanaevVL
PonzielliR
SemerivaM
TomlinsonA
2005 Trimeric G protein-dependent frizzled signaling in Drosophila. Cell 120 111 22
33. GilmanAG
1987 G proteins: transducers of receptor-generated signals. Annu Rev Biochem 56 615 49
34. RossEM
WilkieTM
2000 GTPase-activating proteins for heterotrimeric G proteins: regulators of G protein signaling (RGS) and RGS-like proteins. Annu Rev Biochem 69 795 827
35. HollingerS
HeplerJR
2002 Cellular regulation of RGS proteins: modulators and integrators of G protein signaling. Pharmacol Rev 54 527 59
36. De VriesL
ZhengB
FischerT
ElenkoE
FarquharMG
2000 The regulator of G protein signaling family. Annu Rev Pharmacol Toxicol 40 235 71
37. SiderovskiDP
WillardFS
2005 The GAPs, GEFs, and GDIs of heterotrimeric G-protein alpha subunits. Int J Biol Sci 1 51 66
38. WatsonN
LinderME
DrueyKM
KehrlJH
BlumerKJ
1996 RGS family members: GTPase-activating proteins for heterotrimeric G-protein alpha-subunits. Nature 383 172 5
39. HeplerJR
BermanDM
GilmanAG
KozasaT
1997 RGS4 and GAIP are GTPase-activating proteins for Gq alpha and block activation of phospholipase C beta by gamma-thio-GTP-Gq alpha. Proc Natl Acad Sci U S A 94 428 32
40. KozasaT
1998 [Regulation of G protein-mediated signaling pathways by RGS proteins]. Seikagaku 70 1418 22
41. KudohT
TsangM
HukriedeNA
ChenX
DedekianM
2001 A gene expression screen in zebrafish embryogenesis. Genome Res 11 1979 87
42. RauchGJ
HammerschmidtM
BladerP
SchauerteHE
StrahleU
1997 Wnt5 is required for tail formation in the zebrafish embryo. Cold Spring Harb Symp Quant Biol 62 227 34
43. FreisingerCM
HoustonDW
SlusarskiDC
2008 Image analysis of calcium release dynamics. Methods Mol Biol 468 145 56
44. ChangDC
MengC
1995 A Localized Elevation of Cytosolic Free Calcium is Associated with Cytokinesis in the Zebrafish Embryo. The Journal of Cell Biology 131 1539 1545
45. LechleiterJ
GiraS
PeraltaE
ClaphamD
1991 Spiral Calcium Wave Propagation and Annihilation in Xenopus laevis Oocytes. Science 252 123 126
46. SrinivasaSP
WatsonN
OvertonMC
BlumerKJ
1998 Mechanism of RGS4, a GTPase-activating protein for G protein alpha subunits. J Biol Chem 273 1529 33
47. TesmerJJ
BermanDM
GilmanAG
SprangSR
1997 Structure of RGS4 bound to AlF4–activated G(i alpha1): stabilization of the transition state for GTP hydrolysis. Cell 89 251 61
48. NatochinM
McEntafferRL
ArtemyevNO
1998 Mutational analysis of the Asn residue essential for RGS protein binding to G-proteins. J Biol Chem 273 6731 5
49. MorcosPA
2000 Gene switching: analyzing a broad range of mutations using steric block antisense oligonucleotides. Methods Enzymol 313 174 89
50. KimmelCB
BallardWW
KimmelSR
UllmannB
SchillingTF
1995 Stages of embryonic development of the zebrafish. Dev Dyn 203 253 310
51. CretonR
SpeksnijderJE
JaffeLF
1998 Patterns of free calcium in zebrafish embryos. J Cell Sci 111(Pt 12) 1613 22
52. WebbSE
MillerAL
2006 Ca2+ signaling during vertebrate somitogenesis. Acta Pharmacol Sin 27 781 90
53. GaoC
ChenYG
Dishevelled: The hub of Wnt signaling. Cell Signal 22 717 27
54. AngersS
ThorpeCJ
BiecheleTL
GoldenbergSJ
ZhengN
2006 The KLHL12-Cullin-3 ubiquitin ligase negatively regulates the Wnt-beta-catenin pathway by targeting Dishevelled for degradation. Nat Cell Biol 8 348 57
55. JungH
KimHJ
LeeSK
KimR
KopachikW
2009 Negative feedback regulation of Wnt signaling by Gbetagamma-mediated reduction of Dishevelled. Exp Mol Med 41 695 706
56. WebbSE
MillerAL
2007 Ca2+ signalling and early embryonic patterning during zebrafish development. Clin Exp Pharmacol Physiol 34 897 904
57. DohlmanHG
ApanieskD
ChenY
SongJ
NusskernD
1995 Inhibition of G-protein signaling by dominant gain-of-function mutations in Sst2p, a pheromone desensitization factor in Saccharomyces cerevisiae. Mol Cell Biol 15 3635 43
58. KoelleMR
HorvitzHR
1996 EGL-10 regulates G protein signaling in the C. elegans nervous system and shares a conserved domain with many mammalian proteins. Cell 84 115 25
59. LiuT
DeCostanzoAJ
LiuX
WangH
HallaganS
2001 G protein signaling from activated rat frizzled-1 to the beta-catenin-Lef-Tcf pathway. Science 292 1718 22
60. LiuX
LiuT
SlusarskiDC
Yang-SnyderJ
MalbonCC
1999 Activation of a frizzled-2/beta-adrenergic receptor chimera promotes Wnt signaling and differentiation of mouse F9 teratocarcinoma cells via Galphao and Galphat. Proc Natl Acad Sci U S A 96 14383 8
61. FeiginME
MalbonCC
2007 RGS19 regulates Wnt-beta-catenin signaling through inactivation of Galpha(o). J Cell Sci 120 3404 14
62. WuC
ZengQ
BlumerKJ
MuslinAJ
2000 RGS proteins inhibit Xwnt-8 signaling in Xenopus embryonic development. Development 127 2773 84
63. SchulteG
BryjaV
2007 The Frizzled family of unconventional G-protein-coupled receptors. Trends Pharmacol Sci 28 518 25
64. ForceT
WoulfeK
KochWJ
KerkelaR
2007 Molecular scaffolds regulate bidirectional crosstalk between Wnt and classical seven-transmembrane-domain receptor signaling pathways. Sci STKE 2007 pe41
65. CironeP
LinS
GriesbachHL
ZhangY
SlusarskiDC
2008 A role for planar cell polarity signaling in angiogenesis. Angiogenesis
66. ParmaleeNL
KitajewskiJ
2008 Wnt signaling in angiogenesis. Curr Drug Targets 9 558 64
67. ZerlinM
JuliusMA
KitajewskiJ
2008 Wnt/Frizzled signaling in angiogenesis. Angiogenesis 11 63 9
68. AlbigAR
SchiemannWP
2005 Identification and characterization of regulator of G protein signaling 4 (RGS4) as a novel inhibitor of tubulogenesis: RGS4 inhibits mitogen-activated protein kinases and vascular endothelial growth factor signaling. Mol Biol Cell 16 609 25
69. WesterfieldM
1995 The zebrafish book: a guide for the laboratory use of zebrafish (Danio rerio) (Eugene, OR, M. Westerfield)
70. ThisseC
ThisseB
SchillingTF
PostlethwaitJH
1993 Structure of the zebrafish snail1 gene and its expression in wild-type, spadetail and no tail mutant embryos. Development 119 1203 15
71. LongS
RebagliatiM
2002 Sensitive two-color whole-mount in situ hybridizations using digoxygenin - and dinitrophenol-labeled RNA probes. Biotechniques 32 494, 496, 498 passim
72. ChangDC
MengC
1995 A localized elevation of cytosolic free calcium is associated with cytokinesis in the zebrafish embryo. J Cell Biol 131 1539 45
73. LechleiterJ
GirardS
PeraltaE
ClaphamD
1991 Spiral calcium wave propagation and annihilation in Xenopus laevis oocytes. Science 252 123 6
Štítky
Genetika Reprodukční medicínaČlánek vyšel v časopise
PLOS Genetics
2010 Číslo 7
Nejčtenější v tomto čísle
- CHD7 Targets Active Gene Enhancer Elements to Modulate ES Cell-Specific Gene Expression
- Extensive DNA End Processing by Exo1 and Sgs1 Inhibits Break-Induced Replication
- Question and Answer: An Anniversary Interview with Jane Gitschier
- Multi-Variant Pathway Association Analysis Reveals the Importance of Genetic Determinants of Estrogen Metabolism in Breast and Endometrial Cancer Susceptibility