
Dynamic Deposition of Histone Variant H3.3 Accompanies Developmental Remodeling of the Transcriptome
In animals, replication-coupled histone H3.1 can be distinguished from replication-independent histone H3.3. H3.3 variants are enriched at active genes and their promoters. Furthermore, H3.3 is specifically incorporated upon gene activation. Histone H3 variants evolved independently in plants and animals, and it is unclear whether different replication-independent H3.3 variants developed similar properties in both phyla. We studied Arabidopsis H3 variants in order to find core properties of this class of histones. Here we present genome-wide maps of H3.3 and H3.1 enrichment and the dynamic changes of their profiles upon cell division arrest. We find H3.3 enrichment to positively correlate with gene expression and to be biased towards the transcription termination site. In contrast with H3.1, heterochromatic regions are mostly depleted of H3.3. We report that, in planta, dynamic changes in H3.3 profiles are associated with the extensive remodeling of the transcriptome that occurs during cell differentiation. We propose that H3.3 dynamics are linked to transcription and are involved in resetting covalent histone marks at a genomic scale during plant development. Our study suggests that H3 variants properties likely result from functionally convergent evolution.
Published in the journal:
. PLoS Genet 8(5): e32767. doi:10.1371/journal.pgen.1002658
Category:
Research Article
doi:
https://doi.org/10.1371/journal.pgen.1002658
Summary
In animals, replication-coupled histone H3.1 can be distinguished from replication-independent histone H3.3. H3.3 variants are enriched at active genes and their promoters. Furthermore, H3.3 is specifically incorporated upon gene activation. Histone H3 variants evolved independently in plants and animals, and it is unclear whether different replication-independent H3.3 variants developed similar properties in both phyla. We studied Arabidopsis H3 variants in order to find core properties of this class of histones. Here we present genome-wide maps of H3.3 and H3.1 enrichment and the dynamic changes of their profiles upon cell division arrest. We find H3.3 enrichment to positively correlate with gene expression and to be biased towards the transcription termination site. In contrast with H3.1, heterochromatic regions are mostly depleted of H3.3. We report that, in planta, dynamic changes in H3.3 profiles are associated with the extensive remodeling of the transcriptome that occurs during cell differentiation. We propose that H3.3 dynamics are linked to transcription and are involved in resetting covalent histone marks at a genomic scale during plant development. Our study suggests that H3 variants properties likely result from functionally convergent evolution.
Introduction
Histones are not static scaffolding proteins but dynamic actors involved in many aspects of chromatin related functions. They are targets of chromatin modifiers that deposit covalent modifications on histone tails and thereby influence chromatin properties and affect transcriptional and translational activities. Histones H3 can be subdivided into several classes. In addition to the centromeric variant CENH3 [1], the variants H3.1 and H3.3 are highly similar in their amino acid composition, yet they are incorporated into the chromatin through different pathways [2], [3]. H3.1 is predominantly expressed and therefore incorporated during DNA replication, while H3.3 is deposited throughout the cell cycle [4]–[8].
To date, many studies in animal species show that H3.3, in contrast to H3.1, is distinctly distributed along the genome. Drosophila H3.3 is enriched in euchromatic regions, at loci of active gene expression [3]. Induction of gene expression leads to H3.3 enrichment, a process that is linked to transcription [9]. H3.3 densities over genes correlate with those of RNA polymerase II (RNAPII) [10], [11]. Similarly, mammalian H3.3 is enriched at actively transcribed genes, correlating with the presence of RNAPII [12]–[14]. As observed in Drosophila, induction of gene expression leads to enrichment of H3.3 [15], suggesting that H3.3 deposition over active genes might be driven by nucleosome displacement in the course of transcription [10].
In mammals, H3.3 enrichment has also been detected over telomeres, repressed genes and pericentric heterochromatin, resulting from deposition by distinct chaperone complexes [13], [16]–[18]. Furthermore, H3.3 marks the boundaries of cis-regulatory elements and is enriched over promoters of actively transcribed genes in Drosophila and mammals [12], [19], [20], indicating that the H3.3 enrichment over active genes and their promoters is a common and conserved feature of H3.3 in animal species.
Based on DNA sequences and gene structure, it is clear that H3.1 and H3.3 have evolved separately in animals and plants [21]–[25]. Yet, in both groups four amino acid changes distinguish the two H3 classes. While three of these four changes are located at positions 31, 87 and 90 in animals and plants, the actual amino acid changes are different. Both animal and plant H3.1 genes do not contain introns, but plant H3.1 genes are not organized in clusters like animal H3.1 genes [26]. As a result, plant H3.1 (and H3.3) transcripts are polyadenylated [27].
In contrast to animals, the knowledge about plant histone H3 is limited. Although it is likely that plant H3.1 expression is coupled to the cell cycle as in animals [22], [28]–[31], it has not been demonstrated clearly that H3 variant incorporation to chromatin is cell cycle regulated. H3 dynamics have been associated with a potential reprogramming event in the zygote [31]. Although it was demonstrated that amino acid residues 87 and 90 are essential [32] the mechanisms of H3.3 incorporation remain unclear and its link with transcriptional activity has not been established in plants. Here, we present the first genome-wide map of Arabidopsis H3.3 and H3.1 enrichment in chromatin and clarify their specificities regarding genomic features and cell cycle regulation.
Results/Discussion
To generate genome-wide maps of H3 variant localization, we performed Chromatin-Immunoprecipitation followed by deep sequencing (ChIP-Seq). We detected the localization of fusion proteins between a green fluorescent protein (GFP) tag and histone variants expressed under their endogenous promoter in transgenic plants. As a positive control, we used an H3 antibody recognizing the C-terminal part of H3, while an anti-IgG antibody was used as a negative control. The Arabidopsis genome contains three H3.3 genes encoding the same protein and we tagged HTR5 (HISTONE THREE RELATED 5), the most highly expressed gene of the family [31]. Similarly, we tagged HTR13, one of the five genes encoding the unique H3.1 protein in Arabidopsis [31]. The protein fusions HTR5::GFP and HTR13::GFP will hereafter be referred to as H3.3 and H3.1, respectively. A previous study in mammals has efficiently used GFP-family tags (EYFP) to perform ChIP and detected genome wide H3.1 and H3.3 incorporation [13]. Although the EYFP tag is rather large, this previous study did not report significant differences between the localization of H3 variants fused to EYFP or to HA tags [13], prompting us to use GFP tags in our study. In order to investigate H3 variant deposition dynamics during development, we harvested two types of tissue. First we used a sample comprising the meristem with leaf primordia and young leaves, which are enriched in cells still undergoing cell division (hereafter referred to as “dividing tissue”). We compared our results to those obtained from mature leaves harboring mostly differentiated, non-dividing cells (hereafter referred to as “non-dividing tissue”). Two biological replicates were generated for each sample (Figure S1, Table S1).
H3 Variants Mark Different Genomic Features
We investigated the global distribution of H3.3 in comparison to H3.1 on major genomic features in dividing tissue (Figure 1). A browser view of the complete chromosome 4 showed that H3.3 signal decreased over the centromeric region in comparison to the chromosome arms (Figure 1A, green). Similarly, low H3.3 enrichment was observed on average around the centromeres of all five Arabidopsis nuclear chromosomes (Figure 1B, green). In contrast, H3.1 showed a more uniform signal along the genome (Figure 1A and 1B, orange). H3 levels were slightly increased over the centromeres (Figure 1A and 1B, blue), which was not surprising considering that nucleosome density has been reported to increase over pericentromeric regions [33]. Histone H3 lysine 9 dimethylation (H3K9me2) is a typical mark of constitutive heterochromatic regions found at the centromeres [34], [35]. We observed a clear anti-correlation between H3.3 and previously published H3K9me2 enrichment [36] over centromeres and at the heterochromatic knob (Figure 1A and 1B, grey).

We tested whether the anti-correlation between H3K9me2 and H3.3 was consistent at other smaller heterochromatic domains scattered along the chromosome arms. We used as a reference the four chromatin states (CS1 to CS4), defined in a previous study combining twelve different covalent histone marks [37]. We compared the distribution of H3.3 and H3.1 enrichment over these regions with the distribution of two histone modifications that mark active (H3K4me3) and inactive domains (H3K9me2) [37] (Figure 1C). CS3 is mostly enriched in H3K9me2, H4K20me1 and H3K27me1, and predominantly contains transposable element (TE) sequences [37]. CS3 thereby defines regions of constitutive heterochromatin, including the centromere and the heterochromatic knob. We observed that CS3 showed the lowest H3.3 levels among the four chromatin states. H3K4me3 levels are also low in CS3 regions [37] (Figure 1C).
CS1 and CS2 are predominantly associated with genes [37]. CS1 regions are mostly enriched in H3K4me3, H3K9me3 and H3K36me3 [37] (Figure 1C) and mark active genes, while CS2 domains are mostly enriched in marks associated with transcriptional repression (i.e. H3K27me3 and H3K27me2) [37]. H3.1 enrichment was quite similar over active (CS1) and repressed genes (CS2). Conversely, H3.3 appeared to be preferentially associated with CS1 rather than CS2 (Figure 1C). CS4, which defines regions without any prevalent histone mark [37], did not show preferential enrichment of H3.3 or H3.1, both profiles being similar to the H3 and IgG control profiles (Figure 1C). Overall, H3.1 was more evenly distributed than H3.3 over the different chromatin states (Figure 1C).
These results motivated the analysis of the H3 variant distribution over general genomic features including protein-coding genes, TEs and inter-annotation regions (IRs) (Figure 1D). The median values of H3.3 and H3.1 were similar over each feature, except over TEs where H3.3 enrichment was much lower than that of H3.1. This was consistent with poor H3.3 enrichment over TE-enriched CS3 (Figure 1C). Both H3 variants were associated similarly with IRs (Figure 1D). Notably, we obtained similar results for the H3.3 and H3.1 enrichment in dividing (Figure 1) and non-dividing (Figure S2) tissue. Moreover, there was no enrichment of either H3.3 or H3.1 at potential transcription factors binding sites (TFBS) from non-exonic regions (Figure S3).
In summary, the even distribution of H3.1 over all genomic features, similar to H3, suggests that H3.1 serves as a rather static chromatin backbone. In contrast, H3.3 appears to be more associated with active genes (CS1) than with repressed ones (CS2) and is depleted in regions of constitutive heterochromatin (CS3), including centromeres and TEs. H3.3 deposition at active genes appears to be conserved in yeast, Drosophila and mammals [10], [12], [13],[38] and our results suggest that plant H3.3 shares this common feature.
Correlation of H3.3 Enrichment with Gene Expression
We next investigated the enrichment profiles of the H3 variants over protein-coding genes and their flanking intergenic sequences in dividing tissue (Figure 2A–2D). To reveal a potential preference of H3.3 enrichment at either end of the gene body, we aligned the 5′ half of all genes at their transcription start site (TSS) and their 3′ half at their transcription termination site (TTS). H3.3 signal over genes showed a marked increase towards the 3′ end (Figure 2A, green). In contrast, H3.1 did not display preferential enrichment at either gene end (Figure 2A, orange), neither was a preferential enrichment observed for the H3 or IgG profiles (Figure 2A, blue and dashed gray, respectively). Also noteworthy, both H3 variants appear to distinctly mark the gene bodies compared to their 5′ and 3′ flanking regions.
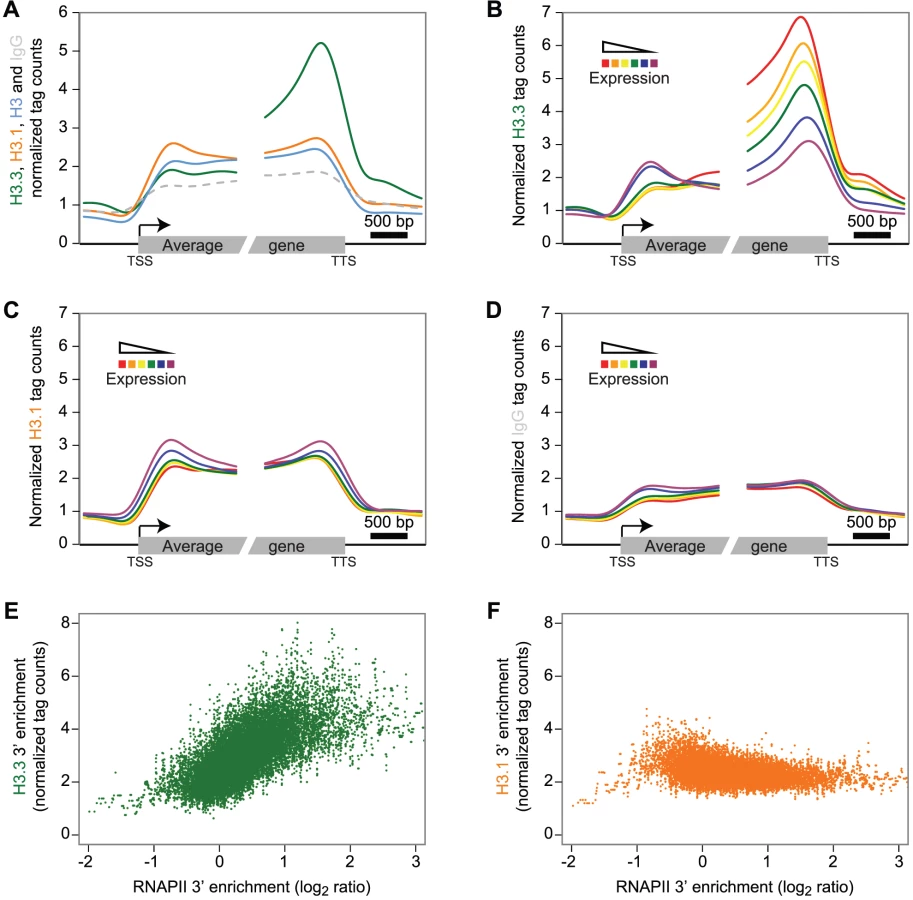
According to our results on CS1 and CS2 (Figure 1C), H3.3 might be more enriched at actively transcribed genes. We tested this hypothesis by sequencing the transcripts (mRNA-Seq) from tissue corresponding to that used for ChIP-Seq analysis (Table S1). We grouped protein-coding genes into six subsets according to their expression levels and computed, for each expression group, the average profile of the H3 variant enrichment over genes. The level of H3.3 enrichment at the 3′ end of genes correlated positively with gene expression (Spearman rank correlation of 0.53 across all genes; enrichment calculated on the 3′ last 1 kb) (Figure 2B). At the 5′ end, there was no such positive correlation; if anything, we observed a slight negative correlation. In contrast to H3.3, H3.1 enrichment did not correlate with gene expression levels (Figure 2C), neither did we detect a correlation with the control profiles of IgG (Figure 2D) or H3 (Figure S4A). Similar results were observed in non-dividing tissue (Figure S5).
In agreement with our observations, plant H3.3 is associated with several histone marks, which are correlated with active gene expression [24], [39], [40]. In contrast to H3.3 however, profiles of euchromatic histone modifications do not appear to show preferential 3′ enrichment over genes (Figure S4B) [37], [41].
Animal H3.3 enrichment shows a positive correlation to gene expression [13], [14], [42] and plant and animal H3.3 appear to share this common feature. Several studies report animal H3.3 enrichment to correlate with that of RNA polymerase II (RNAPII) [10], [11], [14]. Therefore we analyzed Arabidopsis RNAPII enrichment over genes using data published previously [33] and indeed found a 3′ preference (Figure S4C). Moreover, the enrichment of H3.3 and RNAPII calculated on the 3′ last 1 kb was positively correlated (Figure 2E, Spearman rank correlation of 0.33 across all genes, p-value<1e-275), even if the RNAPII was not profiled in the same condition. This was obviously not the case for H3.1, H3 or IgG (Figure 2F, Figure S4D–S4E). We noticed that the enrichment of H3.3 at the 3′ end also positively correlated with gene length, whereas H3.1 and RNAPII did not (Figure S6A–S6E).
In summary, plant H3.3 enrichment positively correlates with gene expression and gene length and appears to gradually increase towards the distal gene end, reaching a maximum immediately upstream of the TTS. This profile appears to be similar to that reported for C. elegans H3.3 [43]. Preferential enrichment of H3.3 towards the gene end has also been reported in mouse cells, where activation of interferon-stimulated genes leads to H3.3 incorporation preferentially at the distal coding region [15]. Similarly, in human cells H3.3 abundance appeared to show a gradual increase towards the TTS [42]. A recent study that compares H3.3 patterns over genes in mouse and human cells reports H3.3 enrichment to be highest after the TTS, a profile that correlates with that of RNAPII [14]. In plants, we find that the H3.3 enrichment at the 3′ end broadly correlates with the RNAPII profile. Hence both in plants and animals H3.3 deposition appears to be linked to or to enable co-transcriptional processes but whether this reflects similar mechanisms remains to be investigated.
While plant and animal H3.3 obviously share similar features, we observed important differences as well. H3.3 enrichment in Drosophila and mammals is not limited to the coding regions but is also high on cis-regulatory elements, repressed genes and telomeres [11]–[13], [19],[20], which appears not to be true for plant H3.3. This might be explained by a regulatory function of H3.3 in animals that has not evolved similarly in plants. The absence of enrichment of H3.3 in non-coding regions might also reflect that the Arabidopsis genome lacks long distance acting enhancers, which are common in mammals and Drosophila.
Dynamic H3.3 Replacement during Developmental Transition
We investigated the dynamics of H3.3 enrichment during the major developmental transition in vegetative plant life that leads to leaf formation. Leaf development is initiated from primordia that continuously arise from the shoot apical meristem (SAM). The SAM and the primordia comprise dividing cells [44]. Once a primordium enlarges through cell division, leaf patterning takes place while cells still divide. Subsequent cell differentiation coincides largely with the arrest of cell division. Thus, we compared H3 variant enrichment in meristem and leaf primordia (dividing tissue) and mature leaves (non-dividing tissue). Using data from cyclebase.org [45] and the transcriptomes obtained from each sample, we verified that dividing tissues expressed cell cycle regulated genes, including the five genes encoding H3.1 variants at levels higher than non-dividing tissues (Table 1 and Table S2). In animals, incorporation of H3.1 and H3.3 into chromatin depends on distinct assembly factors. While ASF1A and ASF1B are apparently required for deposition of both H3 types, the CAF-1 complex participates in H3.1 incorporation, while H3.3 incorporation depends on HIRA and DAXX [8], [13], [18], [46]. Except for DAXX, homologues of the H3 chaperones have been identified in the Arabidopsis genome (Table 1). Amongst these homologues, only the expression of the H3.1-specific CAF1 homolog FAS2 was strongly dependent on the cell cycle (Table 1). Together, the expression profiles of the H3 variants and their chaperones suggest that in Arabidopsis, as is the case in animals, H3.1 incorporation occurs primarily in dividing cells while H3.3 incorporation is largely independent of the cell cycle.

To investigate H3.3 and H3.1 dynamics during the developmental transition from primordia to differentiated leaves, we selected two subsets of genes, according to their higher expression levels (at least five-fold) in either dividing or non-dividing tissue. Having gene sets that were preferentially expressed in either of the two tissue types, we could examine the changes in H3 variant levels that accompanied repression (Figure 3A) and induction (Figure 3B) of transcription during the developmental transition from dividing tissues (plain lines) to non-dividing tissues (dashed lines). Transcriptional repression was accompanied by a strong decrease of H3.3 levels at the 3′ end (Figure 3A). Conversely, activation of gene transcription at the developmental transition was reflected in an increase of H3.3 signal at the 3′ end (Figure 3B). H3.1 levels on the other hand were not affected at genes undergoing repression (Figure 3A) or activation (Figure 3B). Similarly, different groups of genes (cell cycle regulated genes, genes expressed in only one tissue, and control genes with similar expression) also supported that H3.3 enrichment changed dynamically according to the expression modulation (Figure S7). Moreover, when considering all the genes, we observed a positive correlation between expression change and the change in H3.3 enrichment that is modest, but highly significant (Spearman rank correlation of 0.28, p-value<1e-275) (Figure 3C). This was not the case for H3.1, H3 and IgG (Figure 3C).

We conclude that the repression of gene expression during leaf differentiation is linked with a decrease in the H3.3 level, but not H3.1 level, suggesting that H3.3 may contribute to developmental transitions. Differentiation also requires the induction of gene expression, which correlates with gain of H3.3 enrichment at the 3′ end of some genes. H3.1 enrichment on the other hand, is not significantly affected by developmental transitions and appears to be a relatively stable chromatin component. This property would support a role of H3.1 in propagation of epigenetic patterns of histone modification through division, in agreement with the preference of H3.1 over H3.3 enrichment at heterochromatic regions, which need to be maintained in a transcriptional silent state.
Conclusions
There are remarkable similarities between H3 variants in animals and plants, yet phylogenetic analyses indicate that amongst metazoa and plantae, H3.1 and H3.3 variants evolved independently. However, both share similar features such as specific amino acid changes at positions 31 and 87 and the absence of introns in H3.1 [21], [23], [25]. This suggested that H3 variants in plants and animals are analogous and result from convergent evolution of similar H3 properties. In both, plants and animals H3.1 but not H3.3 expression is linked to the cell cycle [21], [47]. Furthermore, our results indicate that in Arabidopsis H3.3 is dynamically deposited over gene bodies and its enrichment is linked to gene expression. Thus, the incorporation specificities observed for H3.3 and H3.1 are largely similar between animals and plants, suggesting a functional convergence during evolution of H3 variants in eukaryotes. Whether this convergence was driven by the conservation of the distinct mechanisms that incorporate H3.1 and H3.3 remains to be established since we currently lack biochemical characterization of histone H3 chaperones in plants.
Our study outlines a specific enrichment of H3.3 culminating towards the 3′ end of genes, a phenomenon that might be linked with gene length. Noteworthy, active marks such as H3K4me3 and H3K4me36 are enriched towards the 5′ part of genes, in contrast to H3.3. Although we observe a correlation with RNAPII, the origin and significance of H3.3 enrichment at the 3′ end of genes in Arabidopsis remains unclear.
Our study addresses genome-wide dynamics of H3.3 and H3.1 enrichment during differentiation in planta. We find that gene expression changes during differentiation are reflected in H3.3 enrichment. This dynamic replacement of H3.3 potentially allows covalent histone marks present in the chromatin of dividing cells to be remodeled in order to allow repression or expression of a new repertoire of genes that participate to the differentiation program. Hence, H3 variant replacement might serve as a mechanism that enables reprogramming at developmental transitions by globally facilitating dynamics of covalent marks.
Materials and Methods
Plant Material and Growth Conditions
We used homozygous transgenic plants constructed by Mathieu Ingouff [31]. Columbia plants were agro-transfected with pHTR13:HTR13::GFP (At5g10390) for the tagged H3.1 line and with pHTR5:HTR5::GFP (At4g40040) for the tagged H3.3 line, using the destination vector pMDC107 [48], as described in [31]. Plants were grown in short day conditions (8 h light–16 h dark, 20 to 22°C) for 4 weeks after stratification at 4°C and in dark for 5 days. For harvesting the tissues used for ChIP and RNA sequencing, we dissected the plants with scalpels under a binocular scope. For the “dividing tissue” samples, we harvested the meristem and younger leaves, for the “non-dividing tissue” samples, we harvested the oldest 4 to 6 leaves.
Chromatin Immunoprecipitation (ChIP)
Nuclei enrichment was performed as previously described [49] with modifications. Tissues grinded in liquid nitrogen were fixed in 1% formaldehyde for 10 minutes, and the reaction was stopped by adding 0.125 M glycine. Nuclei were extracted by filtration through Miracloth and iterated washes and centrifugations at 2,000×g. Chromatin Immunoprecipitation was done as previously described [50] with modifications. After lysis in SDS buffer, DNA was sonicated for 8 cycles of 0.5 minute on and 1 minute off with an UCD-200TM-EX Bioruptor (Diagenode) on medium power, at 0 to 4°C. Sonicated chromatin was incubated overnight with either GFP antibodies (A11122, Invitrogen), H3 antibodies (07-690, Millipore), or IgG antibodies (ab46540-1, Abcam). After pre-clearing, magnetic protein A-beads (Dynabeads protein A, Invitrogen) were incubated with the antibodies-chromatin mix for 3 hours. After precipitation of the beads on a magnetic rack (MagnaRack, Invitrogen) and washes with increasing stringency, DNA was eluted at 65°C and reverse cross-linked with proteinase K (Fermentas). Immunoprecipitated DNA was treated with RNase A (Fermentas) and purified with the QIAquick purification kit (Qiagen). For the first biological replicate (Table S1), DNA was reverse cross-linked with Chelex resin (BioRad) 10 minutes at 95°C, and the antibody used to immunoprecipitated H3 was ab1791 (Abcam).
ChIP and RNA Sequencing
mRNA-Seq and ChIP-Seq libraries of template molecules suitable for high-throughput sequencing were constructed according to the guide lines described in the Illumina website (http://www.illumina.com/applications/sequencing/.ilmn). For mRNA-Seq libraries, briefly, 10 µg of total RNA was purified to yield poly-A containing mRNA molecules using poly-T oligo-attached magnetic beads. Following purification, the mRNA was fragmented into small pieces using divalent cations under elevated temperature. Then the cleaved RNA fragments were copied into first strand cDNA using Superscript II Reverse Transcriptase (Invitrogen) and random primers. This was then followed by second strand cDNA synthesis using DNA Polymerase I and RNaseH. These cDNA fragments then underwent an end repair process, the addition of a single ‘A’ base, and then ligation of adapters specific for sequencing flow cell. These products were then purified by gel excision and enriched by PCR with Phusion polymerase (Fermentas) to create the final cDNA library. This library was validated by loading 1 µl of the re-suspended constructs onto an Agilent Technologies 2100 Bioanalyzer DNA-1000 microfluidic chip. The final products showed a distinct band at 200–300 bp and were subsequently sequenced on an Illumina Genome Analyser IIx.
A similar process was used for ChIP-Seq libraries generation. 30 µl of chromatin-immunoprecipitated DNA was subjected to the following process: end repair by the addition of a single ‘A’ base, and then ligation of adapters specific for sequencing flow cell. These products were then purified and size-selected on gel to have fragments from 200 to 300 bp and enriched by 20 cycles PCR to create the final cDNA library (22 cycles for replicate 1). This library was validated by loading 1 µl of the re-suspended constructs onto an Agilent Technologies 2100 Bioanalyzer DNA-1000 microfluidic chip. The final products showed a distinct band at 200–300 bp and were subsequently sequenced on an Illumina Genome Analyser IIx.
Reads Mapping
The ChIP-Seq reads were mapped onto the Arabidopsis genome (TAIR9) using CASAVA v1.7. The number of mapped reads varied from 228 k to 11.9 M for the first biological replicates, and from 15.1 M to 20.7 M for the second (Table S1).
These files were then converted to 10 bp density WIG files using MACS v1.4.0 [51]. In order to be directly comparable, each WIG file was next normalized using the total number of mapped reads. We performed visual inspection of the data using a local installation of the UCSC Genome Browser [52] (http://genome.gis.a-star.edu.sg/).
The mRNA-Seq reads were mapped onto TAIR9 using recommended settings of TopHat v1.2.0 [53], Bowtie v0.12.7 [54] and Samtools v0.1.13 [55]. The number of mapped reads varied from 34.6 M to 39.4 M (Table S1). These files were then analyzed with Cufflinks v0.9.3 [56] using recommended settings to get a FPKM (Fragment Per Kilobase per Million mapped reads) value for each annotation (Table S3).
The quality of the mapped reads was assessed using FastQC v.0.9.0 (http://www.bioinformatics.bbsrc.ac.uk/projects/fastqc/).
The raw reads and processed files from both ChIP-Seq and mRNA-Seq experiments have been deposited in the NCBI Gene Expression Omnibus (GEO) (http://www.ncbi.nlm.nih.gov/geo/) and are accessible through GEO series accession number GSE36631.
Average Profiles
In order to generate the average profile over centromeres (Figure 1B and Figure S2B), the centers of the 5 centromeric regions (coordinates from [57]) were aligned and the average signal calculated into 200 kb windows over 20 Mb. An average sliding window of 1 Mb was next applied to the result. The average profiles over genes (Figure 2, Figure 3; Figures S4, S5, S6, S7) were similarly generated on the 5′ and 3′ transcriptional boundaries into 50 bp windows for each half-gene and adjacent inter-annotation regions. An average sliding window of 5 kb was next applied to the result. All these profiles were generated using a tool that will be available soon (Jacques et al., In preparation).
Note that we excluded from these analyses all mitochondrial and chloroplast genes as well as nuclear genes that overlap other annotations. We also excluded genes whose transcripts are shorter than 1 kb, except for the analysis shown in Figure S6 from which this exclusion criterion was derived (Table S3). Note that the total number of genes is not consistent because in Figure 2B, all genes expressed (FPKM>0) in at least one of the four mRNA-Seq library were used (for a total of 14048 after applying the other filters), while in the other cases we decided to be conservative and discarded ∼10% genes (3897 from 33476) with unexpected expression variation between replicates from the same tissue (variation being defined as either i) an absolute difference of FPKM higher than 1.0 (ex: FPKM of 3 in one replicate and 4.5 in the other; 1.5>1), ii) the proportion of this absolute FPKM difference was more than a third of the minimal FPKM (ex: FPKMs of 1 and 1.5; 0.5/1>0.33), iii) FPKM null in only one replicate).
Boxplot Distributions and Spearman Correlations
The boxplot distributions were generated using the boxplot function of the graphics package v2.11.1 in R, on the average signal over each feature listed. The chromatin states (CS) regions used in Figure 1C and Figure S2C were derived from [37]. Adjacent regions sharing the same status were merged. The genomic features used in Figure 1D and Figure S2D were extracted from the TAIR9 annotation file. The p-values (two-sided) were calculated using the t.test function of the package stats in R. The Spearman correlations were computed on FPKM expression values vs H3.3 enrichment of the last kb of genes. Average rank was used in cases of tied values.
For the scatterplots of Figure 2E–2F and Figure S4D–S4E, a sliding window of 10 genes was applied on both H3 variants and RNAPII enrichment. For Figure 3C a sliding window of 500 genes was applied on both the gene expression difference (div – nonDiv) and the differential enrichment difference (div – nonDiv) after ordering the data on the RNAPII or expression data respectively.
All the data used in the boxplots and scatterplots are available in Table S4.
Enhancers Analysis
Predicted Transcription Factor Binding Sites (TFBS) data from AthaMap database [58] containing ∼10 millions unique sites from 124 different matrices was converted to TAIR9 coordinates using the script “update_coordinates.pl” from “ftp://ftp.arabidopsis.org/home/tair/Software/UpdateCoord/”. Based on the authors suggestion, the number of sites per matrix was limited to 200,000 following the “restriction” procedure (http://www.athamap.de/restriction_scores.php), giving ∼4.7 millions sites. The 2,390,614 non-exonic sites were then used to generate an average profile as described above (50 bp windows over 2 kb, sliding window of 200 bp) and presented in Figure S3.
Supporting Information
Zdroje
1. DalalYBuiM 2010 Down the rabbit hole of centromere assembly and dynamics. Curr Opin Cell Biol 22 392 402
2. TagamiHRay-galletDAlmouzniGNakataniY 2004 Histone H3.1 and H3.3 Complexes Mediate Nucleosome Assembly Pathways Dependent or Independent of DNA Synthesis. Cell 116 51 61
3. AhmadKHenikoffS 2002 The histone variant H3.3 marks active chromatin by replication-independent nucleosome assembly. Mol Cell 9 1191 1200
4. AhmadKHenikoffS 2002 Histone H3 variants specify modes of chromatin assembly. Proc Natl Acad Sci U S A 99 Suppl 4 16477 16484
5. BanaszynskiLAAllisCDLewisPW 2010 Histone variants in metazoan development. Dev Cell 19 662 674
6. HenikoffSMcKittrickEAhmadK 2004 Epigenetics, histone H3 variants, and the inheritance of chromatin states. Cold Spring Harb Symp Quant Biol 69 235 243
7. TalbertPBHenikoffS 2010 Histone variants–ancient wrap artists of the epigenome. Nat Rev Mol Cell Biol 11 264 275
8. CorpetAAlmouzniG 2009 Making copies of chromatin: the challenge of nucleosomal organization and epigenetic information. Trends Cell Biol 19 29 41
9. SchwartzBEAhmadK 2005 Transcriptional activation triggers deposition and removal of the histone variant H3.3. Genes Dev 19 804 814
10. WirbelauerCBellOSchübelerD 2005 Variant histone H3.3 is deposited at sites of nucleosomal displacement throughout transcribed genes while active histone modifications show a promoter-proximal bias. Genes Dev 19 1761 1766
11. MitoYHenikoffJGHenikoffS 2005 Genome-scale profiling of histone H3.3 replacement patterns. Nat Genet 37 1090 1097
12. DauryLChailleuxCBonvalletJTroucheD 2006 Histone H3.3 deposition at E2F-regulated genes is linked to transcription. EMBO reports 7 66 71
13. GoldbergADBanaszynskiLANohK-MLewisPWElsaesserSJ 2010 Distinct Factors Control Histone Variant H3.3 Localization at Specific Genomic Regions. Cell 140 678 691
14. Ray-GalletDWoolfeAVassiasIPellentzCLacosteN 2011 Dynamics of histone h3 deposition in vivo reveal a nucleosome gap-filling mechanism for h3.3 to maintain chromatin integrity. Mol Cell 44 928 941
15. TamuraTSmithMKannoTDasenbrockHNishiyamaA 2009 Inducible deposition of the histone variant H3.3 in interferon-stimulated genes. The Journal of biological chemistry 284 12217 12225
16. DranéPOuararhniKDepauxAShuaibMHamicheA 2010 The death-associated protein DAXX is a novel histone chaperone involved in the replication-independent deposition of H3.3. Genes Dev 24 1253 1265
17. WongLHMcGhieJDSimMAndersonMAAhnS 2010 ATRX interacts with H3.3 in maintaining telomere structural integrity in pluripotent embryonic stem cells. Genome Res 20 351 360
18. LewisPWElsaesserSJNohKMStadlerSCAllisCD 2010 Daxx is an H3.3-specific histone chaperone and cooperates with ATRX in replication-independent chromatin assembly at telomeres. Proc Natl Acad Sci U S A 107 14075 14080
19. MitoYHenikoffJGHenikoffS 2007 Histone replacement marks the boundaries of cis-regulatory domains. Science 315 1408 1411
20. ChowC-MGeorgiouASzutoriszHMaia e SilvaAPomboA 2005 Variant histone H3.3 marks promoters of transcriptionally active genes during mammalian cell division. EMBO reports 6 354 360
21. WaterborgJH 2011 Evolution of histone H3: emergence of variants and conservation of post-translational modification sites. Biochem Cell Biol
22. WaterborgJHRobertsonAJ 1996 Common features of analogous replacement histone H3 genes in animals and plants. J Mol Evol 43 194 206
23. RobertsonAJKaprosTDuditsDWaterborgJH 1996 Identification of three highly expressed replacement histone H3 genes of alfalfa. DNA Seq 6 137 146
24. WaterborgJH 1991 Multiplicity of histone h3 variants in wheat, barley, rice, and maize. Plant Physiol 96 453 458
25. MalikHSHenikoffS 2003 Phylogenomics of the nucleosome. Nat Struct Biol 10 882 891
26. IngouffMBergerF 2009 Histone3 variants in plants. Chromosoma 119 27 33
27. WuSCGyorgyeyJDuditsD 1989 Polyadenylated H3 histone transcripts and H3 histone variants in alfalfa. Nucleic Acids Res 17 3057 3063
28. ChaubetNClementBGigotC 1992 Genes encoding a histone H3.3-like variant in Arabidopsis contain intervening sequences. J Mol Biol 225 569 574
29. LepetitMEhlingMChaubetNGigotC 1992 A plant histone gene promoter can direct both replication-dependent and -independent gene expression in transgenic plants. Mol Gen Genet 231 276 285
30. OkadaTEndoMSinghMBBhallaPL 2005 Analysis of the histone H3 gene family in Arabidopsis and identification of the male-gamete-specific variant AtMGH3. Plant J 44 557 568
31. IngouffMRademacherSHolecSSoljicLXinN 2010 Zygotic resetting of the HISTONE 3 variant repertoire participates in epigenetic reprogramming in Arabidopsis. Curr Biol 20 2137 2143
32. ShiLWangJHongFSpectorDLFangY 2011 Four amino acids guide the assembly or disassembly of Arabidopsis histone H3.3-containing nucleosomes. Proc Natl Acad Sci USA 108 10574 10578
33. ChodavarapuRKFengSBernatavichuteYVChenPYStroudH 2010 Relationship between nucleosome positioning and DNA methylation. Nature 466 388 392
34. JohnsonLCaoXJacobsenS 2002 Interplay between two epigenetic marks. DNA methylation and histone H3 lysine 9 methylation. Curr Biol 12 1360 1367
35. SoppeWJJasencakovaZHoubenAKakutaniTMeisterA 2002 DNA methylation controls histone H3 lysine 9 methylation and heterochromatin assembly in Arabidopsis. EMBO J 21 6549 6559
36. TurckFRoudierFFarronaSMartin-MagnietteMLGuillaumeE 2007 Arabidopsis TFL2/LHP1 specifically associates with genes marked by trimethylation of histone H3 lysine 27. PLoS Genet 3 e86 doi:10.1371/journal.pgen.0030086
37. RoudierFAhmedIBerardCSarazinAMary-HuardT 2011 Integrative epigenomic mapping defines four main chromatin states in Arabidopsis. EMBO J 30 1928 1938
38. ChoiESShinJAKimHSJangYK 2005 Dynamic regulation of replication independent deposition of histone H3 in fission yeast. Nucleic acids research 33 7102 7110
39. JohnsonLMollahSGarciaBAMuratoreTLShabanowitzJ 2004 Mass spectrometry analysis of Arabidopsis histone H3 reveals distinct combinations of post-translational modifications. Nucleic Acids Res 32 6511 6518
40. WaterborgJH 1990 Sequence Analysis of Acetylation and Methylation in Two Histone H3 Variants of Alfalfa *. The Journal of biological chemistry 265 17157 17161
41. ZhangXBernatavichuteYVCokusSPellegriniMJacobsenSE 2009 Genome-wide analysis of mono-, di - and trimethylation of histone H3 lysine 4 in Arabidopsis thaliana. Genome Biol 10 R62
42. JinCZangCWeiGCuiKPengW 2009 H3.3/H2A.Z double variant-containing nucleosomes mark ‘nucleosome-free regions’ of active promoters and other regulatory regions. Nature genetics 41 941 945
43. OoiSLHenikoffJGHenikoffS 2010 A native chromatin purification system for epigenomic profiling in Caenorhabditis elegans. Nucleic Acids Res 38 e26
44. DonnellyPMBonettaDTsukayaHDenglerREDenglerNG 1999 Cell cycling and cell enlargement in developing leaves of Arabidopsis. Dev Biol 215 407 419
45. GauthierNPJensenLJWernerssonRBrunakSJensenTS 2010 Cyclebase.org: version 2.0, an updated comprehensive, multi-species repository of cell cycle experiments and derived analysis results. Nucleic Acids Res 38 D699 702
46. ElsaesserSJGoldbergADAllisCD 2010 New functions for an old variant: no substitute for histone H3.3. Current opinion in genetics & development 20 110 117
47. OkadaTSinghMBBhallaPL 2006 Histone H3 variants in male gametic cells of lily and H3 methylation in mature pollen. Plant Mol Biol 62 503 512
48. CurtisMDGrossniklausU 2003 A gateway cloning vector set for high-throughput functional analysis of genes in planta. Plant Physiol 133 462 469
49. ItoTTakahashiNShimuraYOkadaK 1997 A serine/threonine protein kinase gene isolated by an in vivo binding procedure using the Arabidopsis floral homeotic gene product, AGAMOUS. Plant Cell Physiol 38 248 258
50. GendrelAVLippmanZMartienssenRColotV 2005 Profiling histone modification patterns in plants using genomic tiling microarrays. Nat Methods 2 213 218
51. ZhangYLiuTMeyerCAEeckhouteJJohnsonDS 2008 Model-based analysis of ChIP-Seq (MACS). Genome Biol 9 R137
52. FujitaPARheadBZweigASHinrichsASKarolchikD 2011 The UCSC Genome Browser database: update 2011. Nucleic Acids Res 39 D876 882
53. TrapnellCPachterLSalzbergSL 2009 TopHat: discovering splice junctions with RNA-Seq. Bioinformatics 25 1105 1111
54. LangmeadBTrapnellCPopMSalzbergSL 2009 Ultrafast and memory-efficient alignment of short DNA sequences to the human genome. Genome Biol 10 R25
55. LiHHandsakerBWysokerAFennellTRuanJ 2009 The Sequence Alignment/Map format and SAMtools. Bioinformatics 25 2078 2079
56. TrapnellCWilliamsBAPerteaGMortazaviAKwanG 2010 Transcript assembly and quantification by RNA-Seq reveals unannotated transcripts and isoform switching during cell differentiation. Nat Biotechnol 28 511 515
57. BernatavichuteYVZhangXCokusSPellegriniMJacobsenSE 2008 Genome-wide association of histone H3 lysine nine methylation with CHG DNA methylation in Arabidopsis thaliana. PLoS ONE 3 e3156 doi:10.1371/journal.pone.0003156
58. BulowLBrillYHehlR 2010 AthaMap-assisted transcription factor target gene identification in Arabidopsis thaliana. Database (Oxford) 2010 baq034
Štítky
Genetika Reprodukční medicínaČlánek vyšel v časopise
PLOS Genetics
2012 Číslo 5
Nejčtenější v tomto čísle
- Inactivation of a Novel FGF23 Regulator, FAM20C, Leads to Hypophosphatemic Rickets in Mice
- Genome-Wide Association of Pericardial Fat Identifies a Unique Locus for Ectopic Fat
- Slowing Replication in Preparation for Reduction
- An Essential Role for Katanin p80 and Microtubule Severing in Male Gamete Production