
Silencing Is Noisy: Population and Cell Level Noise in Telomere-Adjacent Genes Is Dependent on Telomere Position and Sir2
Genetic diversity is often high at telomeres, the chromosome ends where genes are readily amplified and modified. Phenotypic diversity, e.g., growth properties under a given condition, is affected by stochastic variations in gene expression exhibited among cells in a homogenous environment. Our studies found that individual subtelomeric genes show high variability of gene expression both between cells within a single population and also between separate sub-populations. Cell-to-cell variation, termed Telomere-Adjacent Gene Expression Noise (TAGEN), affected single telomeric genes. We found that classical telomeric silencing and TAGEN are tightly linked, with both being dependent upon proximity to telomeres and the Sir2 chromatin modifying enzyme. In addition, both are coordinately regulated locally—at the DNA level: at a telomere with transcription that is continually silenced or activated, the level of expression variability is reduced. This work provides experimental support for computational work that predicted this relationship between stochastic chromatin silencing and expression plasticity at each telomere individually. Furthermore, it demonstrates that these shifts affect the degree of cell-to cell noise of telomere-adjacent loci.
Published in the journal:
. PLoS Genet 10(7): e32767. doi:10.1371/journal.pgen.1004436
Category:
Research Article
doi:
https://doi.org/10.1371/journal.pgen.1004436
Summary
Genetic diversity is often high at telomeres, the chromosome ends where genes are readily amplified and modified. Phenotypic diversity, e.g., growth properties under a given condition, is affected by stochastic variations in gene expression exhibited among cells in a homogenous environment. Our studies found that individual subtelomeric genes show high variability of gene expression both between cells within a single population and also between separate sub-populations. Cell-to-cell variation, termed Telomere-Adjacent Gene Expression Noise (TAGEN), affected single telomeric genes. We found that classical telomeric silencing and TAGEN are tightly linked, with both being dependent upon proximity to telomeres and the Sir2 chromatin modifying enzyme. In addition, both are coordinately regulated locally—at the DNA level: at a telomere with transcription that is continually silenced or activated, the level of expression variability is reduced. This work provides experimental support for computational work that predicted this relationship between stochastic chromatin silencing and expression plasticity at each telomere individually. Furthermore, it demonstrates that these shifts affect the degree of cell-to cell noise of telomere-adjacent loci.
Introduction
Responsiveness to minor changes in the environment requires exquisitely sensitive phenotypic plasticity. This can be executed via many different mechanisms, operating on different time scales, with different types of condition-specific responses, but usually includes changes in transcriptional and translational profiles. Variation between independent populations of cells that are presumed to be isogenic can be due to altered epigenetic properties, such as chromatin status of specific genes or chromosomal regions [1], [2], to cell-to-cell variations in gene expression [3], [4]. Such population and cellular variations are likely to operate continuously in natural environments. Microbes living within a mammalian host encounter a variety of host niches. For example, organisms that reside throughout the GI tract must be able to survive conditions in the oral cavity (pH 6.5–6.9, 33–35°C), the stomach (pH 2, 37°C), the small intestine (pH 7.4, 37–40°C), and anaerobic niches in the colon. Accordingly, the ability to acclimate rapidly to changing environments is thought to provide a selective advantage and is supported by studies in yeast and bacteria [5]–[9].
Gene expression noise, defined as cell-to-cell variation in levels of transcription and/or translation, provides phenotypic diversity within an isogenic population, enabling sister cells to respond differently to environmental challenges. Noise can be extrinsic, generally assumed to be due to differences in an environment or to natural variations in cell components such as transcription or translation factors that affect multiple alleles similarly [2], [3], [10]. By contrast, intrinsic noise is allele-specific and is often due to changes in the frequency with which transcription initiates from a given promoter [11], [12]. Intrinsic noise can provide a larger range of responses to environmental conditions, because the relative amounts of one gene product to another can shift more dramatically [13]. The quantitative contributions of extrinsic and intrinsic noise can be distinguished using different fluorescent protein fusions driven from otherwise identical alleles; extrinsic noise will result in correlated relative expression of both alleles, while intrinsic noise will result in independent relative expression of each allele [13]. The degree to which these types of noise contribute to different aspects of organismal survival by producing phenotypic diversity remains to be determined.
C. albicans is an organism that survives and flourishes in a wide range of niches within its human host. It engages in a benign commensal lifestyle, residing in the oral cavity and colonizing the GI tract [14]. In some hosts, especially following antibiotic treatment or immune suppression, it switches to a pathogenic state and becomes blood-borne, colonizing internal organs including the kidney, heart, or brain. C. albicans is generally found in the diploid state and it is known to tolerate high levels of genotypic and protein variation including aneuploidy and codon ambiguity [15]–[17]. Under stress conditions, e.g. during drug exposure, certain aneuploidies can provide improved fitness, largely due to increased expression of genes specifically found in extra copies on the aneuploid chromosomes [18]–[21]. Furthermore, while aneuploidy in general often incurs a high fitness cost, some aneuploidies have very little cost, even under non-selective conditions [22]–[24]. C. albicans also has a highly variable proteome because of the ambiguous CUG codon, which encodes serine most of the time. The CUG codons also encode leucine at low frequency in cells under non-stress conditions and at higher frequencies if cells are stressed [15].
C. albicans is the most virulent of the CUG clade organisms and this is thought to be due, at least in part, to amplification of several gene families thought to be important for virulence. These include the SAP [25], LIP [26], and ALS [27] gene families that encode proteases, lipases and cell wall adhesins, respectively. The most amplified of all the gene families in C. albicans are the TLO genes, present in 1 copy in most CUG family members, in 2 copies in C. dubliniensis [28] and in 14 copies in C. albicans [29]. All but one of the TLO genes is telomere-adjacent, usually found as the most telomere-proximal, or the penultimate, gene on the chromosome [30]. The TLO gene family encodes a set of related proteins with a Med2 domain, all of which are thought to function as exchangeable Med2 subunits for the Mediator transcription regulation complex [31]. However, how TLO gene expression is regulated and whether Tlo proteins contribute to the phenotypic plasticity of C. albicans has not been explored.
In many organisms, genes at telomeres are subject to telomere position effect (TPE), a transient transcriptional silencing due to specific chromatin complexes that are thought to nucleate at the telomeres and to spread inward along the chromosome arm [32], [33]. Studies of TPE generally detect two expression states (“ON” or “OFF”) using phenotypic read outs interpreted as indicating a biphasic open or closed chromatin state at a given telomere [34]. TPE is dependent upon the Silent Information Regulator proteins Sir2p, Sir3p and Sir4p in S. cerevisiae [35], [36]. Sir2p, an NAD+-dependent histone deacetylase (HDAC), is highly conserved in prokaryotes as well as eukaryotes [37] and contributes to silencing at the telomeres of organisms ranging from S. pombe to mice [38].
In S. cerevisiae, gene expression noise has been reported to be position-dependent. In one study, noise of two unrelated genes was shown to be influenced by their positions at internal loci on two different chromosome arms [12]. Bioinformatic meta-analysis of gene expression along all chromosome arms showed increased gene noise correlated with increased:1) proximity to the telomere; 2) prevalence of genes with promoters containing TATA box motifs; 3) intermediate levels of expression and 4) transitions between silencing-specific histone modifications [39]. The latter is not surprising, given that a number of histone modifiers affect gene expression noise through effects on transcription burst size as well as burst frequency [40]. This likely occurs through the regulation of nucleosome occupancy, which is different between promoters with TATA motifs and those without TATA motifs [41] and likely involves interactions with transcription factors as well [42].
Many of the chromatin modifier genes that affect noise encode HDACs. These include RPD3 and HDA1 [40]. In C. albicans, HDACs have been characterized to some degree, with Sir2 being reported to affect phenotypic switching under at least some conditions [43] and Hst3, Hda1, and seven other chromatin modifiers have been shown to alter white-opaque switching [44], [45]. Additionally, the Set3C complex, Set3 and Hos2, inhibit the yeast-to-filamentous transition by modulating transcriptional kinetics of key morphogenic regulators [46].
The association of noise with telomere proximity has only been explored experimentally in one study using C. glabrata, a pathogenic yeast most closely related to S. cerevisiae. EPA1, a subtelomeric gene that encodes a virulence-related adhesin [47], is subject to TPE and silencing contributed to high levels of EPA1 gene expression noise [48]. This study detected effects at one telomeric locus but did not address the question of whether the effect was due to the telomere-adjacent position of the gene. Nonetheless, this work suggests that telomeric silencing by Sir2p may be associated with the highly variable expression of telomere-adjacent genes.
Here we investigated the expression of telomere-adjacent genes in C. albicans, with a focus on the TLO gene family. We detected high levels of variability between isogenic isolates at the population level, and, on average, genes that are most telomere-proximal on each chromosome have higher than average expression plasticity. Furthermore, telomere-adjacent genes exhibited high levels of noise (cell-to-cell variation in expression levels) that was largely due to intrinsic noise. Importantly, this telomere-adjacent gene expression noise (TAGEN) was dependent on genome position; TLO genes had lower noise levels when moved to an internal locus and a non-telomeric gene had higher noise when moved to a sub-telomeric locus. Similar to telomeric silencing, TAGEN was dependent upon NAD-dependent HDAC activity and, to a large degree, upon Sir2p. Finally, selection for either constitutive expression or constitutive silencing of a TLO-adjacent URA3 gene specifically reduced the expression plasticity of the neighboring TLO, in cis, but had no effect on expression plasticity at other TLO genes in trans. Thus, TAGEN generates expression variability as a consequence of dynamic, local chromatin-mediated position-dependent silencing.
Results
Subtelomeric TLO transcript and protein levels are highly variable between different populations
In the course of measuring TLO gene expression under a range of growth conditions, we found that expression levels for many individual TLO genes was strikingly variable (up to several orders of magnitude) between isogenic biological populations grown from single colonies under identical conditions (Fig. 1A–C). Furthermore, the level of TLO gene expression variation, measured as the coefficient of variation (CV; standard deviation divided by the mean; at least five replicates per gene-condition) [49], was far greater than that seen for two control genes, SOD2 and HGT20, that were expressed at similar average levels, irrespective of the growth conditions (Table S4). Transcript abundance measurements were reproducible for individual populations (average standard deviation among technical replicates = 0.63 cycles vs. 4.43 cycles between biological replicates), further supporting the idea that the population-level expression of individual TLO genes varied considerably.

Genes with high cell-to-cell variation in gene expression are often differentially expressed across a large number of environments [41]. To ask if this is the case for the TLO genes, we analyzed an RNA-Seq dataset for expression of all C. albicans genes under eleven different environmental conditions [50]. Across growth conditions, the 13 telomeric TLO genes generally had high CV values relative to the average for all C. albicans genes analyzed by RNA-seq (Fig. S1A), and, as a group, their mean CV value was significantly higher than for a set of 13 randomly chosen genes (determined by examining 50,000 simulated gene sets, p<0.025, Fig. S1B). Cells either mock-treated or exposed to a variety of stresses were equally variable (Fig. S1C). Interestingly, the CV value for TLOα34, the only non-telomeric member of the TLO gene family, had a lower CV than the average telomere-adjacent TLO gene (Fig. S1A, blue arrow).
We next asked if Tlo protein levels were also variable. To detect individual Tlo protein levels, we constructed strains with a single copy of GFP fused to a given TLO gene and detected the fusion protein with an antibody to GFP. Tlo-GFP levels were highly variable among biological replicates grown from single colonies under identical conditions. For example, when different colonies expressing Tloβ2-GFP were prepared for protein extraction from independent log-phase cultures on the same day, the levels of GFP were much more different than a similar comparison of two control proteins (Fig. 1D). Two other Tlo-GFP fusion proteins (representing all three Tlo protein clades [51] showed similar variability when examined under several growth conditions (Fig. 1E, F). Of note, differences in the protein levels of Tlos generally were less dramatic as those seen for transcripts. Nonetheless, individual Tlo protein levels varied considerably between different biological replicate populations.
TLO expression is less variable in more uniform environments
Expression variability between isolates could be the result of expression differences between whole populations or due to cell-to-cell variation within a population. We hypothesized that this high level of variability from population to population could be due to TLO gene expression differences originating from variability between colonies grown on solid agar plates. Based on the assumption that colony growth on solid media subjects cells to intense founder effects and/ot different local environments [52], [53], we asked if Tlo expression differences become less evident after cells from single colonies were propagated in liquid medium, assumed to be a more uniform environment that is also less sensitive to founder effects because cells are continuously mixed. To address this question, we compared Tloα12-GFP expression profiles from 6 individual colonies, originating from a single parent colony, that were grown on solid media plates and the same six populations after two days of passaging in a constantly agitated liquid medium (Fig. 2A). The irregular shapes of expression profiles for cells from individual colonies that were prepared for flow cytometry (by propagation in liquid medium for two hours), suggested that these cultures contained mixtures of different subpopulations. Furthermore, these profile shapes were different for the six colonies, suggesting different founder effects. Because cells lifted from a colony are closely related both genetically and epigenetically (more likely to be in the same silencing state), we think variability in silencing states and, potentially, the local environments within a colony produce these profile differences. In contrast, passaging the same colony isolates in liquid medium for two days resulted in expression profiles that were more regularly shaped and more similar to one another (Figure 2).

Passaging in liquid for two days did not significantly alter Tloα12-GFP mean expression (t5 = 1.38, p = 0.29) or mean robust CV (t5 = 1.90, p = 0.12) among the five wild-type populations. However, the variance among populations was significantly reduced for both mean expression (F{5, 5} = 71.7, p = 0.0002) and robust CV (F{5, 5} = 32.7, p = 0.002) (Fig. 2C). This suggests that either the populations became more homogeneous because distinct subpopulations were better mixed in liquid culture, and/or because Tloα12-GFP expression was more uniform in a more homogenous environment.
In S. cerevisiae, Sir chromatin modifiers affect telomeric silencing, with the Sir2p NAD+-dependent histone deacetylase (HDAC) being the most evolutionarily conserved. To ask if Sir2 regulates the colony-to-colony variation observed, we performed flow cytometry on different colonies expressing Tloα12-GFP in a sir2Δ/Δ strain. Mean fluorescence of Tloα12-GFP in a sir2Δ/Δ background did not change (t5 = −2.13, p = 0.087), while Robust CV significantly decreased (t5 = 14.01, p<0.0001) after liquid passaging (Fig. 2B, C). As in the wild-type background, both fluorescence intensity and Robust CV show less population-to-population variability after liquid passaging (mean fluorescence: F{5, 5} = 10.93, p = 0.020; CV: F{5, 5} = 8.76, p = 0.035). Comparing the variance among populations of wild-type and sir2Δ/Δ cells, the wild-type populations were always more variable than the sir2Δ/Δ populations, regardless of the parameter or the timepoint (D0, mean fluorescence: F{5, 5} = 93.62, p = 0.0001; D2, mean fluorescence: F{5, 5} = 14.27, p = 0.011; D0, CV: F{5, 5} = 62.22, p = 0.0003; D2, CV: F{5, 5} = 16.65, p = 0.0078). Thus, the absence of Sir2 protein reduced the founders effect seen in WT populations isolated from different colonies, suggesting that the function of wild-type Sir2 is to mediate the variation in expression of Tloα12-GFP.
To further test the founder effect on Tlo expression, we examined expression of Tloα12-GFP protein in cells originating from opposite sides of the same colony. Interestingly, flow cytometry profiles (after 2 hours of liquid growth) differed for the different colony regions (Fig. 2D), suggesting that populations of cells within a colony have different degrees of expression and that each population can have different levels of cell-to-cell noise. It also implies that the reduction in noise following overnight growth in liquid is not a simple function of more uniform mixing in the liquid media. Thus, it appears that colony regions have different levels of expression and of cell-to-cell noise (Fig. 2A, C, D). In contrast, flow cytometry profiles of Tloα12-GFP expression from different parts of a single sir2Δ/Δ colony were similar (Fig. 2E). Therefore, expression variability between and within single colonies is Sir2p-dependent. Furthermore, although microenvironments may differ within a colony [52], expression levels do not vary considerably within sir2Δ/Δ colonies, suggesting that the variation seen in wild-type cells is either not due to microenvironmental differences or that Sir2 is required to sense those microenvironmental differences. We propose that the variation at Tlo genes is primarily a function of intrinsic noise rather than a response to the microenvironment.
To address the degree of heritability of Tloα12-GFP expression levels and expression noise, we analyzed the expression level of mother-daughter cell pairs by pedigree analysis. We isolated 10 mother-daughter pairs, dissected buds from mothers, and allowed them to grow separately on a plate for 18 hours (Fig. 3A). We compared populations of 50 cells from individual mothers to 50 cells from their own daughters to ask if these related populations were more similar to one another than expected by chance (Fig. 3B). The mean difference in absolute ln(expression) was 0.58 for the mother-daughter pairs and was 1.24 for randomized daughter pairs, with the 5% quantile at 0.96. Thus, the mother-daughter pairs were significantly similar to one another (p≤0.0001) than expected by chance (Figure 3C). Interestingly, two daughter populations (Colonies 2 and 10, Figure 3C) did not exhibit perfect overlap with their respective mother populations, indicating that expression similarity, although heritable, can diverge over a small number of generations.

Tlo abundance varies from cell to cell
The studies above analyzed primarily variation in mean and CV of populations of cells. Gene expression noise is studied at the level of cell-to-cell differences, so we next measured cell-to-cell variation using fluorescence microscopy of individual cells isolated from multiple populations (originating from single colonies). We analyzed the cell-cell variation (measured as CV) within each population (founded from a single colony), and also compared the CV between different populations. For microscopy studies we analyzed 50 cells from each population of five Tloα and Tloβ clade fusion proteins, which localize to the nucleus and are expressed at higher levels (and thus are more detectable by fluorescence microscopy than Tloγ-clade genes) [51].
Strikingly, the fluorescence signal for subtelomeric Tlo genes varied dramatically from cell-to-cell, ranging from very bright cells to cells with no obvious signal (Fig. 4A, B). The level of population-to-population variation was also higher for subtelomeric Tlo genes, consistent with the detection of expression plasticity at the population level (Fig. 1). Growth under stress conditions (5 mM H2O2 or cell wall stress) also resulted in high levels of Tloα12 cell-to-cell variation (Fig. S2; p<0.001; significance determined using a bootstrap procedure that compared the measured ratio of CVNup49-GFP/CVTloα12-GFP against the critical value obtained from 10,000 simulated datasets that randomized the background of measured cells). Consistent with the RNA-seq results, the non-telomeric Tloα34-GFP gene, exhibited minimal cell-to-cell and population-to-population variation (Fig. 4A, B).

To measure gene expression levels for much larger numbers of cells, we analyzed GFP expression levels using flow cytometry (100,000 cells per population). Nup49, which encodes a nuclear pore component expressed at similar average levels to the Tloα and Tloβ proteins, exhibited minimal variation between cells within a population (evident by examining the peak width) and between populations (Fig. 4C, S3). In contrast, both cell-cell and population-population variability was much greater for Tlo-GFP than for Nup49-GFP fluorescence levels (Fig. 4C).
Tlo cell-to-cell noise is intrinsic
Two general sources of cell-to-cell variation have been explored extensively in many different species [1], [3], [12], [13], [40]. Extrinsic noise is due to conditions that differ between cells, such as a general level of ribosome or a local exposure to different growth conditions (Fig. 2). In contrast, intrinsic noise operates independently on different alleles of the same gene or promoter. The classic method to distinguish between extrinsic and intrinsic noise is to tag two different alleles of the same gene/promoter with two different fluorescent proteins and to observe the relative levels of each on a cell-by-cell basis. Accordingly, we tagged both alleles of TLOα12 or TLOβ2, using GFP for one allele and mCherry for the other, and determined the degree to which each of the alleles was expressed in individual cells by fluorescence microscopy (Fig. 5A). Extrinsic noise manifests as variable yet correlated expression of the two alleles, while intrinsic noise results in independent, allele-specific expression levels.

The relationship between mCherry and GFP expression in Nup49 (control), Tloα12, and Tloβ2 were clearly different, based on fluorescence intensities (Figs. 5B, S4). In each individual population (12 populations for each tagged gene, see methods) a simple correlation test between the two fluorophores indicated that there were considerable differences for the three tagged genes (Fig. S4, Table S5). We considered the 12 populations for each gene as independent because different colonies and different locations within colonies were different enough from one another that they were not good predictors of the degree of either intrinsic or extrinsic noise (Table S5). The levels of both intrinsic and extrinsic noise (extrinsic: F2, 33 = 12.8, p<0.0001; intrinsic: F2, 33 = 26.5, p<0.0001, Fig. 5C) were different for the different genes measured. Post-hoc Tukey tests indicated the difference between the two types of noise; the two TLO genes both had significantly higher intrinsic noise than Nup49. On the other hand, extrinsic noise levels were not specific to TLO genes. Tloβ2 has significantly less extrinsic noise than Nup49 or Tloα12 (which were not different from each other). Furthermore, for both TLO genes, the contribution of intrinsic noise to total noise was significantly greater than the contribution of extrinsic noise (Tloβ2: t11 = −16.8, p<0.0001; Tloα12: t11 = −6.5, p<0.0001, Nup49 t11 = 0.056, p = 0.96, Fig. 5C).
Subtelomeric position contributes to gene noise
To investigate whether increased expression plasticity is a general property of telomere-proximal genes, we examined the expression of sets of 16 genes starting with the most telomere-proximal and stepping sequentially into chromosome internal genes using the available C. albicans RNA-Seq dataset [50]. Both sets of the 16 most telomere-proximal genes (including 9 of 13 subtelomeric TLOs) and the set of 16 penultimate telomere-adjacent genes (including 4 of 13 subtelomeric TLOs) were significantly more transcriptionally variable than sets of 16 random genes (Fig. S5A, B; significance determined by a bootstrapping procedure as described above; p<0.025 in both cases). A similar trend was seen for the genes in the third-most telomere-proximal position (Fig. S5B). However, this pattern did not continue as a general trend along the chromosome (Figure S5C), indicating that any ‘spreading of TAGEN’ inwards from the telomere does not propagate more than ∼8 kb into the chromosome arms.
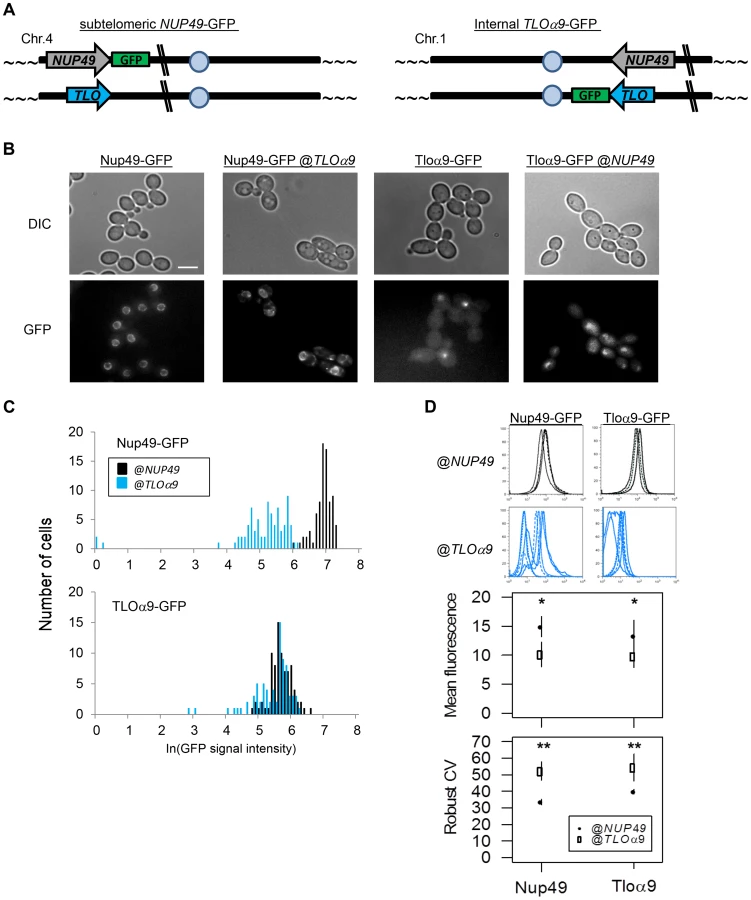
Many studies of S. cerevisiae found that differences in promoter structure correlate with differences in the amplitude of gene noise [54], [55]. To determine the extent to which telomere position and promoter structure affect the variability of TLO gene expression, we constructed two TLO-NUP49 swap strains (Fig. 6A): NUP49-GFP@TLO, in which the control gene NUP49-GFP, together with its native promoter, was moved to the sub-telomeric TLOα9 locus on the left end of Chromosome 4 (YJB12963); and TLOα9-GFP@NUP49, in which TLOα9-GFP, together with its native promoter, was moved to the internal NUP49 locus on the right arm of Chromosome 1 (YJB12966). Importantly, when either Nup49-GFP or Tloα9-GFP were expressed at the NUP49 locus, noise (as measured by fluorescence microscopy) was significantly lower than when either of these proteins was expressed from the TLOα9 locus (Fig. 6A–C, Fig. S6; p<0.05). Expression of Nup49-GFP and Tloα9-GFP was also significantly lower at the TLOα9 locus compared to the NUP49 locus (Fig. 6A–C; NUP49: t85.42 = 16.43, p<0.00001; TLOα9: t85.44 = 4.71, p<0.00001). Flow cytometric analysis of the four strains (two with tagged genes at their native loci and two with swapped loci) also indicated that genes at the subtelomeric TLOα9 locus exhibit a significant decrease in the mean fluorescence signal (position: F1 = 5.04, p = 0.038, gene: F1 = 0.93, p = 0.35) and an increase in the level of gene noise (Robust CV; position: F1 = 10.12, p = 0.005, gene: F1 = 2.10, p = 0.17) relative to the internal NUP49 locus (Fig. 6D). This suggests that the subtelomeric TLOα9 locus is sufficient to cause increased noise because it is telomere-adjacent and affected by Telomere-Adjacent Gene Expression Noise (TAGEN), which influences both population-to-population (expression plasticity) and cell-to-cell (noise) variability. Furthermore, TAGEN appears to be independent of the promoters tested.
SIR2 affects TAGEN
The Sir2p HDAC was required for TLO expression variability between colonies. Therefore, we hypothesized Sir2 may also influence TLO noise among cells in a single population. We first asked whether addition of nicotinamide (NAM), an inhibitor of NAD+-dependent HDACs, or deletion of SIR2 had an effect on TAGEN at TLO genes using qRT-PCR. Addition of NAM or the lack of Sir2p significantly reduced expression plasticity (measured with qPCR, Fig. 7A, S7; background: F1 = 6.44, p = 0.020; NAM: F1 = 7.79, p = 0.011; interaction: F1 = 3.25, p = 0.086), while neither NAM nor the absence of Sir2p significantly influenced mean TLO gene expression (Fig. S7; Sir2 background: F1 = 0.03, p = 0.86; NAM: F1 = 1.42, p = 0.25). Furthermore, the effect of deleting SIR2 together with NAM exposure affected expression and plasticity to a similar degree as either NAM or deletion of SIR2 alone: reduced variability with little effect on expression levels (interaction; CV: F1 = 3.25, p = 0.086). Similar results for wild-type vs sir2Δ/Δ mutants were obtained by microscopy (Fig. 7B, S8; p<0.05) as well as by flow cytometry of Tloα10-GFP or Tloα12-GFP (Fig. 7C; Robust CV; gene: F1 = 1.21, p = 0.29; Sir2 background: F1 = 5.44, p = 0.03; interaction: F1 = 0.165, p = 0.69). Thus, Sir2p makes a significant contribution to expression plasticity of Tloα10-GFP and Tloα12-GFP.

To ask if Sir2p contributes to the position-dependent aspect of TLO TAGEN, we compared the level of expression noise for the Nup49-GFP@TLOα9 locus in a sir2Δ/Δ strain relative to the level of expression noise for the Nup49-@TLOα9 locus in a wild-type strain. Importantly, the expression noise for Nup49-GFP was decreased in a sir2Δ/Δ strain only for Nup49-GFP@TLOα9 locus and not for Nup49-GFP at its native locus (Fig. 7D, Robust CV; position: F1 = 11.38, p = 0.005, background: F1 = 5.10, p = 0.042, interaction: F1 = 6.91, p = 0.021). Thus, the position-dependent and promoter-independent TAGEN seen at TLO genes is dependent upon Sir2p and, most likely, dependent upon its activity as a NAD+-dependent HDAC.
Other chromatin modifiers contribute to TLO TAGEN
Telomeric silencing is considered to be a process by which telomeres toggle between “OPEN” and “CLOSED” chromatin states. Such a biphasic switch would be expected to generate two subpopulations of cells that would be distinguishable by flow cytometry as having different expression peaks. Yet, expression profiles of specific Tlo-GFP fusion proteins did not exhibit two clear peaks. This could be due to regulation of TLO expression by multiple factors [4] or a relatively fast rate of switching between two expression states [56]. Thus, we explored the role of additional chromatin modifiers in the regulation of TLO expression levels and the degree of TLO TAGEN. Nine modifiers were analyzed by qRT-PCR. HST1 and SET1 influenced expression plasticity (HST1: t6 = −2.89, p = 0.028, SET1: t6 = −2.60, p = 0.041) but not expression levels (HST1: t6 = −0.99, p = 0.36, SET1: t6 = 1.20, p = 0.27), while HDA1, HOS2, HST2, PHO13, NAT4, RPD31, and SET3 had no effect on expression level or plasticity (Fig. S9 and data not shown). Consistent with the qRT-PCR results, deletion of HST1, a SIR2 paralog that affects some telomere-associated genes in S. cerevisiae [57], [58], resulted in decreased fluorescence signal for two GFP-tagged Tlo proteins, Tloα10 (t187.2 = 7.03, p<0.0001) and Tloα12 (t139.4 = 5.30, p<0.0001) (Fig. S10A, B), as measured by fluorescence microscopy. Consistent with a role for Hst1 protein at internal as well as telomeric loci, the expression noise for Nup49-GFP at its native locus was reduced in the hst1Δ/Δ strain (p<0.05). Cell to cell noise in the hst1Δ/Δ strains was reduced at Tloα12 (p<0.01) but not at Tloα10 (Fig. S10A, C), relative to noise levels in the wild-type HST1 parent strains. Thus, unlike Sir2p, which has a major position-dependent role in enhancing noise at telomere-adjacent loci, Hst1p affects expression noise at internal as well as telomere-proximal regions and it affects expression plasticity and noise of different TLO genes differently.
Telomeric silencing and TLO expression plasticity are coupled in cis
We next asked if TAGEN and TPE are functionally related by measuring TLO expression variability in cells selected for constant expression or constant silencing of a TLO-adjacent selectable marker, URA3. We measured levels of the adjacent TLO (in cis) as well as an unlinked TLO (in trans), when cells were selected for expression of URA3 (ON state selected on medium lacking uridine) or when cells were selected for repression of URA3 (OFF state selected on medium containing 5-FOA) vs cells being free to ‘toggle’ between the two states (ON and OFF states, no selection on YPAD medium). We first constructed two strains, each with URA3 inserted head-to-head at a TLO-adjacent position (adjacent to TLOα9 or TLOα12; Fig. 8A) in the subtelomeres. These strains enabled the selection of cells expressing URA3 (by growth in media lacking uracil (“-ura”)), or to select for silencing of URA3 (by growth in the presence of 5-floroorotic acid (“5-FOA”)). Growth of TLO-adjacent URA3 strains on media lacking uracil or with 5-FOA reduced or increased transcript abundance of URA3, respectively (data not shown). We then asked if selection in –ura or 5-FOA influenced TLO expression plasticity (Fig. 8B). Importantly, in both strains, selection either for or against URA3 expression significantly reduced variability of the URA3-adjacent TLO transcript levels, yet it did not affect the transcript variability at an unlinked TLO (Fig. 8C; presence of selection: F1, 20 = 40.4, p<0.0001, gene: F1, 20 = 0.28, p = 0.60, interaction: F1, 20 = 0.174, p = 0.69). This occurred without a significant effect on expression levels (Fig. S11; presence of selection: F1, 20 = 0.03, = 0.87, gene: F1, 20 = 2.48, p = 0.13, interaction: F1, 20 = 0.145, p = 0.71). Thus, TAGEN at a specific TLO locus requires that cells toggle between the ON and OFF states and is lost if expression of an adjacent gene is constitutively ON or OFF. Furthermore, the effect of telomeric silencing on TAGEN occurs in cis and does not affect silencing or TLO expression at other subtelomeres.

Discussion
Here, we discovered and characterized Telomere-Associated Gene Expression Noise (TAGEN), which is detectable not only as intrinsic variation at the cell-to-cell level but also generates variation at the population level. TAGEN is position-dependent, affecting only the most telomere-proximal genes, and it is reduced when cells are locked in a constant chromatin state or when cells are grown for multiple passages in liquid medium. TAGEN is subject to regulation by Sir2p in a position-dependent manner and also to other position-independent chromatin modifiers and transcription factors, e.g., Hst1p, which affect different TLO genes differently. Importantly, TAGEN is largely promoter-independent and it is tightly associated, in cis, with telomere position effect dynamics. Thus, TAGEN and TPE appear to reflect different aspects of the same phenomenon—the chromatin structure and its impact on gene expression at telomeres is dependent upon proximity to a telomere. Furthermore, increased expression plasticity and noise at telomere-adjacent genes (TAGEN) requires the dynamic process by which telomere-adjacent genes toggle between the ON and OFF states of expression presumably due to the OPEN and CLOSED states of telomeric chromatin.
At most genomic loci, noise is a phenomenon detectable only when cells are analyzed as individuals [13]. In contrast, TAGEN is detectable in populations of cells isolated from different colonies and also as a cell-to-cell variability largely due to intrinsic noise. The inherited epigenetic expression state is dependent upon telomere-adjacent position, SIR2, and the initial level of expression appears to exert a founder effect. Importantly, toggling or switching between the ON and OFF epigenetic state of cells in each population likely drives colony-to-colony variation seen at the population level (Fig. 8). A similar effect was seen for one telomere-adjacent gene, EPA1, in C. glabrata [48].
TAGEN is detected as large variations in levels of transcripts, measured by either qRT-PCR or by RNA-Seq (Figs. 1, S1). TAGEN is also evident at the individual cell level, when levels of GFP fusion proteins are measured by fluorescence microscopy or by flow cytometry (Figs. 2–7). This suggests that some of the transcriptional plasticity that affects TLO gene expression is buffered by post-transcriptional mechanisms, although we cannot rule out that the long half-life of GFP fusion proteins may contribute an additional buffering mechanism [59]. Since Tlo proteins are produced at levels far higher than they are needed [31], and since all TLOs encode a related subunit present in a single copy per Mediator complex, we suggest that excess Tlo proteins are likely subject to proteasome degradation [60]–[62].
Amplified gene families that promote growth within a relatively new environment are often located at telomeres. For example, S. cerevisiae strains used to produce wine, sherry or beer carry amplified MEL, SUC, and MAL genes, respectively, which promote breakdown of the predominant sugars in the respective fermentation processes. It is thought that the cost of amplification and diversification of gene family members is lower near telomeres [63]. In addition, the work here suggests that noise at telomeric loci may be exacerbated in a non-uniform environment (Fig. 2C). The fact that this noise is Sir2p-dependent suggests that it is a function of both TAGEN and TPE. Increased gene noise is also associated with duplicated genes [64], a common feature of expanded gene families at telomere ends. Based on this idea, subtelomeric loci populated with gene families would be expected to be transcriptionally noisy because of the reduced fitness costs associated with noise when multiple functional homologs are present. Bioinformatic analysis of gene expression in S. cerevisiae found that telomere-adjacent loci were expressed with higher levels of transcriptional noise [39].Thus, telomeres are not only safe neighborhoods for gene amplification but they are noisy neighborhoods for gene expression. We suggest that, because increased noise in non-uniform conditions is Sir2p-dependent, that it is intrinsic feature of TAGEN and, most likely, of TPE as well.
Intrinsic noise is generally thought to be influenced by the chromatin state at a given locus and is often ascribed to specific promoter structures or to interactions with specific components of the transcription regulation machinery. Consistent with this, most chromatin modifiers affect either the transcription burst frequency (frequency with which a promoter switches into a transcriptionally active state) and/or the transcription burst size (the total number of transcripts or proteins produced during each transcriptionally active state) [40], [56], [65]. Interestingly, mutations affecting TAGEN often reduced the noise level without causing a substantive change in gene expression levels (Figs. 7, S7, S9). We suggest that regulating the rate of switching between silent and active chromatin at telomeres will reduce the noise, even if it does not affect the net expression levels [3], [56]. Thus, TAGEN levels are dependent upon the frequency with which telomeric silencing opens and closes the chromatin.
TAGEN is dependent upon NAD+-dependent HDACs. Sir2p and the Sir2-like Hst1p contribute to TPE in S. cerevisiae as well as in Schizosaccharomyces pombe, Plasmodium falciparum and Drosophila melanogaster [66]–[68]. This provides further support for the idea that both processes are likely related to one another. TAGEN shows fairly smooth distributions of different expression levels per cell through a population (Figs. 2, 4, 6–7), yet TPE is considered a biphasic switch between two states [34], [69]. This is likely because TPE is often measured as a growth phenotype that must cross a specific threshold to be detected [33], [70] and has been considered as a largely population effect. In contrast, we measured TAGEN at the molecular level and, thus, detected a continuous distribution of expression levels and high levels of intrinsic noise. Importantly, the two processes appear to be inextricably linked: when cells with a TLO-adjacent URA3 gene were selected for URA3 expression to be either in all “OFF” or all “ON”, expression levels for the adjacent TLO gene were less variable than when no selective pressure was applied (Fig. 8D). This supports the idea that TAGEN is a consequence of dynamic switching between TPE states, rather than a consequence of silencing or depression of telomere gene expression per se.
In C. albicans, TLOs all encode the Med2 subunit of Mediator. In S. cerevisiae, Mediator interacts with Sir2 to modulate TPE [71], [72]. If a similar relationship exists in C. albicans, then one would expect Tlo proteins to be components of the silencing machinery itself. Consistent with this, a strain lacking Med3p, which interacts with Tlo proteins in the C. albicans Mediator complex tail, exhibits lower levels of TAGEN (data not shown). Thus, noisy TLO expression may contribute to TAGEN, and may proscribe an interesting feedback circuit. Whether the amplification of TLO genes has been an important adaptation for the recently evolved virulence features of C. albicans, and whether TAGEN and Mediator feedback play a role in this process remains to be determined.
Materials and Methods
Ethics statement
N/A
Growth conditions used
Yeast cells were grown in standard conditions in rich medium (YPAD) at 30°C [73] unless noted otherwise. Assays were performed by diluting an overnight culture 1∶100 in fresh YPAD and grown at 30°C, 39°C, with 10% fetal bovine serum, with 5 mM H2O2, with 100 µg/µl Congo Red, or with 2 mM nicotinamide for 4 hours, as indicated.
Strain construction
Strains are listed in Table S1. Transformations were performed using lithium acetate as previously described [73]. Strains carrying NUP49 and TLO tagged with GFP or mCherry at the C-terminus were constructed by PCR amplification from plasmid p1602 [74], p2120, or p2343 [75], which contain GFP and URA3, GFP and NAT1, or mCherry and NAT1, respectively, using primers with at least 70 bp of homology to the target gene (Table S2). Correct insertion of the fluorescent protein in frame with the relevant TLO gene was first detected as described previously [51]. Only strains in which insertion was detected as a single unambiguous PCR fragment from a single chromosome arm were analyzed further. Integration of the construct at the expected locus was confirmed by PCR, Sanger sequencing, and Southern Blot analysis as described [51].
Locus swapping strains (Fig. 4) were constructed using a PCR amplicon containing the full open reading frame (ORF) to be moved, including either all sequences up to the adjacent open reading frames or 1 kb upstream and 1 kb downstream, whichever was shorter, the fluorescent tag, and the selectable marker from previously constructed strains. Transformation and screening were performed as described above.
Quantitative reverse transcriptase-PCR (qRT-PCR) to measure TLO transcription
Transcript abundance measurements by qRT-PCR were performed as described [51] with primers listed in Table S3. Absolute quantification of SYBR fluorescence using the 2nd derivative maximum value was used to calculate ΔCT values using SEC14 as a control. All qRT-PCR results represent the average abundance of at least four independent cultures for each strain of interest.
Analysis of Illumina Whole Transcriptome Shotgun Sequencing (RNA-Seq) data
RNA-Seq data for C. albicans grown under 11 different conditions in biological duplicates was obtained from Bruno et al [50]. We determined the coefficient of variation (CV = standard deviation divided by the mean) for each gene in each of the eleven environments that data were available for. We then averaged across all environments to determine the average CV for each gene. To determine whether a group of genes was significantly more transcriptionally variable than average, we conducted a bootstrap procedure to obtain a distribution of mean CV values for a group of genes of the appropriate size (i.e., 13 to examine TLO expression plasticity, 16 to examine position effects). We simulated 50 000 gene groups using the ‘sample’ function in the R Programming Language on the 6006 ORFs measured in the Bruno dataset; the 97.5% quantile of these 50,000 datasets was used to determine the critical value.
Western blot of Tlo abundance
Protein lysates were collected as previously described [76]. Briefly, cells were inoculated into liquid YPAD cultures and grown overnight to stationary phase at 30°C with constant shaking. A 1∶100 dilution was then transferred to fresh YPAD and grown for four hours at 30°C with constant shaking prior to collecting lysates. Proteins were separated on a 12% polyacrylamide geland transferred to PVDF membrane (Immobilon-P, Millipore, Billerica, MA) as previously described [75]. Western blots were performed with mouse anti-GFP (Roche, Penzberg, Germany), rabbit anti-H4 (Santa Cruz Biotechnology, Santa Cruz, CA), and mouse anti-PSTAIR ab10345 (abcam, Cambridge, MA) followed by HRP-anti mouse or HRP-anti rabbit antibody (Santa Cruz Biotech, Santa Cruz, CA). Densitometry of band intensities was quantified using Fiji/ImageJ v1.46 (NIH, Washington D.C, District of Columbia).
Mother-daughter cell dissection
TLOα12-GFP cells were struck onto SDC agar plates. Ten single cells were isolated using an Olympus BX40 dissecting microscope and followed during growth and division. Following the first division the mother and daughter cells were separated and allowed to grow up for 18 hours on the SDC agar plate. Tloα12-GFP expression was visualized by microscopy. We compared the mean difference in absolute ln(expression) values from colonies of daughter cells with 10,000 randomized affiliations.
Fluorescence microscopy
Overnight cultures in YPAD were diluted 1∶100 in fresh SDC medium and grown at 30°C for 3–4 hours. DNA was stained with DAPI (4′,6-diamidino-2-phenylindole) (Sigma, St. Louis, MO) diluted 1∶1000 for 25 minutes, washed twice in fresh SDC, and imaged using differential interference contrast (DIC) and epifluorescence microscopy with a Nikon Eclipse E600 photomicroscope (Chroma Technology Corp., Brattleboro, VT). Digital images were collected using a CoolSnap HQ camera (Photometrics, Tucson, AZ) and MetaMorph software, version 6.2r5 (Universal Imaging Corp., Downingtown, PA). A total of 8 fields, were collected with 8 fluorescent images along the z axis, in 1-µm increments, for each cell to insure that any signal present was captured throughout the diameter of the cell. Exposure times were 500 ms for Nup49 and Tlo fluorescent fusion proteins. Projections of the z series were constructed with the stack arithmetic/sum function of MetaMorph for analysis and presentation.
Fluorescent-tagged protein abundance for each cell was measured by subtracting the average pixel intensity of three 4×4 regions of adjacent background from each of three 4×4 pixel regions within each nucleus. The signal intensity was defined as the average of the three background-subtracted nuclear regions. Nuclear signal intensity was determined for all cells in a minimum of 50 cells for each strain of interest. For all experiments, an equal number of cells were examined for expression and noise; for strains where data from more than the minimum number cells was collected, we used the ‘sample’ procedure in the R programming language [77] to randomly select cells to be analyzed.
Extrinsic and intrinsic noise was calculated as in Elowitz et. al [13]. Three strains (NUP49-GFP/NUP49-mCherry, TLOβ2-GFP/TLOβ2-mCherry, and TLOα12-GFP/TLOα12-mCherry) were streaked onto YPAD solid agar plates. Three colonies were chosen for each strain and cells from four regions of each colony were sampled (two from the edges of the colony and two from the center). These cells were suspended in liquid and the expression of the GFP and mCherry tagged genes was quantified by fluorescence microscopy for 50 cells using the method described above. The cells were also then cultured in liquid YPAD media for two days with passaging every 24 hours. Cells were taken in logarithmic growth (OD600∼0.5) after two days and 50 cells were measured again for GFP and mCherry fluorescence signal by microscopy.
Flow cytometry of GFP-tagged strains
Cells for flow cytometry were prepared using a modified protocol from Sudbery [78]. An overnight culture in YPAD was diluted 1∶100 in fresh SDC media and grown at 30°C for 3–4 hours. Cultures in mid-logarithmic growth (OD600∼0.5) were collected at 1500×g, resuspended in 4% methanol-free formaldehyde (Thermo Scientific, Rockford, IL), and incubated on a tube rotator for 30 minutes. Cells were then spun down and resuspended in ice cold methanol for 3 minutes, washed three times in 55 mM HCl, resuspended in 500 µl of 5 mg/ml pepsin in 55 mM HCl, and incubated for 30 minutes at 37°C with gentle shaking. Cells were collected by centrifugation, washed three times with 1 ml of 10 mM Tris (pH 7.5), and resuspended in 460 µl Buffer A [78]. Cells were incubated in 40 µl of 1 mg/ml Zymolyase-20T (ICN Biomedicals, New York, New York) in 0.1 M phosphate buffer (pH 7.5) and 1 µl β-mercaptoethanol for 30 minutes at 37°C with gentle shaking and washed 5 times with 1% bovine serum albumin (BSA) in phosphate-buffered saline (PBS). Cells were resuspended in 500 µl of primary antibody polyclonal anti-GFP, ab290 (abcam, Cambridge, UK) diluted 1∶1000 in 1% BSA in PBS, and incubated overnight on a rotisserie at 4°C, washed 5 times in PBS. Secondary antibody (500 µl Alexa Fluor 488 donkey anti-rabbit (Invitrogen, Carlsbad, CA) diluted 1∶2000 in 1% BSA in PBS) was added, samples were incubated 45 minutes in the dark, cells were washed 5 times with PBS, resuspended in 1 ml PBS, and sonicated at 20% duty cycle three times.
Flow cytometry was performed using a FACSCalibur (BD Biosciences, San Jose, CA). Measurements were collected for 100,000 events and analyzed using FlowJo (Ashland, OR). Events were initially examined on a plot of SSC by FSC and gated to include all events (cells) that had measurable FSC and SSC. Mean expression and the Robust CV (100*0.5*(Intensity [at 84.13 percentile] – Intensity [at 15.87 percentile])/Median) of the gated population were collected using cell fluorescence measurements from the FL1 (fluorescein/GFP) channel. These measurements were the basis for further analysis.
Silencing of TLO-adjacent URA3
Subtelomeric URA3 was inserted in a head-to-head orientation immediately upstream of the TLO promoter (∼600 bp upstream of the TLO start codon) to produce a subtelomeric, TLO-adjacent URA3. Insertion sites were identified by PCR and sequencing as well as separation of chromosomes on contour-clamped homogenous electric field (CHEF) karyotype gens and Southern blotting.
Strains containing a TLO-adjacent URA3 were grown in liquid YPAD and plated for single colonies onto YPAD for no selection of URA3 expression, synthetic complete media (SDC) lacking uracil to select for URA3 expression, and 5-floroorotic acid (5-FOA) to select for URA3 silencing [70]. Five colonies from each condition for three different experiments were assayed for gene expression by qRT-PCR as described above.
Supporting Information
Zdroje
1. Bar-EvenA, PaulssonJ, MaheshriN, CarmiM, O'SheaE, et al. (2006) Noise in protein expression scales with natural protein abundance. Nat Genet 38 : 636–643.
2. NewmanJR, GhaemmaghamiS, IhmelsJ, BreslowDK, NobleM, et al. (2006) Single-cell proteomic analysis of S. cerevisiae reveals the architecture of biological noise. Nature 441 : 840–846.
3. RaserJM, O'SheaEK (2005) Noise in gene expression: origins, consequences, and control. Science 309 : 2010–2013.
4. OctavioLM, GedeonK, MaheshriN (2009) Epigenetic and conventional regulation is distributed among activators of FLO11 allowing tuning of population-level heterogeneity in its expression. PLoS Genet 5: e1000673.
5. HerndayAD, BraatenBA, Broitman-MaduroG, EngelbertsP, LowDA (2004) Regulation of the pap epigenetic switch by CpxAR: phosphorylated CpxR inhibits transition to the phase ON state by competition with Lrp. Mol Cell 16 : 537–547.
6. MaamarH, RajA, DubnauD (2007) Noise in gene expression determines cell fate in Bacillus subtilis. Science 317 : 526–529.
7. SumnerER, AverySV (2002) Phenotypic heterogeneity: differential stress resistance among individual cells of the yeast Saccharomyces cerevisiae. Microbiology 148 : 345–351.
8. AcarM, MettetalJT, van OudenaardenA (2008) Stochastic switching as a survival strategy in fluctuating environments. Nat Genet 40 : 471–475.
9. LevySF, ZivN, SiegalML (2012) Bet hedging in yeast by heterogeneous, age-correlated expression of a stress protectant. PLoS Biol 10: e1001325.
10. LucaAC, MerschS, DeenenR, SchmidtS, MessnerI, et al. (2013) Impact of the 3D microenvironment on phenotype, gene expression, and EGFR inhibition of colorectal cancer cell lines. PLoS One 8: e59689.
11. EldarA, ElowitzMB (2010) Functional roles for noise in genetic circuits. Nature 467 : 167–173.
12. BecskeiA, KaufmannBB, van OudenaardenA (2005) Contributions of low molecule number and chromosomal positioning to stochastic gene expression. Nat Genet 37 : 937–944.
13. ElowitzMB, LevineAJ, SiggiaED, SwainPS (2002) Stochastic gene expression in a single cell. Science 297 : 1183–1186.
14. McCulloughMJ, RossBC, ReadePC (1996) Candida albicans: a review of its history, taxonomy, epidemiology, virulence attributes, and methods of strain differentiation. Int J Oral Maxillofac Surg 25 : 136–144.
15. BezerraAR, SimoesJ, LeeW, RungJ, WeilT, et al. (2013) Reversion of a fungal genetic code alteration links proteome instability with genomic and phenotypic diversification. Proc Natl Acad Sci U S A 110 : 11079–11084.
16. SelmeckiAM, DulmageK, CowenLE, AndersonJB, BermanJ (2009) Acquisition of aneuploidy provides increased fitness during the evolution of antifungal drug resistance. PLoS Genet 5: e1000705.
17. ArbourM, EppE, HoguesH, SellamA, LacroixC, et al. (2009) Widespread occurrence of chromosomal aneuploidy following the routine production of Candida albicans mutants. FEMS Yeast Res 9 : 1070–1077.
18. SelmeckiA, ForcheA, BermanJ (2006) Aneuploidy and isochromosome formation in drug-resistant Candida albicans. Science 313 : 367–370.
19. YonaAH, ManorYS, HerbstRH, RomanoGH, MitchellA, et al. (2012) Chromosomal duplication is a transient evolutionary solution to stress. Proc Natl Acad Sci U S A 109 : 21010–21015.
20. SionovE, ChangYC, Kwon-ChungKJ (2013) Azole Heteroresistance in Cryptococcus neoformans: Emergence of Resistant Clones with Chromosomal Disomy in the Mouse Brain during Fluconazole Treatment. Antimicrob Agents Chemother 57(10): 5127–30.
21. PavelkaN, RancatiG, ZhuJ, BradfordWD, SarafA, et al. (2010) Aneuploidy confers quantitative proteome changes and phenotypic variation in budding yeast. Nature 468 : 321–325.
22. SelmeckiA, ForcheA, BermanJ (2010) Genomic plasticity of the human fungal pathogen Candida albicans. Eukaryot Cell 9 : 991–1008.
23. Singh-BabakSD, BabakT, DiezmannS, HillJA, XieJL, et al. (2012) Global analysis of the evolution and mechanism of echinocandin resistance in Candida glabrata. PLoS Pathog 8: e1002718.
24. CowenLE, AndersonJB, KohnLM (2002) Evolution of drug resistance in Candida albicans. Annu Rev Microbiol 56 : 139–165.
25. MageeBB, HubeB, WrightRJ, SullivanPJ, MageePT (1993) The genes encoding the secreted aspartyl proteinases of Candida albicans constitute a family with at least three members. Infect Immun 61 : 3240–3243.
26. HubeB, StehrF, BossenzM, MazurA, KretschmarM, et al. (2000) Secreted lipases of Candida albicans: cloning, characterisation and expression analysis of a new gene family with at least ten members. Arch Microbiol 174 : 362–374.
27. HoyerLL (2001) The ALS gene family of Candida albicans. Trends Microbiol 9 : 176–180.
28. JacksonAP, GambleJA, YeomansT, MoranGP, SaundersD, et al. (2009) Comparative genomics of the fungal pathogens Candida dubliniensis and Candida albicans. Genome Res 19 : 2231–2244.
29. ButlerG, RasmussenMD, LinMF, SantosMA, SakthikumarS, et al. (2009) Evolution of pathogenicity and sexual reproduction in eight Candida genomes. Nature 459 : 657–662.
30. van het HoogM, RastTJ, MartchenkoM, GrindleS, DignardD, et al. (2007) Assembly of the Candida albicans genome into sixteen supercontigs aligned on the eight chromosomes. Genome Biol 8: R52.
31. ZhangA, PetrovKO, HyunER, LiuZ, GerberSA, et al. (2012) The Tlo proteins are stoichiometric components of Candida albicans mediator anchored via the Med3 subunit. Eukaryot Cell 11 : 874–884.
32. MondouxMA, ZakianVA (2007) Subtelomeric elements influence but do not determine silencing levels at Saccharomyces cerevisiae telomeres. Genetics 177 : 2541–2546.
33. GottschlingDE, AparicioOM, BillingtonBL, ZakianVA (1990) Position effect at S. cerevisiae telomeres: reversible repression of Pol II transcription. Cell 63 : 751–762.
34. BlackburnEH (2001) Switching and signaling at the telomere. Cell 106 : 661–673.
35. OppikoferM, KuengS, GasserSM (2013) SIR-nucleosome interactions: Structure-function relationships in yeast silent chromatin. Gene 527(1): 10–25.
36. DohenyJG, MottusR, GrigliattiTA (2008) Telomeric position effect–a third silencing mechanism in eukaryotes. PLoS One 3: e3864.
37. GreissS, GartnerA (2009) Sirtuin/Sir2 phylogeny, evolutionary considerations and structural conservation. Mol Cells 28 : 407–415.
38. BelenkyP, RacetteFG, BoganKL, McClureJM, SmithJS, et al. (2007) Nicotinamide riboside promotes Sir2 silencing and extends lifespan via Nrk and Urh1/Pnp1/Meu1 pathways to NAD+. Cell 129 : 473–484.
39. ChoiJK, HwangS, KimYJ (2008) Stochastic and regulatory role of chromatin silencing in genomic response to environmental changes. PLoS One 3: e3002.
40. WeinbergerL, VoichekY, TiroshI, HornungG, AmitI, et al. (2012) Expression noise and acetylation profiles distinguish HDAC functions. Mol Cell 47 : 193–202.
41. TiroshI, WeinbergerA, CarmiM, BarkaiN (2006) A genetic signature of interspecies variations in gene expression. Nat Genet 38 : 830–834.
42. ChenM, LiconK, OtsukaR, PillusL, IdekerT (2013) Decoupling epigenetic and genetic effects through systematic analysis of gene position. Cell Rep 3 : 128–137.
43. Perez-MartinJ, UriaJA, JohnsonAD (1999) Phenotypic switching in Candida albicans is controlled by a SIR2 gene. EMBO J 18 : 2580–2592.
44. StevensonJS, LiuH (2011) Regulation of white and opaque cell-type formation in Candida albicans by Rtt109 and Hst3. Mol Microbiol 81 : 1078–1091.
45. HniszD, SchwarzmullerT, KuchlerK (2009) Transcriptional loops meet chromatin: a dual-layer network controls white-opaque switching in Candida albicans. Mol Microbiol 74 : 1–15.
46. HniszD, BardetAF, NobileCJ, PetryshynA, GlaserW, et al. (2012) A histone deacetylase adjusts transcription kinetics at coding sequences during Candida albicans morphogenesis. PLoS Genet 8: e1003118.
47. CormackBP, GhoriN, FalkowS (1999) An adhesin of the yeast pathogen Candida glabrata mediating adherence to human epithelial cells. Science 285 : 578–582.
48. HalliwellSC, SmithMC, MustonP, HollandSL, AverySV (2012) Heterogeneous expression of the virulence-related adhesin Epa1 between individual cells and strains of the pathogen Candida glabrata. Eukaryot Cell 11 : 141–150.
49. RosinD, HornungG, TiroshI, GispanA, BarkaiN (2012) Promoter nucleosome organization shapes the evolution of gene expression. PLoS Genet 8: e1002579.
50. BrunoVM, WangZ, MarjaniSL, EuskirchenGM, MartinJ, et al. (2010) Comprehensive annotation of the transcriptome of the human fungal pathogen Candida albicans using RNA-seq. Genome Res 20 : 1451–1458.
51. AndersonMZ, BallerJA, DulmageK, WigenL, BermanJ (2012) The three clades of the telomere-associated TLO gene family of Candida albicans have different splicing, localization, and expression features. Eukaryot Cell 11 : 1268–1275.
52. PiccirilloS, WhiteMG, MurphyJC, LawDJ, HonigbergSM (2010) The Rim101p/PacC pathway and alkaline pH regulate pattern formation in yeast colonies. Genetics 184 : 707–716.
53. PurnapatreK, HonigbergSM (2002) Meiotic differentiation during colony maturation in Saccharomyces cerevisiae. Curr Genet 42 : 1–8.
54. FieldY, KaplanN, Fondufe-MittendorfY, MooreIK, SharonE, et al. (2008) Distinct modes of regulation by chromatin encoded through nucleosome positioning signals. PLoS Comput Biol 4: e1000216.
55. ZauggJB, LuscombeNM (2012) A genomic model of condition-specific nucleosome behavior explains transcriptional activity in yeast. Genome Res 22 : 84–94.
56. TanRZ, van OudenaardenA (2010) Transcript counting in single cells reveals dynamics of rDNA transcription. Mol Syst Biol 6 : 358.
57. KaeberleinM, McVeyM, GuarenteL (1999) The SIR2/3/4 complex and SIR2 alone promote longevity in Saccharomyces cerevisiae by two different mechanisms. Genes Dev 13 : 2570–2580.
58. HalmeA, BumgarnerS, StylesC, FinkGR (2004) Genetic and epigenetic regulation of the FLO gene family generates cell-surface variation in yeast. Cell 116 : 405–415.
59. LiX, ZhaoX, FangY, JiangX, DuongT, et al. (1998) Generation of destabilized green fluorescent protein as a transcription reporter. J Biol Chem 273 : 34970–34975.
60. KaiserB, MunderT, SaluzHP, KunkelW, EckR (1999) Identification of a gene encoding the pyruvate decarboxylase gene regulator CaPdc2p from Candida albicans. Yeast 15 : 585–591.
61. InigoS, GiraldezAN, ChoryJ, CerdanPD (2012) Proteasome-mediated turnover of Arabidopsis MED25 is coupled to the activation of FLOWERING LOCUS T transcription. Plant Physiol 160 : 1662–1673.
62. MolinariE, GilmanM, NatesanS (1999) Proteasome-mediated degradation of transcriptional activators correlates with activation domain potency in vivo. EMBO J 18 : 6439–6447.
63. VerstrepenKJ, FinkGR (2009) Genetic and epigenetic mechanisms underlying cell-surface variability in protozoa and fungi. Annu Rev Genet 43 : 1–24.
64. LehnerB (2010) Conflict between noise and plasticity in yeast. PLoS Genet 6: e1001185.
65. CareyLB, van DijkD, SlootPM, KaandorpJA, SegalE (2013) Promoter sequence determines the relationship between expression level and noise. PLoS Biol 11: e1001528.
66. Freeman-CookLL, ShermanJM, BrachmannCB, AllshireRC, BoekeJD, et al. (1999) The Schizosaccharomyces pombe hst4(+) gene is a SIR2 homologue with silencing and centromeric functions. Mol Biol Cell 10 : 3171–3186.
67. Freitas-JuniorLH, Hernandez-RivasR, RalphSA, Montiel-CondadoD, Ruvalcaba-SalazarOK, et al. (2005) Telomeric heterochromatin propagation and histone acetylation control mutually exclusive expression of antigenic variation genes in malaria parasites. Cell 121 : 25–36.
68. PirrottaV, GrossDS (2005) Epigenetic silencing mechanisms in budding yeast and fruit fly: different paths, same destinations. Mol Cell 18 : 395–398.
69. KitadaT, KuryanBG, TranNN, SongC, XueY, et al. (2012) Mechanism for epigenetic variegation of gene expression at yeast telomeric heterochromatin. Genes Dev 26 : 2443–2455.
70. RossmannMP, LuoW, TsaponinaO, ChabesA, StillmanB (2011) A common telomeric gene silencing assay is affected by nucleotide metabolism. Mol Cell 42 : 127–136.
71. ZhuX, ZhangY, BjornsdottirG, LiuZ, QuanA, et al. (2011) Histone modifications influence mediator interactions with chromatin. Nucleic Acids Res 39 : 8342–8354.
72. PengJ, ZhouJQ (2012) The tail-module of yeast Mediator complex is required for telomere heterochromatin maintenance. Nucleic Acids Res 40 : 581–593.
73. BurrackLS, ApplenSE, BermanJ (2011) The requirement for the Dam1 complex is dependent upon the number of kinetochore proteins and microtubules. Curr Biol 21 : 889–896.
74. Gerami-NejadM, BermanJ, GaleCA (2001) Cassettes for PCR-mediated construction of green, yellow, and cyan fluorescent protein fusions in Candida albicans. Yeast 18 : 859–864.
75. Gerami-NejadM, ForcheA, McClellanM, BermanJ (2012) Analysis of protein function in clinical C. albicans isolates. Yeast 29 : 303–309.
76. GreenbaumD, ColangeloC, WilliamsK, GersteinM (2003) Comparing protein abundance and mRNA expression levels on a genomic scale. Genome Biol 4 : 117.
77. R Development Core Team (2010) R: A language and environment for statistical computing. Vienna, Austria: R Foundation for Statistical Computing.
78. SudberyPE (2001) The germ tubes of Candida albicans hyphae and pseudohyphae show different patterns of septin ring localization. Mol Microbiol 41 : 19–31.
Štítky
Genetika Reprodukční medicínaČlánek vyšel v časopise
PLOS Genetics
2014 Číslo 7
Nejčtenější v tomto čísle
- Wnt Signaling Interacts with Bmp and Edn1 to Regulate Dorsal-Ventral Patterning and Growth of the Craniofacial Skeleton
- Novel Approach Identifies SNPs in and with Evidence for Parent-of-Origin Effect on Body Mass Index
- Hypoxia Adaptations in the Grey Wolf () from Qinghai-Tibet Plateau
- DNA Topoisomerase 1α Promotes Transcriptional Silencing of Transposable Elements through DNA Methylation and Histone Lysine 9 Dimethylation in