
Risk Stratification by Self-Measured Home Blood Pressure across Categories of Conventional Blood Pressure: A Participant-Level Meta-Analysis
Background:
The Global Burden of Diseases Study 2010 reported that hypertension is worldwide the leading risk factor for cardiovascular disease, causing 9.4 million deaths annually. We examined to what extent self-measurement of home blood pressure (HBP) refines risk stratification across increasing categories of conventional blood pressure (CBP).
Methods and Findings:
This meta-analysis included 5,008 individuals randomly recruited from five populations (56.6% women; mean age, 57.1 y). All were not treated with antihypertensive drugs. In multivariable analyses, hazard ratios (HRs) associated with 10-mm Hg increases in systolic HBP were computed across CBP categories, using the following systolic/diastolic CBP thresholds (in mm Hg): optimal, <120/<80; normal, 120–129/80–84; high-normal, 130–139/85–89; mild hypertension, 140–159/90–99; and severe hypertension, ≥160/≥100.
Over 8.
3 y, 522 participants died, and 414, 225, and 194 had cardiovascular, cardiac, and cerebrovascular events, respectively. In participants with optimal or normal CBP, HRs for a composite cardiovascular end point associated with a 10-mm Hg higher systolic HBP were 1.28 (1.01–1.62) and 1.22 (1.00–1.49), respectively. At high-normal CBP and in mild hypertension, the HRs were 1.24 (1.03–1.49) and 1.20 (1.06–1.37), respectively, for all cardiovascular events and 1.33 (1.07–1.65) and 1.30 (1.09–1.56), respectively, for stroke. In severe hypertension, the HRs were not significant (p≥0.20). Among people with optimal, normal, and high-normal CBP, 67 (5.0%), 187 (18.4%), and 315 (30.3%), respectively, had masked hypertension (HBP≥130 mm Hg systolic or ≥85 mm Hg diastolic). Compared to true optimal CBP, masked hypertension was associated with a 2.3-fold (1.5–3.5) higher cardiovascular risk. A limitation was few data from low - and middle-income countries.
Conclusions:
HBP substantially refines risk stratification at CBP levels assumed to carry no or only mildly increased risk, in particular in the presence of masked hypertension. Randomized trials could help determine the best use of CBP vs. HBP in guiding BP management. Our study identified a novel indication for HBP, which, in view of its low cost and the increased availability of electronic communication, might be globally applicable, even in remote areas or in low-resource settings.
Please see later in the article for the Editors' Summary
Published in the journal:
. PLoS Med 11(1): e32767. doi:10.1371/journal.pmed.1001591
Category:
Research Article
doi:
https://doi.org/10.1371/journal.pmed.1001591
Summary
Background:
The Global Burden of Diseases Study 2010 reported that hypertension is worldwide the leading risk factor for cardiovascular disease, causing 9.4 million deaths annually. We examined to what extent self-measurement of home blood pressure (HBP) refines risk stratification across increasing categories of conventional blood pressure (CBP).
Methods and Findings:
This meta-analysis included 5,008 individuals randomly recruited from five populations (56.6% women; mean age, 57.1 y). All were not treated with antihypertensive drugs. In multivariable analyses, hazard ratios (HRs) associated with 10-mm Hg increases in systolic HBP were computed across CBP categories, using the following systolic/diastolic CBP thresholds (in mm Hg): optimal, <120/<80; normal, 120–129/80–84; high-normal, 130–139/85–89; mild hypertension, 140–159/90–99; and severe hypertension, ≥160/≥100.
Over 8.
3 y, 522 participants died, and 414, 225, and 194 had cardiovascular, cardiac, and cerebrovascular events, respectively. In participants with optimal or normal CBP, HRs for a composite cardiovascular end point associated with a 10-mm Hg higher systolic HBP were 1.28 (1.01–1.62) and 1.22 (1.00–1.49), respectively. At high-normal CBP and in mild hypertension, the HRs were 1.24 (1.03–1.49) and 1.20 (1.06–1.37), respectively, for all cardiovascular events and 1.33 (1.07–1.65) and 1.30 (1.09–1.56), respectively, for stroke. In severe hypertension, the HRs were not significant (p≥0.20). Among people with optimal, normal, and high-normal CBP, 67 (5.0%), 187 (18.4%), and 315 (30.3%), respectively, had masked hypertension (HBP≥130 mm Hg systolic or ≥85 mm Hg diastolic). Compared to true optimal CBP, masked hypertension was associated with a 2.3-fold (1.5–3.5) higher cardiovascular risk. A limitation was few data from low - and middle-income countries.
Conclusions:
HBP substantially refines risk stratification at CBP levels assumed to carry no or only mildly increased risk, in particular in the presence of masked hypertension. Randomized trials could help determine the best use of CBP vs. HBP in guiding BP management. Our study identified a novel indication for HBP, which, in view of its low cost and the increased availability of electronic communication, might be globally applicable, even in remote areas or in low-resource settings.
Please see later in the article for the Editors' Summary
Introduction
Current guidelines for the diagnosis and management of hypertension recommend risk stratification based on conventionally measured blood pressure, i.e., blood pressure measured in a medical environment [1],[2]. European guidelines [1] categorize blood pressure as optimal, normal, high normal, and grades 1 to 3 of hypertension; US guidelines [2] classify blood pressure as normal, prehypertension, and stages 1 and 2 of hypertension (Table 1). Blood pressure self-measured at home is a more accurate prognosticator than conventionally measured blood pressure, because of the greater number of readings and the avoidance of the white-coat effect, as well as avoidance of measurement error through use of automated blood pressure monitors [3],[4]. Affordable and validated automated monitors for blood pressure self-measurement are readily available.

The Global Burden of Diseases Study 2010 reported that high blood pressure is the leading risk factor for global disease burden, and is estimated to cause 9.4 million deaths every year—more than half of the estimated 17 million deaths a year caused by total cardiovascular disease [5]. To succeed in reducing the burden of hypertension [5],[6], efforts should be targeted where they are needed most [7]. In line with this statement [7], we examined to what extent blood pressure self-monitoring succeeds in refining risk stratification within established categories of conventional blood pressure (CBP), in particular at levels assumed to be associated with no or only mildly increased risk [1],[2]. We addressed the issue in an individual-participant meta-analysis of 5,008 people not being treated for hypertension randomly recruited from five populations and enrolled in the International Database of Home Blood Pressure in Relation to Cardiovascular Outcome (IDHOCO) [8],[9].
Methods
Ethics Statement
All studies included in IDHOCO received ethical approval. They have been described in detail in peer-reviewed publications. All participants gave informed written consent.
Search Strategy and Study Inclusion Criteria
Figure 1 describes the selection of studies and participants based on electronic searches of the literature done in February 2012 before publication of the IDHOCO protocol [8] and repeated in July 2013. We searched the PubMed database, using as initial search terms (home blood pressure OR self-measured blood pressure) AND population AND (“1980/01/01”[Date - Publication] : “2012/02/28”[Date - Publication]), yielding 791 publications. We then limited the search as follows: NOT review[Publication Type] AND general population, resulting in 172 hits. Two authors (K. A. and T. J. N.) independently reviewed titles and abstracts. Studies were eligible for inclusion if they met the following criteria: (1) baseline information on conventional and self-measured blood pressure and cardiovascular risk factors was available; (2) the study was reported as an original research study in a peer-reviewed publication; (3) the study was published between 1 January 1980 and 28 February 2012; (4) the study involved a general population sample; and (5) the subsequent follow-up included both fatal and nonfatal outcomes. After eliminating duplicate population cohorts, the two authors (K. A. and T. J. N.) excluded 57 articles because no home blood pressure (HBP) was measured (n = 34), HBP was not self-measured (n = 4), the study included patients instead of a population sample (n = 7), or cardiovascular outcome was not collected (n = 12). J. A. S. and K. A. assessed nine studies in detail [10]–[18] and further eliminated three population cohorts, because no outcome data had been collected [10], only fatal outcomes had been recorded [14], or individual-participant data were unavailable [12].

Study Population
At the time of writing this report, IDHOCO included six eligible population cohorts [11],[13],[15]–[18] and 8,486 participants (Table 2). We discarded one cohort because data on cause-specific mortality were still being collected [18]. Of the remaining 6,753 participants, we excluded 1,745 because they were on antihypertensive drug treatment initiated before enrollment based on CBP measurement (n = 1,465), because fewer than two measurements of their CBP or HBP were on record (n = 270), or because information on current smoking or cardiovascular disease history was unavailable (n = 10). Thus, the number of participants analyzed totaled 5,008. Analyzed participants were 1,605 Finns representing a nationwide population sample (the Finn-Home study) [17]; 568 inhabitants of Didima, Greece [15]; 2,010 residents from Ohasama, Japan [11]; 469 inhabitants of the Tsurugaya district in Sendai, Japan [16]; and 356 participants living in Montevideo, Uruguay [13].

Data Collection
IDHOCO was constructed and maintained at the Studies Coordinating Centre in Leuven, Belgium, in accordance with Belgian legislation on the protection of privacy [8]. Investigators provided anonymous information on each participant in electronic format. After integration of the information into the overarching database, investigators received detailed summary statistics on their own cohort. This procedure ensured that the common database incorporated unbiased information without conflicts between the originally published reports [11],[13],[15]–[17] and results generated for individual studies as part of the current meta-analysis.
Blood Pressure Measurement
CBP was measured with a standard mercury sphygmomanometer (Mercuro 300 [17] or Baumomanometer [15]), an automatic auscultatory (Elquest USM-700F [11]), or a validated oscillometric monitor (Omron Form ABI/PWV [16] or Omron HEM-705CP [13]), using the appropriate cuff size, with the participant in the sitting or supine position. The CBP was the average of two consecutive readings obtained at an examination center. Next, we classified the CBP according to the generally accepted thresholds that are available in the European [1] and US [2] guidelines. Optimal blood pressure was a level below 120 mm Hg systolic and below 80 mm Hg diastolic. For normal and high-normal blood pressure and mild hypertension, systolic/diastolic levels encompassed 120–129/80–84 mm Hg, 130–139/85–89 mm Hg, and 140–159/90–99 mm Hg, respectively. Severe hypertension was a level of 160 mm Hg systolic or 100 mm Hg diastolic or higher. An additional category, prehypertension, combines participants with normal and high-normal blood pressure (120–139 mm Hg systolic or 80–89 mm Hg diastolic). When the systolic and diastolic blood pressures were in different categories, we assigned the participant to the higher category.
All participants measured their blood pressure at home after 2–5 min of rest in the sitting position with a validated oscillometric device (Omron HEM-722C [17], Omron HEM-705CP [15], Omron HEM-401C [11], Omron HEM-747 [16], or SpaceLabs 90207 [13]) using the appropriate cuff size. Each participant's HBP was the average of all available readings. Masked hypertension was a CBP of less than 140 mm Hg systolic and 90 mm Hg diastolic in the presence of a HBP of 130 mm Hg systolic or 85 mm Hg diastolic or higher [1],[9]. In sensitivity analyses, we also used 135 mm Hg as the systolic threshold for HBP to define masked hypertension [1],[2].
Other Measurements
Via questionnaires, we obtained information on each participant's medical history and smoking habits. Body mass index was body weight in kilograms divided by height in meters squared. Biochemical measurements included serum cholesterol and blood glucose. Information on serum total cholesterol level was not available for the Didima population and was, as in previous publications [8],[9], extrapolated from data provided by the ATTICA study investigators by sex and 10-y age strata. The ATTICA study population was a large population cohort examined in the same time period and in the same geographical area as the Didima cohort [19],[20]. Diabetes mellitus was defined as the use of antidiabetic drugs, a fasting blood glucose concentration of at least 7.0 mmol/l [21], a random blood glucose concentration of at least 11.1 mmol/l [21], a self-reported diagnosis, or diabetes documented in practice or hospital records.
Ascertainment of Events
We ascertained vital status and incidence of fatal and nonfatal diseases from the appropriate sources in each country, as described in detail in a previous publication [8]. Fatal and nonfatal stroke did not include transient ischemic attacks. Cardiac events comprised fatal and nonfatal myocardial infarction, death because of ischemic heart disease, sudden death, fatal and nonfatal heart failure, surgical and percutaneous coronary revascularization, pacemaker implantation, and other cardiac deaths. The composite cardiovascular end point included cardiovascular mortality, cerebrovascular, and cardiac end points. In all outcome analyses, we considered only the first occurrence per participant in each event category.
Statistical Analysis
For database management and statistical analysis, we used SAS software, version 9.3 (SAS Institute). We compared means and proportions using the standard normal z-test for large samples or ANOVA and the χ2 statistic, respectively. Statistical significance was α level less than 0.05 on two-sided tests. We plotted incidence rates by the five categories of CBP, while standardizing by the direct method for sex and age (<40, 40–59, and ≥60 y).
We used Cox proportional hazards models to compute hazard ratios (HRs), while adjusting for cohort as a random effect and for sex, age, body mass index, smoking, total cholesterol, and history of cardiovascular disease and diabetes mellitus as fixed effects. We checked the proportional hazards assumption and the functional forms of the covariables using the Kolmogorov-type supremum test, as implemented in the PROC PHREG procedure of the SAS package. In multivariable-adjusted Cox proportional hazards models, we explored whether, within each category of CBP, HBP analyzed as continuous variable refined risk stratification. We derived HRs that expressed the change in risk associated with increases in the systolic and diastolic HBP of 10 and 5 mm Hg, respectively. In sensitivity analyses, we computed the differences in the HRs between subgroups by introducing the appropriate interaction term in the Cox proportional hazards models. Finally, we computed multivariable-adjusted HRs comparing the risk of masked hypertension in participants with optimal, normal, or high-normal CBP with the risk incurred by participants with optimal CBP without masked hypertension. We tested heterogeneity in the HRs among the three subgroups with masked hypertension by testing an ordinal variable coding for these subgroups among participants with masked hypertension.
Results
Baseline Characteristics
Of 5,008 participants, 2,834 (56.6%) were female, 2,115 (42.2%) were 60 y or older, 1,148 (22.9%) were current smokers, 317 (6.3%) had diabetes mellitus, and 327 (6.5%) had a history of cardiovascular disease. Age averaged 57.1 y (standard deviation [SD], 13.6). Across all participants, CBP averaged 130.9 (SD, 19.7) mm Hg systolic and 77.9 (SD, 11.5) mm Hg diastolic. The corresponding means for HBP were 123.9 (SD, 17.2) mm Hg and 74.9 (SD, 9.8) mm Hg. The mean self-measured HBP was therefore 7.0 mm Hg (95% CI, 6.5–7.4; p<0.0001) and 3.0 mm Hg (95% CI, 2.8–3.3; p<0.0001) lower than mean CBP. Table 3 lists the baseline characteristics of the 5,008 participants by CBP category. All of the ANOVA and χ2 statistic p-values for differences across the five categories were significant (p≤0.015) except for the prevalence of smoking (p = 0.083).

Incidence of Events
Median follow-up was 8.3 y (5th to 95th percentile interval, 4.7 to 16.8) and ranged by study from 5.5 y (2.3 to 5.6) in Tsurugaya to 11.9 y (3.8 to 16.9) in Ohasama (Table 2). During 46,593 person-years of follow-up, 522 participants died (11.2 per 1,000 person-years), and 414 experienced a fatal or nonfatal cardiovascular event (9.1 per 1,000 person-years). Considering cause-specific first cardiovascular events, the incidence of stroke and cardiac events amounted to 225 (4.9 per 1,000 person-years) and 194 (4.2 per 1,000 person-years), respectively.
Risk Associated with Increasing Categories of Conventional Blood Pressure
Figure 2 displays the Kaplan-Meier survival function estimates. The log-rank test for difference across the categories of CBP was highly significant for all of the end points under study (p<0.0001). Similarly, incidence rates standardized by the direct method for sex and age (<40, 40–59, and ≥60 y) increased across the categories of CBP (Figure 3; p≤0.0009). The multivariable-adjusted HRs, expressing the risk compared with optimal blood pressure (Table 4), increased with higher categories of CBP for total mortality (p = 0.011) as well as for fatal combined with nonfatal outcomes (p≤0.0004).


Risk Associated with Home Blood Pressure by Category of Conventional Blood Pressure
Among participants with an optimal CBP, the multivariable-adjusted HRs associated with a 10-mm Hg increment in home systolic blood pressure were 1.21 (95% CI, 1.00–1.46) and 1.28 (95% CI, 1.01–1.62) for total mortality and cardiovascular events. The corresponding HRs among participants with normal CBP were 1.18 (95% CI, 0.99–1.40) and 1.22 (95% CI, 1.00–1.49), respectively. The home systolic blood pressure also predicted the composite cardiovascular end point and stroke (Table 5) in participants with high-normal blood pressure, prehypertension, and mild hypertension. For these categories, the HRs for the composite cardiovascular end point were 1.24 (95% CI, 1.03–1.49), 1.24 (95% CI, 1.09–1.41), and 1.20 (95% CI, 1.06–1.37), respectively, and for stroke were 1.33 (95% CI, 1.07–1.65), 1.27 (95% CI, 1.08–1.50), and 1.30 (95% CI, 1.09–1.56), respectively. However, in participants with severe hypertension, the HBP did not significantly add to the prediction of any end point under study (p≥0.20). The home diastolic blood pressure was a weak and inconsistent predictor across the categories of CBP (Table 6).


Excluding one cohort at a time or stratifying participants by sex, ethnicity, or age (<60 versus ≥60 y) confirmed the main analyses of home systolic blood pressure, as reported in Tables 7 and 8.


Characteristics of Participants with Masked Hypertension
Participants with masked hypertension according to the 130/85-mm Hg threshold, compared with participants with true optimal, normal, or high-normal blood pressure (Table 9), were more likely to be male (51.0% versus 38.7%; p<0.0001), to smoke (28.1% versus 23.2%; p = 0.012), to have diabetes mellitus (10.5% versus 4.9%; p<0.0001) or a history of cardiovascular disease (8.3% versus 5.2%; p = 0.0038), and to be older (62.9 versus 53.2 y; p<0.0001) and more obese (26.0 versus 24.3 kg/m2; p<0.0001).

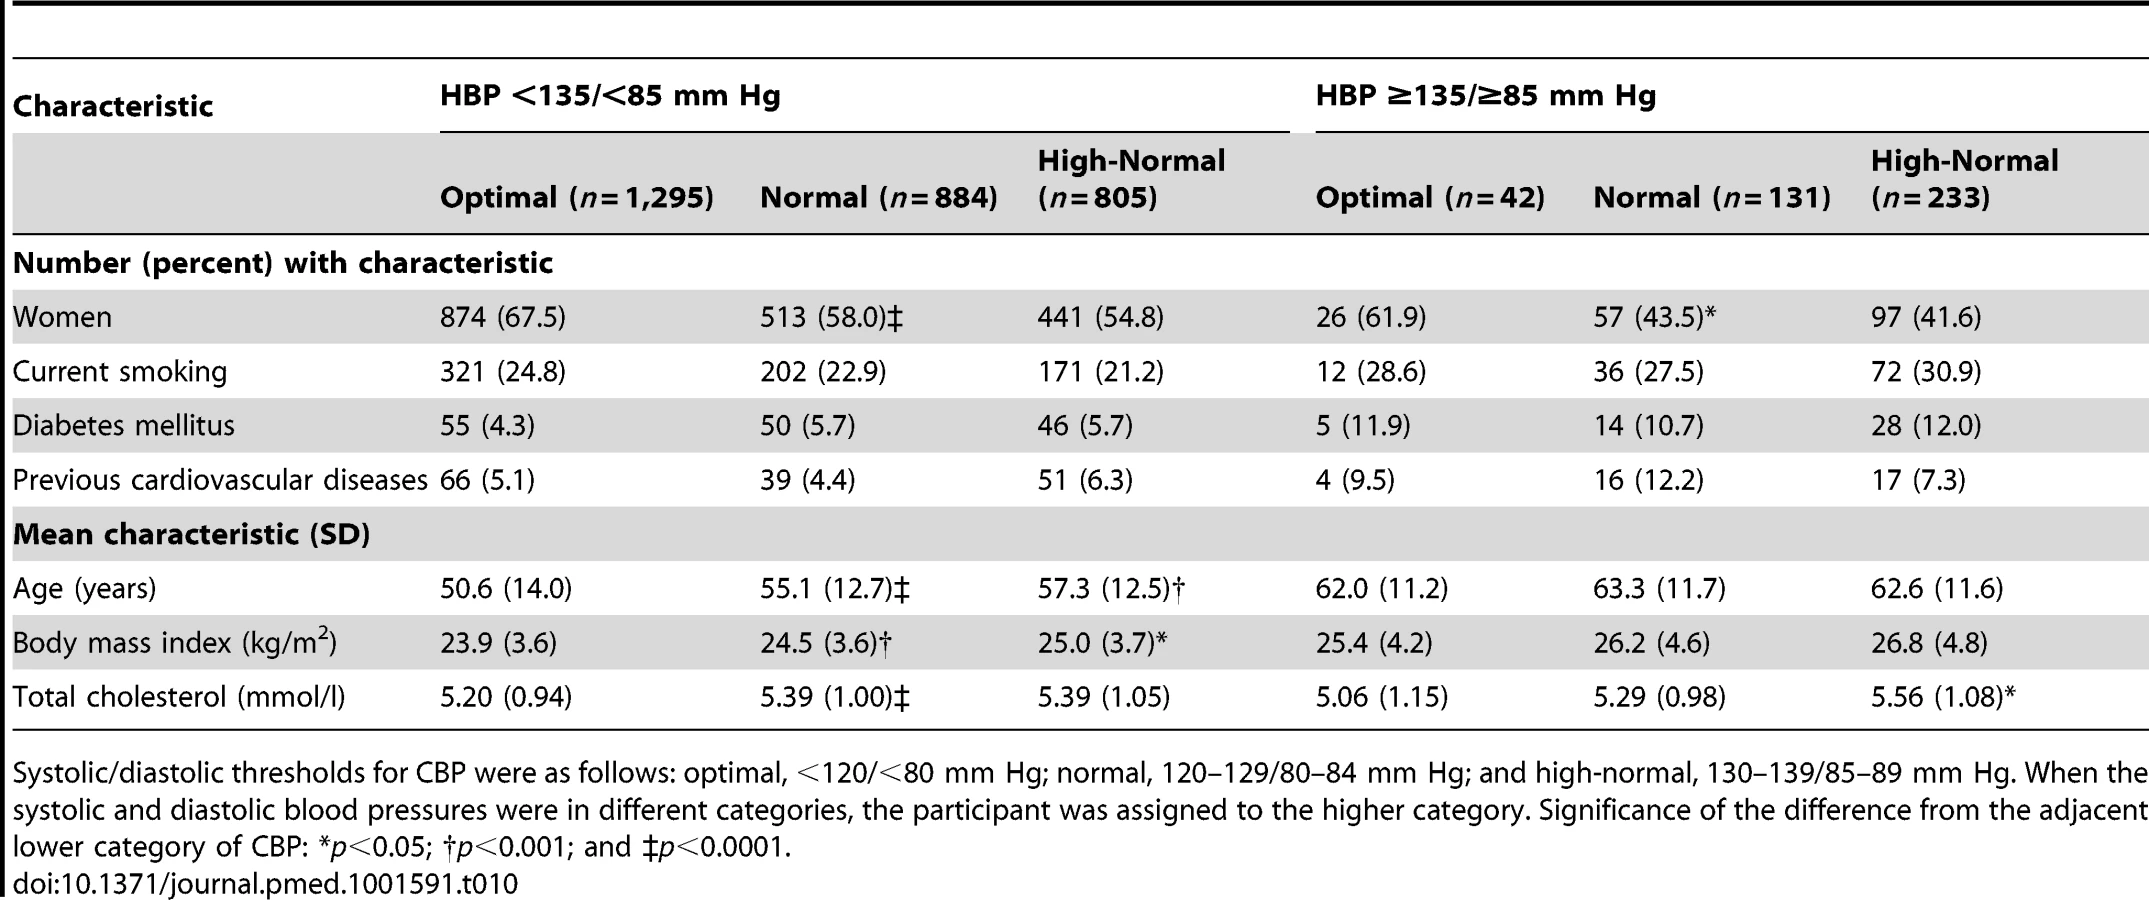
Participants with masked hypertension according to the 135/85-mm Hg threshold, compared with participants with true optimal, normal, or high-normal blood pressure (Table 10), were more likely to be male (55.7% versus 38.7%; p<0.0001), to smoke (29.6% versus 23.3%; p = 0.0053), to have diabetes mellitus (11.6% versus 5.1%; p<0.0001) or a history of cardiovascular disease (9.1% versus 5.2%; p = 0.0015), and to be older (62.8 versus 53.7 y; p<0.0001) and more obese (26.5 versus 24.4 kg/m2; p<0.0001).
Risk Conferred by Masked Hypertension
Using 130/85 mm Hg as threshold for HBP to define masked hypertension (Figure 4; Table 9), the number of participants with masked hypertension amounted to 67 (5.0%), 187 (18.4%), and 315 (30.3%) among participants with optimal, normal, and high-normal blood pressure, respectively. In these three categories of participants with masked hypertension, with optimal blood pressure without masked hypertension as reference, the multivariable-adjusted HRs for total mortality were 2.21 (95% CI, 1.27–3.85), 1.57 (95% CI, 1.02–2.41), and 1.54 (95% CI, 1.07–2.23), respectively. The corresponding HRs for the composite cardiovascular end point were 2.65 (95% CI, 1.30–5.34), 2.25 (95% CI, 1.33–3.80), and 2.24 (95% CI, 1.41–3.53), respectively.

Using 135/85 mm Hg as the HBP threshold to define masked hypertension (Figure 5; Table 10), the number of participants with masked hypertension amounted to 42 (3.1%), 131 (12.9%), and 233 (22.4%) among participants with optimal, normal, and high-normal blood pressure, respectively. In these three categories of participants with masked hypertension, with optimal blood pressure without masked hypertension as reference, the multivariable-adjusted HRs for total mortality were 1.91 (95% CI, 0.98–3.74), 1.66 (95% CI, 1.04–2.63), and 1.47 (95% CI, 0.98–2.22), respectively. The corresponding HRs for the composite cardiovascular end point were 2.14 (95% CI, 0.89–5.15), 1.96 (95% CI, 1.09–3.52), and 1.87 (95% CI, 1.13–3.09), respectively.

Discussion
Current guidelines for the diagnosis and management of hypertension [1],[2] stratify risk and treatment decisions based on defined categories of CBP (Table 1), as measured in a medical environment. Self-measured HBP or ambulatory blood pressure is a more accurate prognosticator than CBP. Expert committees therefore recommend the use of out-of-the-office blood pressure measurement to confirm the diagnosis of hypertension and assess treatment effects [1],[2]. The key finding of our current study is that HBP substantially refines risk stratification at levels of CBP that are presumably associated with no or only mildly elevated risk. In contrast, in severe hypertension, self-measured HBP did not improve the prediction of death or cardiovascular complications.
To the best of our knowledge, only one previous prospective study addressed risk stratification by out-of-the-office blood pressure measurement in prehypertensive patients, but applied ambulatory monitoring instead of self-measurement. Pierdomenico and coworkers [22] followed the incidence of cardiovascular events in prehypertensive participants with (n = 120) or without (n = 471) masked hypertension. The participants were hospital staff, patients referred for reasons other than cardiovascular disease or hypertension, and volunteers. During 6.6 y of follow-up, 29 fatal and nonfatal cardiovascular events occurred. In prehypertensive patients without and with masked hypertension, the event rates per 100 patient-years were 0.57 and 1.51, respectively. With adjustments applied for covariables, including CBP, cardiovascular risk was significantly higher in masked hypertensive patients than in true prehypertension (masked versus true prehypertension without elevated ambulatory blood pressure, relative risk 2.65; 95% CI, 1.18–5.98; p = 0.018).
According to the European Society of Hypertension guidelines [1], masked hypertension is a clinic blood pressure below 140 mm Hg systolic and 90 mm Hg diastolic in the presence of a daytime or self-measured blood pressure of at least 130 mm Hg or 135 mm Hg systolic or 85 mm Hg diastolic. The prevalence of masked hypertension in our current study was 8.4%, which is of the same order of magnitude as in other individual-participant meta-analyses of population samples [23],[24]. If one accounts for differences in the technique of out-of-the-office blood pressure measurement, treatment status, and applied thresholds, masked hypertension carries a risk that approaches that of sustained hypertension [23],[24]. In keeping with our current findings (Tables 9 and 10), the Finn-Home study investigators demonstrated that high-normal systolic and diastolic office blood pressure, older age, greater body mass index, current smoking, and diabetes were independent determinants of masked hypertension [25]. Similarly, Franklin and coworkers [24] reported that among people not being treated for hypertension, the prevalence of masked hypertension, using a daytime ambulatory threshold of 135/85 mm Hg, was higher in diabetic than nondiabetic participants (18.1% versus 13.8%; p = 0.032).
Our current findings have important implications for clinical practice. The relation between cardiovascular complications and blood pressure is continuous at least down to a CBP level of 115 mm Hg systolic or 75 mm Hg diastolic [26]. The continuous nature of the relation with blood pressure holds true not only in hypertensive patients, but in normotensive people as well, so that, for instance, of all strokes, three-fourths occur in individuals with normal CBP and only one-fourth in patients with hypertension as determined by CBP [26]. In our current analysis, we demonstrated that HBP monitoring substantially refines risk stratification in normotensive people not being treated for hypertension with optimal, normal, or high-normal CBP, in particular in the presence of masked hypertension. Consequently, we suggest that in individuals at risk for masked hypertension, HBP monitoring should be included in the strategy of primary prevention of cardiovascular complications. Risk factors that identify people who would qualify for HBP monitoring are above optimal levels of CBP, older age, obesity, smoking, and diabetes mellitus [24],[25]. HBP monitoring should also be carried out in people with a normal CBP but with unexplained signs of hypertensive target organ damage.
Using HBP measurement to screen for masked hypertension is probably cost-effective. Fukunaga and coworkers studied the cost-effectiveness of HBP measurement from the perspective of the Japanese health care system, using simulations based on the Ohasama population study [27]. Depending on the model applied, estimates of the cost savings produced by applying HBP measurement ranged from US$674,000 to US$2.51 million per 5,000 person-years. Two trials of adjusting treatment based on out-of-the-office blood pressure measurement [28],[29] also reported cost savings compared to conventional sphygmomanometry, by using either ambulatory monitoring [28] or self-measurement [29] of blood pressure.
Our individual-participant meta-analysis is clearly an advance over previous publications in the research field of risk stratification based on blood pressure. To our knowledge, our study is the first to assess the risk associated with self-measured HBP across increasing categories of CBP. It raises the issue that the economic analysis of HBP monitoring should be based on cost-savings not only via the avoidance of unnecessary treatment [27]–[29], but foremost via the addition of quality and years to life in those at high cardiovascular risk even though CBP is normal. Other strong points are the relatively large sample size representing populations from Europe, Asia, and South America, and the removal of participants being treated for hypertension from the analysis. Our meta-analysis is also an advance over the contributing individual studies, because none of them had enough power to address the research question that we set out to answer or to run sensitivity analyses stratified by anthropometric characteristics or cardiovascular risk factors. Furthermore, meta-analyses based on individual participant data, compared with meta-analyses of summary statistics, have unique advantages, including the possibility of computing survival curves and the ability to check whether the Cox proportional hazards assumption is fulfilled [30],[31]. Finally, we analyzed both fatal and nonfatal outcomes. The introduction of stroke units to hospitals and the increasing availability of invasive coronary care and thrombolysis over the past decades has reduced the case fatality rate of most cardiovascular complications of hypertension. Not accounting for nonfatal events therefore seriously limits generalizability [32].
On the other hand, our study also has some potential limitations. First, we did not determine the reproducibility of masked hypertension in the context of our current study. However, Viera and colleagues reported prevalence rates of masked hypertension among patients not being treated with hypertension but with borderline elevated CBP to be 54% and 53% on first and repeat assessment, with an agreement of 73% [33]. Among patients who underwent repeated ambulatory monitoring for a medical indication, Ben-Dov and coworkers reported an agreement of 72% in the classification of masked hypertension [34]. Second, CBP values in our study were the average of only two readings obtained at a single examination, which can lead to an overestimation of CBP because of the white-coat effect. However, overestimation of CBP would weaken rather than strengthen our current findings. Moreover, our findings were consistent using a tight (130 mm Hg) and less stringent (135 mm Hg) systolic threshold to define masked hypertension. Third, IDHOCO has no information on treatment status during follow-up. However, antihypertensive treatment instituted during follow-up likely would have been instituted according to current guidelines and based on CBP. Even if treatment had been started during follow-up based on HBP, if anything this would have weakened associations between outcomes and HBP (including masked hypertension). Fourth, few data were available from low - and middle-income countries. Finally, methods of blood pressure measurement and ascertainment of events were not identical among cohorts. However, we accounted for cohort as a random effect in the Cox proportional hazards models, and our findings remained consistent when we excluded one cohort at a time.
In conclusion, HBP monitoring substantially refines risk stratification in people with levels of CBP assumed to carry no or only mildly elevated risk, in particular in the presence of masked hypertension. Properly designed randomized clinical trials are required to determine whether identification and treatment of masked hypertension versus the current standard of care, i.e., not to perform HBP measurement and not to treat people with normal blood pressure on conventional measurement, leads to a reduction of cardiovascular complications and is cost-effective. Such trials might be mounted worldwide in developed and developing countries, including remote areas and even in low-resource settings [35].
Supporting Information
Zdroje
1. ManciaG, De BackerG, DominiczakA, CifkovaR, FagardR, et al. (2007) 2007 guidelines for the management of arterial hypertension: The Task Force for the Management of Arterial Hypertension of the European Society of Hypertension (ESH) and of the European Society of Cardiology (ESC). Eur Heart J 28 : 1462–1536.
2. ChobanianAV, BakrisGL, BlackHR, CushmanWC, GreenLA, et al. (2003) Seventh report of the Joint National Committee on Prevention, Detection, Evaluation, and Treatment of High Blood Pressure. Hypertension 42 : 1206–1252.
3. StaessenJA, ThijsL, OhkuboT, KikuyaM, RichartT, et al. (2008) Thirty years of research on diagnostic and therapeutic thresholds for the self-measured blood pressure at home. Blood Press Monit 13 : 352–365.
4. PickeringTG, Houston MillerN, OgedegbeG, KrakoffLR, ArtinianNT, et al. (2008) Call to action on use and reimbursement for home blood pressure monitoring. A joint scientific statement from the American Heart Association, American Society of Hypertension, and Preventive Cardiovascular Nurses Association. Hypertension 52 : 10–29.
5. LopezAD, MathersCD, EzzatiM, JamisonDT, MurrayCJL (2006) Global and regional burden of disease and risk factors, 2001: systematic analysis of population health data. Lancet 367 : 1747–1757.
6. KearneyPM, WheltonM, ReynoldsK, MuntnerP, WheltonPK, et al. (2005) Global burden of hypertension: analysis of worldwide data. Lancet 365 : 217–223.
7. The Lancet (2013) Raising the pressure on hypertension. Lancet 381 : 1157.
8. NiiranenTJ, ThijsL, AsayamaK, JohanssonJK, OhkuboT, et al. (2012) The International Database of HOme blood pressure in relation to Cardiovascular Outcome (IDHOCO): moving from baseline characteristics to research perspectives. Hypertens Res 35 : 1072–1079.
9. NiiranenTJ, AsayamaK, ThijsL, JohanssonJK, OhkuboT, et al. (2013) Outcome-driven thresholds for home blood pressure measurement: International Database for HOme blood pressure in relation to Cardiovascular Outcome. Hypertension 61 : 27–34.
10. JuliusS, JamersonK, MejiaA, KrauseL, SchorkN, et al. (1990) The association of borderline hypertension with target organ changes and higher coronary risk: Tecumseh Blood Pressure study. JAMA 264 : 354–358.
11. OhkuboT, ImaiY, TsujiI, NagaiK, KatoJ, et al. (1998) Home blood pressure measurement has a stronger predictive power for mortality than does screening blood pressure measurement: a population-based observation in Ohasama, Japan. J Hypertens 16 : 971–975.
12. OkumiyaK, MatsubayashiK, WadaT, FujisawaA, OsakiY, et al. (1999) A U-shaped association between home systolic blood pressure and four-year mortality in community-dwelling older men. J Am Geriatr Soc 47 : 1415–1421.
13. SchettiniC, BianchiM, NietoF, SandoyaE, SenraH (1999) Ambulatory blood pressure. Normality and comparison with other measurements. Hypertension 34 : 818–825.
14. SegaR, FacchettiR, BombelliM, CesanaG, CorraoG, et al. (2005) Prognostic value of ambulatory and home blood pressures compared with office blood pressure in the general population. Follow-up results from the Pressioni Arteriose Monitorate e Loro Associazione (PAMELA) Study. Circulation 111 : 1777–1783.
15. StergiouGS, BaibasNM, KalogeropoulosPG (2007) Cardiovascular risk prediction on home blood pressure measurement: the Didima study. J Hypertens 25 : 1590–1596.
16. NiuK, HozawaA, AwataS, GuoH, KuriyamaS, et al. (2008) Home blood pressure is associated with depressive symptoms in an elderly population aged 70 years and over: a population-based, cross-sectional analysis. Hypertens Res 31 : 409–416.
17. NiiranenTJ, HänninenMR, JohanssonJ, ReunanenA, JulaAM (2010) Home-measured blood pressure is a stronger predictor of cardiovascular risk than office blood pressure. Hypertension 55 : 1346–1351.
18. CacciolatiC, TzourioC, DufouilC, AlperovitchA, HanonO (2012) Feasibility of home blood pressure measurement in elderly individuals: cross-sectional analysis of a population-based sample. Am J Hypertens 25 : 1279–1285.
19. PitsavosC, PanagiotakosDB, ChrysohoouC, StefanadisC (2003) Epidemiology of cardiovascular risk factors in Greece: aims, design and baseline characteristics of the ATTICA study. BMC Public Health 3 : 32 doi:10.1186/1471-2458-3-32
20. PanagiotakosDB, PitsavosC, LentzasY, ChrysohoouC, StefanadisC (2007) Five-year incidence of hypertension and its determinants: the ATTICA study. J Hum Hypertens 21 : 686–688.
21. American Diabetes Association (2013) Standards of medical care in diabetes—2013. Diabetes Care 36 (Suppl 1) S1–S66.
22. PierdomenicoSD, PannaraleG, RabbiaF, LapennaD, LicitraR, et al. (2008) Prognostic relevance of masked hypertension in subjects with prehypertension. Am J Hypertens 21 : 879–883.
23. HansenTW, KikuyaM, ThijsL, Björklund-BodegårdK, KuznetsovaT, et al. (2007) Prognostic superiority of daytime ambulatory over conventional blood pressure in four populations: a meta-analysis of 7030 individuals. J Hypertens 25 : 1554–1564.
24. FranklinSS, ThijsL, LiY, HansenTW, BoggiaJ, et al. (2013) Masked hypertension in diabetes mellitus: treatment implications for clinical practice. Hypertension 61 : 964–971.
25. HänninenMRA, NiiranenTJ, PuukkaPJ, MattilaAK, JulaAM (2011) Determinants of masked hypertension in the general population: the Finn-Home study. J Hypertens 29 : 1880–1888.
26. LewingtonS, ClarkeR, QizilbashN, PetoR, CollinsR (2002) Age-specific relevance of usual blood pressure to vascular mortality: a meta-analysis of individual data for one million adults in 61 prospective studies. Lancet 360 : 1903–1913.
27. FukunagaH, OhkuboT, KobayashiM, TamakiY, KikuyaM, et al. (2008) Cost-effectiveness of the introduction of home blood pressure measurement in patients with office hypertension. J Hypertens 26 : 685–690.
28. StaessenJA, ByttebierG, BuntinxF, CelisH, O'BrienET, et al. (1997) Antihypertensive treatment based on conventional or ambulatory blood pressure measurement. A randomized controlled trial. JAMA 278 : 1065–1072.
29. StaessenJA, Den HondE, CelisH, FagardR, KearyL, et al. (2004) Antihypertensive treatment based on blood pressure measurement at home or in the physician's office. A randomized controlled trial. JAMA 291 : 955–964.
30. SacksHS, BerrierJ, ReitmanD, Ancona-BerkVA, ChalmersTC (1987) Meta-analyses of randomized controlled trials. N Engl J Med 316 : 450–455.
31. StewartLA, ParmarMKB (1993) Meta-analysis of the literature or of individual patient data: is there a difference? Lancet 341 : 418–422.
32. HelisE, AugustincicL, SteinerS, ChenL, TurtonP, et al. (2011) Time trends in cardiovascular and all-cause mortality in the ‘old’ and ‘new’ European Union countries. Eur J Cardiovasc Prev Rehab 18 : 347–359.
33. VieraAJ, HinderliterAL, KshirsagarAV, FineJ, DominikR (2010) Reproducibility of masked hypertension in adults with untreated borderline office blood pressure: comparison of ambulatory and home monitoring. Am J Hypertens 23 : 1190–1197.
34. Ben-DovIZ, Ben-ArieL, MeklerJ, BursztynM (2007) Reproducibility of white-coat and masked hypertension in ambulatory blood pressure monitoring. Int J Cardiol 117 : 355–359.
35. ParatiG, KilamaMO, FainiA, FacelliE, OchenK, et al. (2010) A new solar-powered blood pressure measuring device for low-resource settings. Hypertension 56 : 1047–1053.
Štítky
Interní lékařstvíČlánek vyšel v časopise
PLOS Medicine
2014 Číslo 1
- Alternativní léčebné možnosti u hypercholesterolemie při intoleranci statinů
- Vliv kombinace nutraceutik na remodelaci levé komory srdeční u osob s metabolickým syndromem
- Nutraceutika a jejich ovlivnění mírného kardiometabolického rizika
- Princip účinku medu v léčbě chronických i infikovaných ran
- Superoxidovaný roztok a jeho využití v léčbě ran
Nejčtenější v tomto čísle
- Associations between Intimate Partner Violence and Termination of Pregnancy: A Systematic Review and Meta-Analysis
- Risk Stratification by Self-Measured Home Blood Pressure across Categories of Conventional Blood Pressure: A Participant-Level Meta-Analysis
- A Risk Prediction Model for the Assessment and Triage of Women with Hypertensive Disorders of Pregnancy in Low-Resourced Settings: The miniPIERS (Pre-eclampsia Integrated Estimate of RiSk) Multi-country Prospective Cohort Study
- Scale-up of Malaria Rapid Diagnostic Tests and Artemisinin-Based Combination Therapy: Challenges and Perspectives in Sub-Saharan Africa