
The HIV Treatment Gap: Estimates of the Financial Resources Needed versus Available for Scale-Up of Antiretroviral Therapy in 97 Countries from 2015 to 2020
Arin Dutta and colleagues project global ART-related funding, global ART-related need under established targets, and the gap between the two.
Published in the journal:
. PLoS Med 12(11): e32767. doi:10.1371/journal.pmed.1001907
Category:
Research Article
doi:
https://doi.org/10.1371/journal.pmed.1001907
Summary
Arin Dutta and colleagues project global ART-related funding, global ART-related need under established targets, and the gap between the two.
Introduction
Recent global initiatives have renewed focus on rapidly scaling up antiretroviral therapy (ART) to prevent AIDS-related deaths and HIV transmission. In September 2015, the World Health Organization (WHO) early-released revised guidelines recommending that all people living with HIV be offered and voluntarily initiate ART upon diagnosis, regardless of CD4 T cell count. This recommendation urges countries to expand ART eligibility beyond recommendations made in the WHO 2013 guidelines, based on new evidence of the improved health and epidemiological benefits of initiating treatment earlier in the course of the disease [1,2]. The number of patients receiving ART and the related resource requirements could increase in countries that adopt the 2015 guidelines and raise ART coverage for the eligible patient group. These new guidelines are aligned with the recent Joint United Nations Programme on HIV/AIDS (UNAIDS) treatment targets to end the global HIV epidemic by 2030. These targets, collectively named 90-90-90, call for 90% of all people living with HIV to know their HIV status, 90% of all people diagnosed with HIV to receive sustained ART, and 90% of all people receiving ART to have durable viral suppression by 2020 [3]. Concurrent with the 90-90-90 announcement, the U.S. President’s Emergency Plan for AIDS Relief (PEPFAR) and the Children’s Investment Fund Foundation launched Accelerating Children’s HIV/AIDS Treatment (ACT) in July 2014. This US$200 million initiative aims to double the number of children receiving ART across nine priority African countries in 2 y [4]. Prior to the early release of the WHO 2015 guidelines, global leaders at the 2014 International AIDS Society Conference signed onto the Vancouver Consensus, which states that all people living with HIV should have access to treatment, further supporting the 90-90-90 initiative’s call to rapidly scale up ART coverage [5]. 90-90-90 and ACT have set ambitious targets. However, just 48% and 37% of all people living with HIV in 2013 were aware of their status and receiving ART, respectively [6]. Pediatric treatment is lagging in particular, with only 32% of children living with HIV receiving ART as of 2013 [7].
The early-released WHO 2015 guidelines and the 90-90-90 and ACT initiatives suggest initiating treatment in all people living with HIV at any CD4 T cell count. Currently, constrained resources have required most countries with a high HIV burden to prioritize treatment for only those individuals most in need, based on specific disease or demographic characteristics of groups or individuals. ART is predominantly supported by external funding in low - and lower-middle-income countries, and funding levels have plateaued in recent years [6]. The WHO guidelines on the use of antiretroviral (ARV) drugs for treating and preventing HIV infection serve as an important framework for national HIV treatment policies that define eligibility for initiating treatment, indicate preferred drug regimens, and define the type and frequency of laboratory tests conducted to monitor treatment success. In the 2013 guidelines, WHO recommended expanding eligibility—e.g., increasing the CD4 T cell count threshold, below which HIV-positive individuals are eligible to start treatment, from 350 to 500 cells/mm3 for all adults and children over age 5 y [2]. Many countries have yet to fully adopt these guidelines or increase the percentage of people reached against a denominator of need based on the new, expanded eligibility criteria [6]. The early-released WHO 2015 guidelines recommend further expansion in eligibility to all people living with HIV, and acknowledge that a phased approach to expanding eligibility may be needed in many countries with limited capacity and constrained resources [1].
Scaling up ART to ambitious levels will have significant cost implications. Only a few studies have projected the global resources needed for ART, an exercise that requires modeling the number of people expected to receive HIV treatment annually under different treatment eligibility and baseline coverage assumptions, in addition to estimating the unit cost of ART per patient per year. Several of these recent studies have limitations. They make limited use of country - or region-specific data, despite significant variance in unit costs and HIV treatment policies across countries, or do not account for uncertainty in the future coverage or unit costs of treatment [8–12]. Additionally, based on our review of the literature, there are no published studies that model future global resource requirements for pediatric and adult HIV treatment separately.
Of the existing studies that projected ART resource requirements, one estimated that the annual cost of maintaining treatment for those currently receiving ART through the Global Fund to Fight AIDS, Tuberculosis and Malaria (Global Fund) will be US$1.7 billion in 2020, assuming 2.3 million people living with HIV will be on ART and supported by the Global Fund that year [9]. Another study estimated that at least US$22 billion will be needed for HIV prevention, treatment, care, and support in 2015, assuming that 13.1 million people globally are on ART [10]. While this study used country - or region-specific epidemiological and cost data, the data were not recent. Cost data were from 2009, when ARV drug prices were significantly higher, and treatment eligibility was based on the 2010 WHO recommendations [10,13]. Further, by assuming that 80% of all those eligible for treatment would receive it in 2015, this analysis did not account for possible variations in future coverage due to different starting points [10]. A more recent study estimated that global adoption of the 2013 WHO guidelines would cost an additional US$1.8 billion in 2015 and US$3.3 billion in 2020, compared to maintaining current eligibility criteria based on the 2010 WHO guidelines [8]. This analysis appears limited by its use of the same unit cost for ART across all countries and its assumption of simultaneous and universal achievement of a target coverage rate. UNAIDS and the Global Fund have also estimated HIV resource needs. For 2020, UNAIDS estimates that the global HIV response will require US$9.7 billion, US$8.7 billion, and US$17.2 billion in low-, lower-middle-, and upper-middle-income countries, respectively [11]. The detailed assumptions behind these cost estimations are unavailable. In an analysis leading up to its fourth replenishment, spanning 2014 to 2016, the Global Fund forecasted that US$58 billion was needed for HIV response in countries eligible for Global Fund funding [12]. Similar to other modeling analyses, the Global Fund’s projections do not provide ART costs separately from those for the total HIV response. Additionally, it used historical cost data and defined universal ART coverage as 80% of those eligible for treatment receiving treatment [12].
All of these studies indicate that domestic and international funding for the global HIV response will need to increase and be sustained at higher levels as eligibility for treatment and coverage expand. Funding levels for the HIV response have remained relatively constant in recent years, and the future financial landscape is uncertain [6,14]. In low - and middle-income countries, US$19.1 billion was invested in the HIV and AIDS response in 2013, of which US$9.7 billion was estimated to be from domestic resources [6]. Donors like PEPFAR and the Global Fund are placing greater emphasis on shared responsibility and a country-led approach in the HIV response, which may require greater resource commitments from countries and regions that rely heavily on external funding for ART [14,15].
Given funding constraints for the global HIV response, it is critical to improve resource requirement and funding estimates for ART. This study seeks to fill data gaps by estimating the number of adults and children eligible for and receiving first - and second-line ART in 97 countries from 2015 to 2020, using recent epidemiological data and accounting for uncertainty in the baseline and projected numbers of people eligible for treatment, future coverage scale-up, and annual migration to second-line treatment, in addition to other factors. We also conduct an uncertainty analysis of the unit costs for ART services—medication, laboratory tests, and facility-level overhead and personnel—using recent data specific to country income levels. We compare the resource requirements to projections of available external and domestic resources for facility-level ART to assess the financial sustainability of the global ART response.
Methods
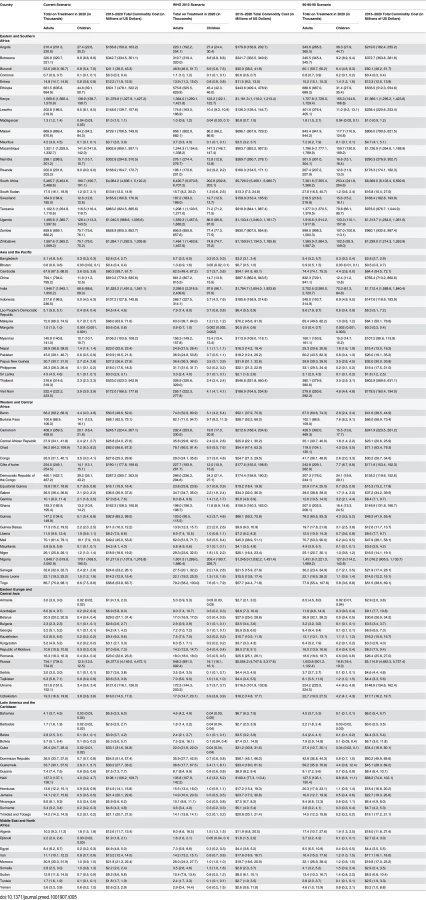
We estimated the number of adults and children eligible for and receiving HIV treatment, as well as the cost of providing ART, in 97 countries across six regions (Western and Central Africa, Eastern and Southern Africa, Latin America and the Caribbean, Eastern Europe and Central Asia, the Middle East and North Africa, and Asia and the Pacific) and four per capita gross national income levels: low-income countries (LICs), lower-middle-income countries (LMICs), upper-middle-income countries (UMICs), and high-income countries (HICs) (see Table 1).

Of the 188 countries that have in recent years reported data to UNAIDS, we excluded (1) 42 countries that had fewer than 1,000 people living with HIV or did not have an estimate for this number as of December 2013, (2) 31 countries that were members of the Organisation for Economic Co-operation and Development in 2014 (membership indicates a country is high-income and able to pay for its entire HIV response), (3) 15 countries that had other inadequate or incomplete data for analysis, and (4) three countries with low or moderate HIV epidemics that are ineligible for financing from the Global Fund. The final set of 97 countries included those eligible for Global Fund grant funding, as well as a few ineligible countries with significant HIV epidemics.
We developed three scenarios for analysis based on current eligibility and various emphases on expanding eligibility for treatment. The first scenario (current eligibility) assumes that countries will maintain current eligibility guidelines from 2015 to 2020. Based on official files, some countries plan to expand eligibility in the coming years, sometimes beyond the thresholds recommended in the 2013 WHO guidelines. Others will maintain less expanded eligibility thresholds primarily based on the 2010 WHO guidelines [16]. The second scenario (WHO 2013) assumes uniform adoption of certain aspects of the 2013 WHO guidelines across all countries in our study beginning in 2014, as discussed below. This scenario examines the impact of a harmonized standard for treatment eligibility. The third scenario (90-90-90) is based on expanding eligibility as per the early-released WHO 2015 guidelines and achieving the UNAIDS 90-90-90 targets. This scenario assumes that all people diagnosed with HIV are eligible for treatment. Scale up in coverage across all three scenarios is based on countries' historical rates of increase, adjusted for changes in eligibility. These increases in coverage may be ambitious for some countries that experienced rapid ART scale-up in recent years.
Across all scenarios, we modeled underlying uncertainty in the numbers of people eligible for treatment, coverage of treatment, and the unit cost of various treatment inputs per person. A parametric uncertainty analysis was not in the original analysis plan but emerged during the peer review process. Uncertainty in future estimates of numbers of individuals on ART and the costs of these services derives from uncertain estimates of the number of people living with HIV and needing treatment, future coverage achieved by countries, switching rates from first - to second-line ART, future unit costs, as well as other parameters. The range of uncertainty in projections of future populations eligible for ART and the number of people living with HIV depends fundamentally on the methods and quality of data used to estimate national prevalence curves from historic point HIV prevalence estimates in sentinel surveillance and population-based surveys [17]. The Spectrum AIDS Impact Model (AIM) is an internationally recognized modeling platform designed to forecast HIV epidemiological trends based on demographic and epidemiological parameters specific to each country’s epidemic, and is used by UNAIDS for its published estimates and by individual countries [6,8,10,18–20]. It has been described formally elsewhere [21]. Official AIM estimates derive HIV prevalence and incidence using the Estimation and Projection Package (EPP). The EPP analysis is based on HIV sentinel surveillance and population-based surveys, integrated bio-behavioral surveillance surveys, and assumptions about epidemic pattern by country [21]. See S1 Text for more details on the EPP and AIM Country Data Package in Spectrum. AIM builds on EPP and tracks adults living with HIV by age, sex, and CD4 T cell count. There are seven CD4 T cell count categories, ranging from less than 50 to more than 500 cells/mm3. From year to year, a person can stay in the same CD4 T cell count category, move to the next lower category, die from HIV-related causes, die from non-HIV causes, or initiate ART. The parameters for these transitions are based on cohort data from the Analysing Longitudinal Population-Based HIV/AIDS Data on Africa (ALPHA) network [21]. Mortality for those on ART is based on an analysis by the International Epidemiologic Databases to Evaluate AIDS consortium and depends on CD4 T cell count at the time of ART initiation, duration on treatment, sex, and age [22]. Children living with HIV are also tracked by age and CD4 T cell count. Their mortality rate depends on when they acquire HIV and whether or not they receive ART and/or co-trimoxazole.
We conducted probabilistic sensitivity analysis to examine the impact of uncertain epidemiological, coverage, and unit cost inputs in the model. Expected mean values were derived from sampling events in 5,000 second-order Monte Carlo simulation trials performed using RiskAMP software (Structured Data LLC) integrated with Microsoft Excel [23]. Each simulation was run simultaneously over all uncertain parameters. The simulation utilized distribution types with bounds and modes derived from country-specific Spectrum and/or other secondary data as described in Table 2 (also see S1 and S2 Texts). Confidence intervals were estimated for most results to describe the overall uncertainty in the estimates. Uncertainty bounds for future financial resources available for HIV were not similarly quantifiable, and hence were not modeled. Deterministic analysis for certain types of funding sources, such as PEPFAR, was performed where feasible and is discussed further below. Most data are from third-party sources including government agencies, watchdog organizations, and external funding organizations. Additional details on data sources and data accessibility can be found in S5 Text.

Estimating the Number of People Receiving HIV Treatment
The study estimates the number of people receiving HIV treatment annually in each country based on the numbers of adults and children eligible for treatment and country-specific coverage rates, i.e., the estimated percentage of people eligible for treatment who will receive treatment each year. We define children as people ages 0–14 y and adults as people ages 15 y and older based on previous WHO recommendations for these age groups [2]. However, the early-released WHO 2015 guidelines define children as the age group 0–10 y. The number of people eligible for treatment varies across the three scenarios: current eligibility, WHO 2013, and 90-90-90. The number of adults and children on first - and second-line treatment is based on (1) baseline proportions of people on each line of treatment by country or region from a literature review and (2) annual migration from first - to second-line treatment. Migration rates were derived based on data on resistance to first-line treatment and other trends by country or region. Mortality on second-line treatment was incorporated when carrying over patients from year to year. Both mortality and migration rates were subjected to second-order Monte Carlo simulation, based on the assumptions shown in Table 2. The number of patients on third-line treatment is increasing in low - and lower-middle-income countries, particularly in sub-Saharan Africa. However, these patient populations are still small. As a result, we excluded this group of patients from our analysis.
Eligibility for Treatment
The study used the uncertainty analysis function in the AIM within the Spectrum software to estimate the median number and 95% confidence interval of people eligible for treatment from 2013 to 2020 across scenarios in each of the 97 countries. The uncertainty analysis randomly selected parameter values for the number of people eligible for treatment for each of the 250 iterations run. For 81 countries, we used the official national Spectrum estimates projection file, obtained from UNAIDS [16]. For 15 countries, we used the Country Data Package in Spectrum and adjusted methods to generate country-specific projections and conduct the uncertainty analysis because of the unavailability of national country AIM files (for a description of these methods, see S1 Text). These ranges from the Spectrum uncertainty analysis were thereafter used in the second-order Monte Carlo simulations, as per Table 2.
As discussed above, we developed three treatment eligibility scenarios for each country. For each scenario, we conducted separate AIM analyses including uncertainty within Spectrum to account for shifts in need for treatment. This resulted in a total of 291 projections across the three scenarios and 97 countries. The first scenario, current eligibility, assumes each country’s eligibility criteria from 2014 to 2020 will be the criteria as set in each country’s official AIM file updated up to 2013 (see S1 Text). In this scenario, CD4 T cell count thresholds for initiating treatment vary by country based on which WHO guidelines countries follow. The second scenario, WHO 2013, assumes that all countries adopt certain aspects of the 2013 WHO guidelines universally beginning in 2014. Universal implementation of these elements of the guidelines would expand the number of treatment-eligible people living with HIV globally, especially since some high-burden countries still apply eligibility thresholds based on the 2010 WHO guidelines and have not made official plans for expanding eligibility in the near term [6,67–69]. The 2013 WHO guidelines recommended expanding eligibility to initiate ART to additional age groups, those co-infected with hepatitis B or tuberculosis, HIV-positive pregnant women, and HIV-positive individuals in a serodiscordant partnership (see Table A in S1 Text) [70]. However, we excluded serodiscordant couples and those co-infected with hepatitis B from our analysis because of a lack of country-specific data and because of the fact that many of the HIV-positive people who are in a serodiscordant relationship are included under the expanded CD4 T cell threshold or as HIV-positive pregnant women. This approach also enabled a focus on analysis of the stronger recommendations for adults, children, pregnant women, and those co-infected with tuberculosis in the 2013 WHO guidelines [2].
The third scenario, 90-90-90, is based on accelerating coverage increases towards the 90-90-90 target and assumes eligibility will expand to all people living with HIV who know their HIV status, as per the recommendations in the early-released 2015 WHO guidelines [3]. To meet the 90-90-90 treatment targets, at least 81% of all people living with HIV will need to be on ART by 2020. We derive this by multiplying 90% by 90%, as 90% of all people living with HIV will be diagnosed with HIV by 2020, and 90% of these people will be on ART. It may also be possible to achieve the 90-90-90 treatment target under the WHO 2013 scenario if countries rapidly scale up treatment coverage in addition to expanding eligibility based on some aspects of the 2013 WHO guidelines. We will compare the number of treatment-eligible people under each scenario to comment on the relationship between global scale-up of ART based on the eligibility thresholds and the 90-90-90 target.
Annual Coverage Rate for ART
We primarily used data from country-specific AIM analyses and officially reported figures for adults and children living with HIV on ART to establish the baseline coverage of adults and children for ART in 2013 in each of the 97 countries [6,24]. If country-level data for numbers on ART were missing, we used data from the UNAIDS AIDSinfo database or recent Global AIDS Response Progress Reporting [24]. These are data usually submitted by national governments. As of May 2015, data updated to December 2013 or June 2014 were available for most of the 97 countries included in our analysis. The baseline coverage was calculated as a percentage for adults and children by dividing the number of people on treatment at the end of December 2013 by the simulated mean number of people eligible for treatment in December 2013, as determined from the Monte Carlo simulation (Table 2) corresponding to the eligibility scenario. Figs 1 and 2 show the baseline coverage by country and region for adults and children, respectively. (Please see S1 Text for more details on determining coverage.)


Actual country plans to scale up ART vary and are dependent on local interpretation of WHO recommendations, financial resources available, and overarching national HIV strategies. Given the uncertainty in future scale-up paths, we modeled as uncertain the likely value for the annual percentage increase in coverage each year from 2015 to 2020 by country under each of the three scenarios. Based on Monte Carlo simulations, we derived a mean coverage increase based on ranges determined by countries’ and regions’ historical achievement for ART from 2011 to 2013 (see Table 2). If coverage reached 100% of the modeled eligibility in a year, we capped the coverage rate at 100% for the remaining years of analysis.
Our approach for estimating coverage differs from other studies that assume universal coverage rates in a particular future year without considering differing starting points for baseline coverage levels or the factors governing uncertainty in a country’s ability to scale up coverage. For instance, the 2014 study by Stover et al. assumes that 80% of all treatment-eligible people will receive treatment globally in 2015 [8]. By accounting for country-specific starting points and country - or region-specific uncertainty in future treatment scale-up across scenarios, we believe our study presents more rigorous ranges for targets for the total number of adults and children on treatment from 2015 to 2020.
First - versus Second-Line Treatment
Second-line ART is more resource-intensive than first-line regimens, and the need for such treatment is growing globally, particularly in Africa, as more patients need to switch regimens due to treatment failure [30,34,71]. However, actual migration rates from first - to second-line regimens at the national level are poorly understood, though more data on underlying factors are becoming available [25,30]. Despite the difference in cost and the rising need for second-line regimens, our literature review did not reveal any recent costing studies of ART that account for uncertainty in changes in the number of people receiving second - versus first-line treatment in a global cost analysis.
We used region-specific—and, where available, country-specific—data to model the proportion of adults and children switching to second-line treatment each year. For the baseline split across lines of ART, WHO estimates for adults and children on first - and second-line ART in 2013, country - or region-specific first - versus second-line splits from UNAIDS Global AIDS Response Progress Reporting, and other sources were used to establish the proportions of individuals on first - versus second-line treatment by country [26,27,29,31,32,72]. Annual switching rates were modeled as uncertain rates differentiated at the regional level, with ranges as per Table 2. Ranges by region were set based on literature review of trends in treatment failure, adherence, and clinical management on ART (see S1 Text for a discussion of the trends).
The means from Monte Carlo simulations of annual migration rates from first - to second-line ART were used to estimate the number of patients on first-line ART who would switch to second-line treatment each year and the annual mortality rate among patients on second-line ART, by country. We also used region-specific mortality rates, modeled as an uncertain value (see Table 2), for those on second-line ART to estimate annual mortality rates among the patients on second-line ART carried over year to year.
Estimating the Costs of HIV Treatment
While there are few modeling analyses estimating the total global costs of ART, several facility-based costing studies, mostly conducted in sub-Saharan Africa, estimate the per-person unit cost of providing ART. In the largest study of its kind, Tagar et al. collected data from a stratified random sample of 161 facilities in five African countries and found that facility-level ART costs ranged from US$136 per patient-year in Malawi to US$682 in South Africa. These costs included drugs, laboratory testing, direct and indirect personnel costs, patient support, equipment, and administrative services [53]. Another study collected HIV treatment costs from 54 clinical sites in six countries and estimated that adult HIV treatment costs per patient per year ranged from US$177 to US$353, depending on the stage of treatment. Patient volume and facility maturity were significant predictors of these facility-level HIV treatment costs [73]. Facility-based studies that estimated unit costs for pediatric HIV treatment found that they are often comparable to adult HIV treatment costs [73]. The average annual cost of providing ART to a child in Zambia was US$209 in 2011, ranging from US$116 to US$516 depending on site [59]. The cost is higher in South Africa: the first-year average cost per child in care and responding to treatment was US$830 at one site and US$678 at another [41]. Duong et al. found that the median costs of non-first-year ART and second-line ART per patient-year in Viet Nam were US$303 and US$1,557 in adults and US$320 and US$1,069 in children, respectively [63]. Other methodologies have also been used to estimate the average unit cost of HIV treatment. Doherty et al. estimated the unit costs of various pediatric HIV treatment regimens based on WHO guidelines by weight band and a ceiling price list provided by the Clinton Health Access Initiative [15]. A systematic review of ART unit costing studies from 2001 to 2009 found that median ART cost per patient-year varied by country income level: median ART costs were US$792, US$932, and US$1,454 for low-income, lower-middle-income, and upper-middle-income countries, respectively [54]. Due to substantial shifts in the pricing of ARVs since this period, these estimates are unsuitable for future cost projections. While ARVs were the largest cost drivers for ART in all settings, analysis of ARV procurement data suggests that the price of ART has declined significantly in more recent years [13,54,74].
This study uses an ingredients-based approach to estimate the unit cost of HIV treatment. We estimated the unit cost of ARVs; laboratory monitoring through CD4 T cell count, viral load, hematology, and clinical chemistry panel tests; and facility-level personnel salaries and overhead expenses, differentiated by country income level. We did not use standard unit costs across all countries because prior studies have shown that costs vary by region and a country’s income level [54,75]. There is also uncertainty in these costs, particularly surrounding future ARV price reductions and middle-income countries’ ability to negotiate and expand access to generic ARVs. We accounted for this uncertainty in determining unit costs for ARVs, laboratory, personnel, and overhead using Monte Carlo simulations based on ranges for current baseline costs and future reductions in costs (ARVs and laboratory only) by country income level (see Table 2). Accounting for projected declines in commodity costs over time was taken into consideration during the peer review process. Cost data were adjusted to constant 2014 US dollars [76].
Costs of Antiretroviral Drugs
We estimated the current range in adult and pediatric first - and second-line ARV costs by country income level, separating sub-Saharan Africa from other zones, using the Global Price Reporting Mechanism (GPRM) database. This publically available database shows prices that countries have actually paid for ARVs, rather than the price quoted by manufacturers or the cost to the end user [34]. For more information on the GPRM and our dataset, please see S3 Text.
The GPRM data query yields the lowest, median, and highest cost per patient-year for select regimens by dosage strength derived from recent country-specific transactions. We sorted these cost results by the World Bank’s income classification scheme (LICs, LMICs, UMICs, and HICs) and zone (sub-Saharan Africa versus all other zones). These ranges were used as parameters for an uncertainty analysis of the current treatment unit costs. We retrieved prices for commonly used and WHO-recommended regimens for adults and children on first - and second-line treatment (see Fig 3 for regimens included in the analysis). The regimens and dosage strengths chosen for analysis are based on WHO recommendations and ARV market analyses [2,26,33]. Transactions before 2011 were excluded. When two or more ARV formulations were used in a particular treatment regimen, their median price based on dosage was summed to estimate the median price of the entire regimen. We used the Clinton Health Access Initiative August 2014 price ceiling list to set the upper limit on ARV costs in LICs. For all HICs except Russia, we assumed ARV costs were equal to those in UMICs [39]. In Russia, we used country-specific pricing data to set the cost parameters because of the very high prices in that country (see Tables B and C in S3 Text) [40].

We assumed that the percentage of adults and children on each regimen would change over time. While stavudine (d4T)–and zidovudine (ZDV)–based regimens are expected to decrease as a proportion of adult formulations, tenofovir (TDF)–based regimens’ market share is expected to increase. For pediatric treatment, d4T-based regimens will further decrease in use, and ZDV-based regimens will continue to represent over half of the market share. Approximately one-third of adult formulations are projected to be nevirapine (NVP)–based, and two-thirds efavirenz (EFV)–based. The majority of pediatric formulations will be NVP-based, with regimens based on lopinavir/ritonavir and EFV comprising the remaining market share [26].
Drug prices have declined significantly from 2000 to 2014, largely because of price reductions in, and expanded access to, generic ARVs [35,36]. Fixed-dose combinations have lowered the cost of ART in recent years and have improved outcomes through improvements in treatment adherence (patients following recommended treatment dosing and frequency) and persistence (length of treatment) [37]. Better procurement policies, improved coordination, partnerships, and increased competition (e.g., competitive pricing of TDF-based fixed-dose combinations that replace d4T-based regimens) have also allowed low - and middle-income countries to provide WHO-recommended regimens at a lower cost and lower patient-level toxicity [37]. For instance, the lowest generic price of the fixed-dose first-line regimen TDF/lamivudine/EFV has declined from US$426 per person per year in 2007 to US$136 per person per year in 2014. The lowest generic price for the protease inhibitor lopinavir/ritonavir, which is commonly used in adult second-line treatment, also declined drastically from 2007 to 2014, from US$1,034 to US$250 per person per year [36]. However, it is unlikely that ARV prices will continue to decrease at this rate, especially for widely used ARVs, including ZDV, lamivudine, and NVP, that are procured in high volumes [33]. There are mixed signals for how ARV pricing in UMICs will change in the future, and ARV pricing is highly sensitive to these countries’ ability to negotiate with generic and original manufacturers and to their compulsory licensing and trade policies. South Africa has been able to negotiate significant price reductions in recent years. However, market analyses suggest that current prices in LICs, particularly for adult first-line treatment, are near the price floor [35,36,38]. UMICs and HICs face the biggest challenge in accessing lower prices [36]. In order to account for uncertainty in future price declines, we used GPRM price trends from 2011 to 2013 and recent ARV market analyses to set ranges for potential annual price declines by country income level [35,36,38]. These ranges were included in the Monte Carlo simulation analysis (see Table 2). In general, we assumed that recent trends in price declines represent the upper bound for future price declines for adult first-line treatment across income groups. For pediatric first - and second-line treatment in middle - and high-income countries, we assumed recent rates of price declines could continue [35].
Using predicted prices, global ARV market projections for the proportion of people on particular regimens, and WHO recommendations for second-line treatment, we simulated a weighted average unit cost of adult and pediatric first - and second-line treatment each year [2,26,33]. Table 3 shows the mean ARV costs per patient per year, by country income level (with sub-Saharan Africa separated). These mean unit costs were reality-checked through comparisons with data from recently published unit costing studies, as well as from the US Agency for International Development–and PEPFAR-funded Health Policy Project’s in-country technical assistance in Ghana, Mozambique, Tanzania, Madagascar, Ukraine, and Kenya [42,43,53].

Laboratory Costs
We modeled the unit cost of laboratory tests as uncertain based on recent literature and in-country analyses on the reagent and commodity costs of monitoring viral load and CD4 cell count and conducting hematology and clinical chemistry panel tests for ART patients. Cost data collected prior to 2011 were excluded from the analysis. The data used are from 12 countries (primarily in sub-Saharan Africa) and were collected by the Clinton Health Access Initiative, the Health Policy Project, and Médecins Sans Frontières; we compared these data to results in older studies [28,42–46,53]. Costs per test were categorized by country income level and zone, and laboratory costs per patient per year were based on frequency assumptions. We assumed that every ART patient in LICs and LMICs would receive one viral load, CD4 T cell count, hematology, and clinical chemistry panel test per year. For UMICs and HICs, we assumed patients would receive two hematology and clinical chemistry panel tests per year because of improved patient monitoring conditions in those settings. The 2013 WHO guidelines recommend two CD4 T cell count tests per ART patient per year, but the average number of CD4 tests per patient per year in sub-Saharan Africa is currently less than two, and the need for frequent CD4 T cell count testing for patient monitoring could be scaled back as countries move to routine viral load testing [47,53]. Although the 2013 WHO guidelines recommend routine use of virological testing to detect early signs of treatment failure, many countries do not conduct routine viral load testing because of the still high costs per test and the need for specialized laboratory equipment [48,53]. Instead, immunological tests are performed to detect the level of CD4 T cells. As a result, we ran an additional scenario that assumes targeted viral load testing, i.e., viral load tests being conducted only among those with suspected virological failure. Under this targeted viral load testing scenario, 5% of ART patients in LICs and LMICs and 10% of patients in UMICs and HICs would receive a viral load test in a year, and all patients would receive two CD4 count tests per year.
The lower bound for current costs of viral load testing in LICs and LMICs is Roche Diagnostics’s recently announced global access price of US$9.40 [49]. We used the average cost within country income groups from the data sources discussed above as the most likely cost, which was significantly higher than US$9.40. The upper limit for uncertainty analysis was the highest reported price within a country income group. The highest effective cost per viral load test, particularly in LICs (shown in Table 4), is likely a result of the low batch volume of the viral load assays run, rather than resulting from higher prices of reagents and supplies [45]. Because there were limited data for UMICs and HICs, we used a large range (US$10–US$60) for uncertainty analysis of the cost of viral load testing in these country income groups. For all other tests, we generally used the lowest, average, and highest prices within each country income group classification to determine the uncertainty in baseline costs of laboratory tests.

Similar to ARVs, viral load and CD4 testing costs have declined over the last decade, by as much as 80%, though it is uncertain whether and to what extent prices may decline further [50]. The cost of HIV diagnosis and monitoring could be lowered through increased use of new technologies, including point-of-care testing, greater competition and better coordination in procurement, and increased testing volumes [51,52]. Once available, a single-use disposable CD4 test could be priced as low as US$2–US$3 per test [48]. Given the uncertainty in future CD4 test costs, we assumed the range in cost declines from 2015 to 2020 to be 0% to 16%. Because of wide ranges in current viral load test costs and countries’ ability to increase viral load testing volumes and efficiency, we assumed a wide range for annual cost declines (0% to 20%) for viral load testing [45]. The costs of hematology and clinical chemistry panel tests are likely to stay relatively constant in real terms, so we did not develop uncertainty parameters for changes in these costs.
Table 4 shows the mean weighted unit cost for all laboratory tests by country income level and zone. These costs are in line with UNITAID estimates. According to UNITAID, the current cost of CD4 reagents and consumables ranges from US$3 to US$16 per test, depending on testing volumes and reagents used. In relation, costs for viral load testing are currently significantly higher, at about US$28 to US$29 per test, though higher unit costs have been reported for LICs, and lower costs elsewhere [43–45]. One component of the cost of hematology tests is the basic full blood count; the average cost of consumables for this test is about US$3.15 per test. The cost of a limited blood chemistry panel test, with consumables, ranges from US$1.60 to US$1.95 per test [48].
Facility-Level Overhead and Personnel Costs
We estimated ranges for the unit cost per patient-year of facility-level overhead (e.g., for utilities) and personnel costs (e.g., for clinical health workers who directly deliver treatment interventions) based on a review of recent country-specific studies [28,53–55,57, 58,60–63]. The estimates of unit costs of facility-level overhead differ across studies because of the inclusion of different cost elements. We focused on studies where we could separate the unit costs of equipment, utilities, supplies, and other recurrent facility-level costs. For the types of costs included under the rubric of “overhead,” see Table A in S3 Text. The original data analysis plan estimated facility-level personnel and overhead costs as a proportion of the cost of ARVs and laboratory reagents; however, based on comments from peer reviewers, we decided to use stable dollar value estimates of personnel and overhead costs per patient per year.
The median unit cost of overhead and personnel, differentiated by the LIC, LMIC, and UMIC/HIC groups, was determined as the mode for Monte Carlo uncertainty analysis, with the lowest and highest unit costs within each group representing lower and upper bounds (see Table 2). A total of 23 and 19 data points were used to estimate personnel and overhead costs, respectively, eliminating extreme outliers. While we lack a methodology to rigorously model how overhead and personnel costs could change over time, we applied an uncertain, one-time modest efficiency gain factor to the 2014 estimate from the literature that ranges from 0.5 to 1, where 1 represents no efficiency gain (i.e., unit costs of personnel and overhead per patient-year do not decrease with increased patient volume). We set the bounds for simulating the efficiency gain factor by country income group, based on a prior study and recent evidence for efficiency improvement (see Table 2) [65,66]. For all but UMICs and HICs, the one-time efficiency reduction in the unit cost was 8% or less. For UMIC/HIC overhead costs, which at baseline were quite large, a larger reduction was taken. The unit value per patient-year for personnel and overhead costs is shown by country income level in Table 4.
Estimating Financial Resources Available for ART
We estimated the financial resources available for ART based on country-specific funding trends from external and domestic sources. For external funding, we analyzed contributions from PEPFAR and the Global Fund. We also excluded any multi-country regional support from PEPFAR or the Global Fund where the funding values could not be disaggregated by country. Support for ART for adults and children from PEPFAR extended to 39 countries and regional programs in fiscal year 2014 [55]. This support included ARV drugs and laboratory commodities for many of these countries, as well as health system strengthening and temporary staff. The Global Fund has 252 active HIV-related grants and has dispensed US$14 billion for HIV prevention, treatment, and care since 2002. Approximately 40% of Global Fund grants support commodity procurement [13].
We used the Price and Quality Reporting Tool, a database with transaction-level procurement information, to estimate Global Fund contributions to ARV and laboratory commodity procurement (CD4 T cell count and viral load tests only) from 2011 to 2014 in countries eligible for Global Fund funding as of 2014 [77]. We also reviewed country allocations under the Global Fund’s new funding model (NFM) for the period 2014 to 2016 to reality-check the estimated contributions for commodities against a notional ceiling imposed by the allocation amount, which is for the entire national HIV response [78]. Many recent NFM grant applications have been focused on commodities. Global Fund disbursements can vary by year over the grant period, and grant-funded procurements may span needs across calendar years, so we calculated the recent average financial resources available for ART commodities per year unless these values were specified in the country-specific NFM grant documents we had access to. We assumed that annual Global Fund contributions as a dollar amount would remain constant from 2015 to 2020, unless specific country-level details were available on future Global Fund funding for ART, by year. For the 32 of our 97 countries that PEPFAR supports, PEPFAR resources for the cost categories included in our financial resource projections—ARVs, laboratory commodities, and facility-level overhead and personnel—were based on 2014 expenditure data from the interactive PEPFAR Dashboards database. This database includes planned budget and expenditure data from PEPFAR Country Operational Plans (see S4 Text) [55]. We estimated two scenarios: expansive versus conservative PEPFAR contribution to facility-level personnel and overhead in each country. These scenarios were needed to capture uncertainty related to the types of site-level overhead costs included in PEPFAR funding for facility-level care and treatment, and because of unclear information on the types of costs included in certain unit cost studies we reviewed on facility-level overhead costs. While the conservative contribution scenario included PEPFAR cost categories that are most aligned with the cost categories used to estimate facility-level overhead resource requirements, the expansive contribution scenario included additional PEPFAR cost categories that may include some funding for our definition of facility-level overhead. We assumed future funding levels from PEPFAR would remain constant each year at our estimated contribution levels. By keeping PEPFAR and Global Fund contributions constant as a dollar figure, we assumed that external funding for ART as a percentage of the total resources needed was decreasing over time. However, recent information on PEPFAR priorities suggests that its funding for ART and care for people living with HIV will maintain or increase its share of total PEPFAR resources [79].
Domestic resources available for ART were based on various sources [6,11]. We used country-reported contributions to ART commodity procurement for 15 countries that had this information publicly available or cited in the media (see S4 Text for specific analyses conducted for India and all sources of related data across countries). In the remaining countries, we estimated domestic contributions (DCs) to commodity procurement in countries eligible for Global Fund financing using the Global Fund’s counterpart financing thresholds (CFT), which require a minimum level of matching government contribution as a share of Global Fund financing for commodities, distinct by country income status and HIV disease burden. In applying these CFT proportions to future Global Fund support levels, we are making an ambitious assumption that countries are willing and able to contribute to ARV and laboratory commodity procurement at increasing levels. The Global Fund does not require the CFT to be based on commodity procurement, and countries can contribute their financial resources in different areas aligned to the national response. For countries not eligible for Global Fund financing, we estimated the proportional potential DC based on countries’ reported contributions to their overall HIV responses [24,40,80–96]. We multiplied the total ARV and laboratory resource need by this DC percentage to estimate such countries’ DCs to commodity procurement. DC toward the cost of facility-based personnel and overhead was estimated separately by multiplying the country-specific estimated total cost of facility-based overhead and personnel each year by the DC percentage. We assumed that the country-specific percentage contributions from CFT or DC, as applicable, to commodity procurement and facility-level costs would remain constant from 2015 to 2020 unless country-specific data suggested otherwise. As resource requirements increase over time, this implies DCs will increase. Overall, our methods imply an optimistic and large DC to ART commodities, beyond the traditional areas of health workforce and facility-level overhead that many country governments have funded. (See S4 Text for a description of the CFT levels and the sources for DC estimates.)
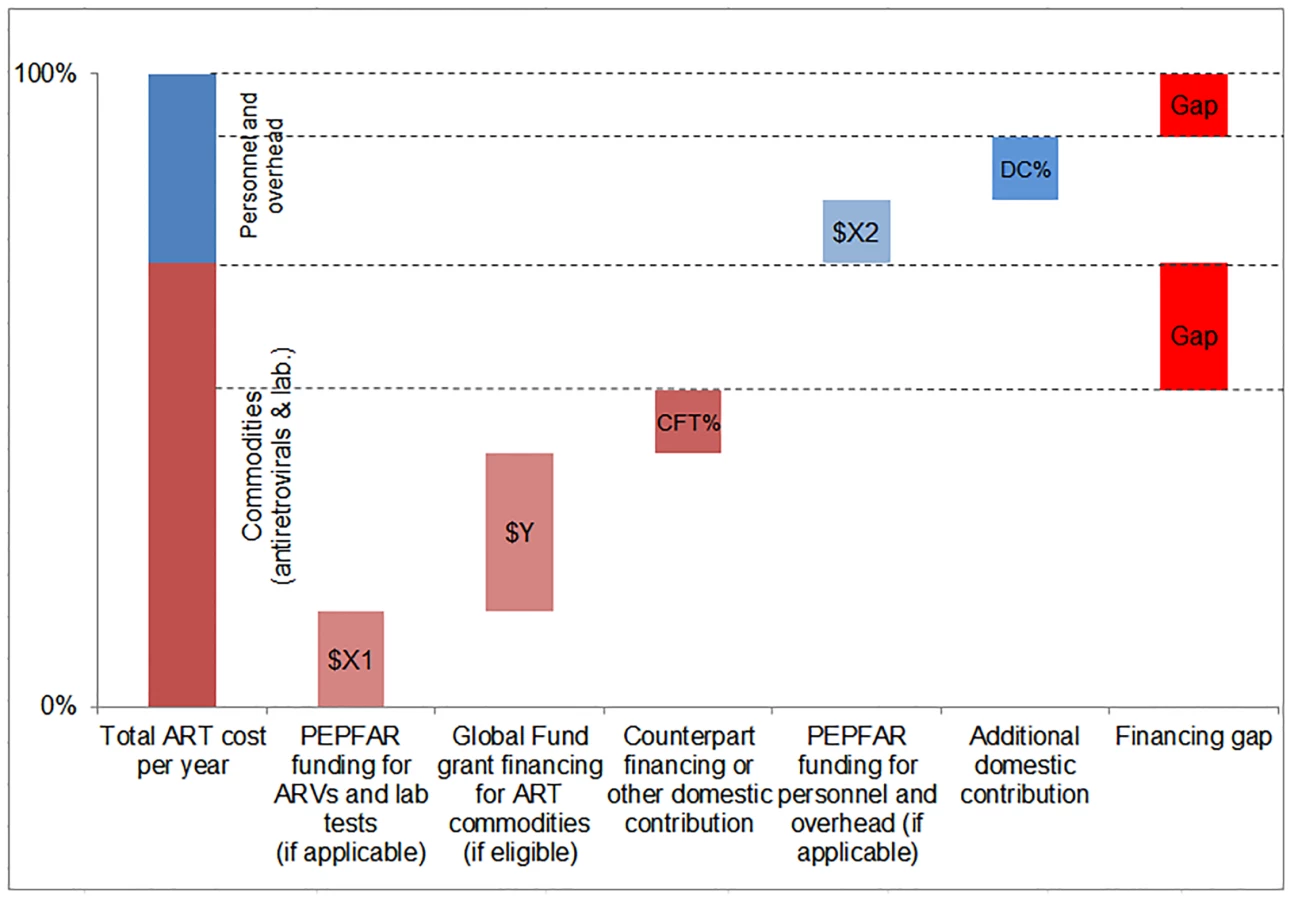
We compared the simulated mean financial resources required by country for each of our three scenarios to resources available for ART to estimate the potential funding gap range. We estimated the commodity funding gap by subtracting Global Fund, PEPFAR, and domestic (CFT or other) contributions from the total cost of ARVs and laboratory commodities under each eligibility scenario, by year (Fig 4). We then estimated the funding gap for personnel and overhead costs by subtracting PEPFAR funding, where applicable, and DCs from the total cost of personnel and overhead under each scenario by year. The range in total funding gap for ART was estimated to be the commodity gap plus the gap for personnel and overhead for each scenario. See Fig 4 for a graphic representation of the methodology used to estimate the funding gap.
Results
Eligibility for ART
Under the current eligibility scenario and with the forecast increase in coverage annually, we estimate that the number of people eligible for treatment will increase from 21 (95% CI 20.6, 21.4) million adults living with HIV and 1.74 (95% CI 1.72, 1.77) million children living with HIV in 2015 to 27.9 (95% CI 27.4, 28.4) million adults and 1.93 (95% CI 1.89, 1.96) million children in 2020. Universal adoption of select aspects of the 2013 WHO guidelines in 2014 further expands the number of people living with HIV eligible for treatment to 24.5 (95% CI 24.0, 25.0) million adults and 1.66 (95% CI 1.63, 1.70) million children in 2015 and 31.3 (95% CI 30.7, 32.0) million adults and 1.90 (95% CI 1.85, 1.95) million children in 2020. There are more children eligible for treatment under the WHO 2013 scenario than the current scenario due to some countries having pediatric eligibility criteria that exceed the 2013 WHO guidelines and the fact that need for pediatric ART declines as the future incidence among this age group decreases with increases in ART coverage among mothers. Our 90-90-90 scenario assumes that countries will adopt the WHO 2015 guidelines and that all people living with HIV who know their status will be eligible for treatment. In this case, we estimate 35.3 (95% CI 34.7, 35.9) million adults and 2.54 (95% CI 2.49, 2.58) million children will be eligible for ART in 2020. By dividing the simulated mean number of people eligible for treatment under the current eligibility and WHO 2013 scenarios by the mean number of people eligible for treatment under the 90-90-90 scenario (i.e., mean number of people living with HIV), we are able to estimate whether or not the 90-90-90 targets can be met under certain eligibility criteria. Our results indicate that 79% of all people living with HIV could be eligible for treatment in 2020 if current eligibility criteria were maintained. In comparison, those eligible for treatment under the WHO 2013 scenario may represent 88% of all people living with HIV in 2020. These results suggest that the 90-90-90 target of 81% of all people living with HIV on treatment by 2020 would not be reached under the current eligibility scenario.
Numbers of Patients on ART
The number of adults and children who may be on ART each year is dependent on the mean number of treatment-eligible people and on the annual scale-up of coverage. Under the current eligibility scenario, given coverage increases based on historical rates, we estimate the numbers on treatment to grow to 25.7 (95% CI 25.5, 26.0) million adults and 1.57 (95% CI 1.55, 1.60) million children in 2020, meaning 92% (95% CI 91%, 94%) of adults and 82% (95% CI 80%, 83%) of children eligible for treatment would be on ART (Table 5). Our results indicate that coverage using all people living with HIV as the denominator would be 72% in 2020 under this scenario, which is short of the 81% target under 90-90-90. By 2020, 26.5 (95% CI 26.0, 27.0) million adults and 1.53 (95% CI 1.52, 1.55) million children could receive ART if countries universally adopt select elements from the 2013 WHO eligibility recommendations and scale up coverage (see Figs 5 and 6). Under this scenario, 85% (95% CI 82%, 86%) of adults and 81% (95% CI 79%, 83%) of children eligible for treatment would be on ART in 2020. Our results suggest that 90-90-90 targets may not be met under this scenario, as we estimate only 74% of people living with HIV would be on treatment in 2020. Under the 90-90-90 scenario, we forecast 86% (95% CI 85%, 88%) of adults living with HIV and 66% (95% CI 65%, 68%) of children living with HIV would be on treatment by December 2020, based on 30.4 (95% CI 30.1, 30.7) million adults living with HIV and 1.68 (95% CI 1.63, 1.73) million children living with HIV on ART.


Under the current eligibility scenario, 64% of adults and 69% of children on ART in 2020 could be in Eastern and Southern Africa. Approximately 16% of all adults and 21% of all children on ART globally could reside in Western and Central Africa in 2020. About 15% of adults on ART could be in Asia and the Pacific under this scenario. The region with the smallest proportion of the global estimate of people on ART is the Middle East and North Africa: just 0.3% of adults and 0.4% of children on treatment globally could be from this region in 2020. Similar patterns are evident in the other two scenarios, although the Asia/Pacific region has the second highest number of adults on treatment under the WHO 2013 and 90-90-90 scenarios in 2020.
We estimate that approximately 0.5 million adults and 0.04 million children received second-line ARVs in 2013. By 2020, 2.5 (95% CI 2.3, 2.8) million adults living with HIV will be on second-line treatment under the current eligibility scenario. Under the WHO 2013 and 90-90-90 scenarios, we estimate that 2.6 (95% CI 2.4, 2.9) and 2.8 (95% CI 2.5, 3.x) million adults, respectively, will be on second-line treatment in 2020. Across all three scenarios, the number of children living with HIV on second-line treatment in 2020 is about the same, at 0.17 million (exact point estimates and confidence intervals vary slightly by scenario).
Resource Requirements for HIV Treatment
The total 6-y cost of scaling up adult ART globally from 2015 to 2020 is estimated to be US$43.6 (95% CI 43.2, 44.1) billion under the current eligibility scenario, US$46.6 (95% CI 45.7, 47.5) billion under the WHO 2013 eligibility scenario, and US$50.2 (95% CI 49.1, 51.3) billion under the 90-90-90 scenario (Figs 7 and 8). The cost of ARVs and laboratory commodities for adult ART over the same time period is US$23.9 (95% CI 23.6, 24.1) billion, US$25.2 (95% CI 24.8, 25.7) billion, and US$26.9 (95% CI 26.2, 27.6) billion under the current eligibility, WHO 2013, and 90-90-90 scenarios, respectively. The cost of pediatric treatment across all 6 y for the three scenarios is US$2.14 (95% CI 2.12, 2.17) billion, US$2.14 (95% CI 2.11, 2.16) billion, and US$2.33 (95% CI 2.27, 2.39) billion, with ARVs and laboratory commodities costing US$1.17 (95% CI 1.15, 1.18) billion, US$1.15 (95% CI 1.13, 1.17) billion, and US$1.22 (95% CI 1.19, 1.24) billion under the current eligibility, WHO 2013, and 90-90-90 scenarios, respectively. If countries implemented targeted rather than routine viral load testing, we estimate that total 6-y laboratory costs would decrease by approximately US$1.52 billion, US$1.53 billion, and US$1.63 billion under the current eligibility, WHO 2013, and 90-90-90 scenarios, respectively.


Facility-level personnel and overhead costs represent 45% to 47% of the total 6-y ART costs for adult ART and 46% to 48% of the total ART costs for pediatric ART across the scenarios. ARVs are also a significant proportion of the resource requirements for ART; depending on the scenario, ARVs represent between 41% and 45% of total 6-y ART costs. By 2020, second-line adult ARVs cost US$0.67 (95% CI 0.62, 0.72) billion under the current eligibility scenario, US$0.70 (95% CI 0.64, 0.76) billion under the WHO 2013 scenario, and US$0.72 (95% CI 0.66, 0.78) billion under the 90-90-90 scenario. Across all scenarios, 6-y laboratory testing costs are about 9% to 10% of total adult ART costs and between 11% and 12% of pediatric ART costs.
The majority of adult and pediatric ART resource requirements are for people living with HIV in Eastern and Southern Africa. Under the current eligibility scenario, US$28.9 (95% CI 28.5, 29.3) billion is needed from 2015 to 2020 for adult and pediatric ART in Eastern and Southern Africa (Figs 9 and 10). The Asia/Pacific region has the second-highest estimated ART resource requirements under this scenario, at US$6.3 (95% CI 6.2, 6.4) billion. Due to high ARV costs in Russia, the Eastern Europe and Central Asia region has the third highest total 6-y costs under the current eligibility scenario, $5.8 (95% CI 5.6, 5.9) billion. The Middle East and North Africa region requires the lowest resources for adult and pediatric ART across our three scenarios. The proportion of total costs by region changes over time. For adult treatment under the current eligibility scenario, the cost for treatment in Eastern and Southern Africa as a percentage of total global costs declines from 68% in 2015 to 59% by 2020, while the proportionate cost for treatment in Eastern Europe and Central Asia increases from 9% to 15% of total global adult ART costs, driven by Russia. While the cost of adult ART for Western and Central Africa in relation to total global ART costs remains relatively constant from 2015 to 2020, the cost of pediatric ART in the region increases from 8% to 16% of total global pediatric costs.


Financial Resources Available for ART
Based on our estimate of average annual funding levels, we project that the Global Fund will finance approximately US$0.4 billion of the annual ART commodity requirements for the countries eligible for Global Funding in our sample. This is in line with the Global Fund’s own estimates of support for commodities, which show that it expended US$0.47 billion on adult and pediatric ARVs in 2014 [97]. For the applicable countries in our study, total annual PEPFAR contributions to ARV and laboratory commodity procurement are estimated at US$0.46 billion, which may be an optimistic estimate [98]. Our estimate for annual PEPFAR contributions to personnel and overhead at the facility level as included in our analysis ranges from US$0.47 to US$0.65 billion per year globally based on fiscal year 2014 expenditures by country, which again may be optimistic, even given PEPFAR’s refocusing on this issue.
Estimated DCs vary by scenario. We estimated that countries will contribute US$6.2 billion in domestic resources to commodity procurement from 2015 to 2020 under all scenarios. Under the current eligibility scenario, DCs for facility-level personnel and overhead costs are estimated to increase from US$1.4 billion in 2015 to US$2.3 billion in 2020. DCs for these types of costs are estimated to increase from US$1.6 billion to US$2.6 billion under the WHO 2013 scenario and from US$1.5 billion to US$2.9 billion under the 90-90-90 scenario over the same time period.
Estimated funding available for ART varies greatly by region (Fig 11). Based on the current eligibility scenario and lower PEPFAR contributions to facility-level costs, we estimate that 70% of the external funding available for ART from 2015 to 2020 could go to countries in Eastern and Southern Africa. One-fifth of external funds during this period could support countries in Western and Central Africa. Under our optimistic assumptions, DCs could account for the majority of funding available for ART in Eastern and Southern Africa (68%), Asia and the Pacific (88%), Eastern Europe and Central Asia (96%), Latin America and the Caribbean (51%), and the Middle East and North Africa (80%). These values are ambitious, yet comparable with UNAIDS estimates [6]. The Western and Central Africa region is the only region that is estimated to be primarily funded by external sources (76%). DCs to ART costs in Eastern Europe and Central Asia are largely due to projected high DCs from Russia. South Africa is estimated to contribute US$7.8 billion for ART from 2015 to 2020 from domestic sources, representing 72% of the total domestic resources available for ART in the Eastern and Southern Africa region. Similarly, Nigeria’s potential contributions account for 32% of the total domestic resources available for ART in Western and Central Africa.

HIV Treatment Funding Gap
Under the current eligibility scenario and given conservative PEPFAR and optimistic DC assumptions, the funding gap for ART is estimated to increase from US$2.1 billion to US$4.6 billion per year from 2015 to 2020. The funding gap for ART commodities in the same time frame increases from US$1.3 billion to US$3.1 billion per year. The total ART funding gap spanning the 6-y period from 2015 to 2020 is projected to be US$20.6 billion. Under more expansive assumptions for PEPFAR contributions to facility-level overhead and personnel costs, the total 6-y ART gap would decrease slightly to US$19.8 billion. Under the WHO 2013 scenario, the total funding gap for ART ranges from US$21.6 to US$22.4 billion, depending on PEPFAR contributions, and the 6-y commodity gap is estimated to be US$15.2 billion. The funding gap over the same time period for the 90-90-90 scenario is estimated to be US$24.2 billion to US$25.0 billion, depending on PEPFAR contributions, and the estimated commodity gap is US$16.8 billion.
The overwhelming share (61%) of the funding gap for ART is in Eastern and Southern African countries under the current eligibility and lower PEPFAR contribution scenario. Approximately 16% of the total ART gap emerges in Eastern Europe and Central Asia. Western and Central Africa and Asia and the Pacific account for significant portions the total funding gap (11% each). Funding gaps in Latin America and the Caribbean and the Middle East and North Africa are relatively small, representing just over 1% of the total ART funding gap combined. UNAIDS estimates these regions will fund up to 90% of their overall HIV response, and studies indicate that UMICs are capable of meeting their HIV resource requirements entirely through domestic sources [6,15].
Fig 12 shows the percentage of total ART costs under the current eligibility scenario that is not financed for the entire 6-y period, by country, with conservative PEPFAR contribution assumptions. Of the 97 countries in our analysis, 45 are estimated to have a total ART funding gap that exceeds 50% of the total resource requirements under this scenario. We estimate that 11 countries will have over 75% of their resource requirements unmet from 2015 to 2020. These funding gaps are even greater under the WHO 2013 and 90-90-90 scenarios, assuming the same level of PEPFAR contributions.

Discussion
To our knowledge, this study is the first to incorporate an uncertainty analysis using recent country - and region-specific epidemiological, coverage, and unit cost data in projecting facility-level adult and pediatric ART resource requirements and funding gaps across multiple scenarios for the number of treatment-eligible people living with HIV. Our results indicate that the resources required for the global ART response may be less than previously estimated. However, financial resources mobilized for ART or technical efficiency will need to increase to meet the funding challenge. Even with optimistic assumptions about domestic source contributions, the financing gap is large.
Compared to other modeling studies, our study estimates that more people could be on ART in future years, given ambitious yet achievable coverage increases, if resources permit. A study assessing universal adoption of the 2013 WHO guidelines estimated that 28 million people could be on treatment in 2025; our results indicate that 28 (95% CI 27.5, 28.6) million adults and children could be on ART by 2020 under our WHO 2013 scenario, based on ambitious yet achievable coverage scale-up [8]. Our projections of the number of people eligible for treatment and coverage increases based on historical trends suggest that the 90-90-90 target of 81% of people living with HIV being on treatment by 2020 may not be met, even if all countries universally adopted aspects of the 2013 WHO guidelines beginning in 2014. To achieve the 90-90-90 target, UNAIDS estimated that US$35.6 billion would be needed for the entire HIV response in 2020, and care and treatment services have historically accounted for 55% of HIV spending globally [99]. However, our projections under the 90-90-90 scenario suggest that the facility-level costs of ART provision would amount to US$11.3 billion in 2020, less than what such historical trends suggest. Our results are comparable with other recent studies suggesting that the unit cost of providing ART services may be less than previously estimated [11,53].
In order to rapidly scale up ART coverage globally, other investments are needed. Primarily, investments are needed to scale up HIV testing. The 90-90-90 initiative calls for 90% of all people living with HIV to be diagnosed with HIV by 2020. While our study does not include all costs associated with scaling up HIV treatment, we estimated the financial resources required to diagnose the new patients on ART within each scenario. We calculated the number of new patients on treatment each year by region using the numbers of individuals on treatment in our model and adjusting for mortality in cohorts, and then applied region-specific incidence rates and HIV rapid test costs to forecast the number of people to be tested and the cost of testing (see S3 Text for additional details) [24,100]. We estimate that US$0.51 billion, US$0.55 billion, and US$0.73 billion is needed over the time period 2015 to 2020 for HIV testing under the current eligibility, WHO 2013, and 90-90-90 scenarios, respectively. In addition to investments in HIV diagnostics, the expected scale-up of ART coverage to ambitious levels will not occur in many countries with concentrated or mixed epidemics unless severe structural barriers related to ongoing levels of stigma and discrimination, as well as punitive policies targeting certain high-HIV-burden population groups, are removed [101–103].
Results from other studies indicate that investments in expanding eligibility for treatment and coverage are cost-effective. Stover et al. estimated that universal adoption of the 2013 WHO guidelines would avert 2.9 million deaths and 3.9 million new infections from 2013 to 2025, compared with implementation of the 2010 guidelines [8]. An analysis in four countries—India, South Africa, Zambia, and Viet Nam—found that expanding eligibility to individuals with CD4 count ≤ 500 cells/mm3 or to all people living with HIV is very cost-effective in all settings [104]. Vassall et al. estimated that expanding treatment eligibility to all people living with HIV in South Africa would decrease new HIV infections by 45% and save approximately US$10 billion over 40 y [14]. Expanding HIV treatment is particularly cost-effective compared with other interventions; the cost per quality-adjusted life year is between US$1,000 and US$2,000 for earlier ART initiation, compared with US$5,000 to US$25,000 for routine virological monitoring in eastern Africa [105].
Our estimates of the resource requirements for ART suggest that the financial sustainability of a scaled-up global ART response, where the scale-up itself is cost-effective, may be at risk without either additional resource mobilization or efficiency and effectiveness gains. We have already included ambitious domestic resource mobilization assumptions. However, improved technology and changes in service delivery models could reduce overall resource needs and, as a result, lessen the funding gap for HIV treatment.
There is evidence that the unit cost of ARV provision could decrease further than what we anticipated in this study. The introduction of new ARVs (such as the recently approved dolutegravir) that are less expensive to manufacture, are less toxic, and have a higher barrier to resistance than existing ARVs could be a “game changer” [106]. When we replaced the unit costs of adult first - and second-line regimens as used in our analysis with the average cost of these new regimens, the total cost of adult ART over the period 2015 to 2020 decreased by US$7.3 billion. This ARV price reduction would eliminate about half of our estimated 6-y commodity gap, which is projected to be US$14.0 billion under the current eligibility scenario (Table 6). Further, the development of long-acting injectable ARVs and once-daily regimens for HIV treatment may be possible in the near term, which could change how HIV treatment is currently administered and further lower the cost of treatment globally [107]. Dose optimization trials aiming to identify the smallest possible effective dose could lead to additional cost savings by reducing the number or frequency of pills each patient needs; one study found that a lower dose of EFV is effective and could reduce per-patient annual costs by US$16 [108]. Table 6 summarizes how some of these innovations could impact our cost and ART funding gap estimates from 2015 to 2020.

Decentralization and task-shifting from doctors to nurses could also lower the facility-level costs of managing HIV treatment without affecting health outcomes for patients [109,110]. Our analysis assumes that the unit cost of clinical personnel for ART, disaggregated by country income level, can be reduced from historical levels in 2015 via increased returns to scale with larger patient volumes. However, these costs may continue to decrease, and at a faster rate than we estimated, as more countries adopt task-shifting policies and improve service provision. These efficiency initiatives may require some short-term investments and could lead to long-term cost savings and improved health outcomes.
Despite opportunities for cost savings, the ART funding gap remains large. We estimate that approximately 43% to 48% of total facility-level resource requirements for ART from 2015 to 2020 will remain unfunded, depending on the cost scenario and assumed PEPFAR funding levels. This is despite the fact that our DC estimates are ambitious. As donors place greater emphasis on domestic financing for HIV treatment, particularly in middle-income countries, countries will need to mobilize additional resources to fill the funding gap. A recent analysis in 12 countries estimates that UMICs may have the capacity to fully fund their HIV programs from 2014 to 2018, although LICs and LMICs will still need significant donor support—even under a “maximum effort” scenario where (1) gross domestic product grows according to macroeconomic predictions, (2) countries increase health expenditure as per the Abuja target of 15% of gross domestic product, and (3) national budget allocations for HIV are 50% higher than HIV’s share of disease burden [15]. We included very ambitious domestic resource mobilization targets in our analysis based on the best available data on countries’ potential DCs to the HIV response. However, gaps still remain. Because of constrained resources for ART among external funders and among the governments of LICs and LMICs, efficiency gains through treatment optimization and the introduction of new low-cost regimens could be the most promising initiatives for reducing global ART costs and the funding gap.
Our study has several limitations. Our cost estimates exclude costs above the facility level, such as implementation of partner overhead and trainings, and costs of other services that may be integrated with ART provision, such as treatment of opportunistic infections, psychological counseling, or nutritional support. Additionally, the GPRM ARV prices are “ex works” prices that do not include the costs for in-country transportation or storage of ARVs, insurance, and taxes [34]. We are also limited by the availability and quality of country - and region-specific data. The epidemiological analysis in AIM assumes that country reports on the HIV epidemic and baseline numbers of people currently receiving treatment are accurate. Regional data were substituted for missing country-specific data when estimating coverage or the proportion of people receiving second-line treatment. We did not independently validate GPRM data on ARV prices with procurement agencies in countries or exclude any transactions in GPRM that could be potential outliers. However, an analysis of ARV prices using GPRM data found that the exclusion of outliers did not significantly impact the results [111]. Furthermore, not all HIV treatment formulations and regimens provided in countries were included in the cost analysis. Estimates of true country-specific DCs to commodity procurement and PEPFAR and Global Fund contributions to facility-level overhead and personnel are not reported to UNAIDS and hence are unavailable for most countries in our study. We assume PEPFAR and Global Fund contributions in the future will remain at current levels because of a lack of data on how these contributions will change. We estimated DCs for ART based on Global Fund CFTs and DCs to the entire HIV response. The DCs used in our analysis are ambitious and are not linked to an analysis of the future fiscal space for HIV financing in each country. We excluded any funding estimates that could not be disaggregated by country, such as regional ARV procurements. As a result, we could be underestimating the external financial resources available for ART.
Our analysis indicates that achieving the 90-90-90 treatment targets may be possible only through rapid expansions of ART eligibility to all people living with HIV as per the early-released WHO 2015 guidelines and increases in coverage; these targets are unlikely to be met under our current eligibility scenario or uniform application of aspects of the WHO 2013 guidelines. As the world moves to adopt the WHO 2015 guidelines, our analysis shows the need for increased financing for ART across both donors and governments [3,5]. While we have focused on additional funding needed for ART provision at the facility level, expanding ART eligibility and achieving the ambitious 90-90-90 targets globally will require overarching investments in the removal of policy barriers to scale-up, strong advocacy, necessary infrastructure and equipment, as well as other health-system-strengthening initiatives. Understanding these additional investments should be part of an urgent research agenda.
Supporting Information
Zdroje
1. World Health Organization. Guideline on when to start antiretroviral therapy and on pre-exposure prophylaxis for HIV. Geneva: World Health Organization; 2015.
2. World Health Organization. Consolidated guidelines on general HIV care and the use of antiretroviral drugs for treating and preventing HIV infection: recommendations for a public health approach. Geneva: World Health Organization; 2013.
3. Joint United Nations Programme on HIV/AIDS. Ambitious treatment targets: writing the final chapter on the AIDS epidemic. Geneva: Joint United Nations Programme on HIV/AIDS; 2014.
4. U.S. President’s Emergency Plan for AIDS Relief. The U.S. President’s Emergency Plan for AIDS Relief and Children’s Investment Fund Foundation launch $200 million Accelerating Children’s HIV/AIDS Treatment Initiative (ACT) to save lives. 6 August 2014. Available: http://www.pepfar.gov/press/releases/2014/230334.htm. Accessed 22 October 2015.
5. The Vancouver Consensus. From the International AIDS Society Conference, 2015. Available: http://vancouverconsensus.org/. Accessed 22 October 2015.
6. Joint United Nations Programme on HIV/AIDS. The gap report. Geneva: Joint United Nations Programme on HIV/AIDS; 2014.
7. AIDSinfo Online Database. Available: http://www.aidsinfoonline.org/devinfo/libraries/aspx/Home.aspx. Accessed 15 July 2015.
8. Stover J, Gopalappa C, Mahy M, Doherty MC, Easterbrook PJ, Weiler G, et al. The impact and cost of the 2013 WHO recommendations on eligibility for antiretroviral therapy. AIDS. 2014;28:S225–S230. doi: 10.1097/QAD.0000000000000235 24849482
9. Stover J, Korenromp EL, Blakley M, Komatsu R, Viisainen K, Bollinger L, et al. Long-term costs and health impact of continued global fund support for antiretroviral therapy. PLoS ONE. 2011;6:e21048. doi: 10.1371/journal.pone.0021048 21731646
10. Schwartländer B, Stover J, Hallett T, Atun R, Avila C, Gouws E, et al. Towards an improved investment approach for an effective response to HIV/AIDS. Lancet. 2011;377 : 2031–2041. doi: 10.1016/S0140-6736(11)60702-2 21641026
11. Joint United Nations Programme on HIV/AIDS. Fast-track: ending the AIDS epidemic by 2030. Geneva: Joint United Nations Programme on HIV/AIDS; 2014.
12. Global Fund to Fight AIDS, Tuberculosis and Malaria. Fourth replenishment (2014–2016): needs assessment. Geneva: Global Fund to Fight AIDS, Tuberculosis and Malaria; 2013.
13. Wafula F, Agweyu A, Macintyre K. Trends in procurement costs for HIV commodities: a 7-year retrospective analysis of global fund data across 125 countries. J Acquir Immune Defic Syndr. 2014;65:e134–e139. doi: 10.1097/QAI.0000000000000053 24189152
14. Vassall A, Remme M, Watts C, Hallett T, Siapka M, Vickerman P, et al. Financing essential HIV services: a new economic agenda. PLoS Med. 2013;10:e1001567. doi: 10.1371/journal.pmed.1001567 24358028
15. Doherty K, Essajee S, Penazzato M, Holmes C, Resch S, Ciaranello A. Estimating age-based antiretroviral therapy costs for HIV-infected children in resource-limited settings based on World Health Organization weight-based dosing recommendations. BMC Health Serv Res. 2014;14 : 201. doi: 10.1186/1472-6963-14-201 24885453
16. Joint United Nations Programme on HIV/AIDS. Spectrum/EPP. Geneva: Joint United Nations Programme on HIV/AIDS. Available: http://www.unaids.org/en/dataanalysis/datatools/spectrumepp2013. Accessed 22 October 2015.
17. World Health Organization. Consolidated strategic information guidelines for HIV in the health sector. Geneva: World Health Organization; 2015.
18. Curry LA, Byam P, Linnander E, Andersson KM, Abebe Y, Zerihun A, et al. Evaluation of the Ethiopian Millennium Rural Initiative: impact on mortality and cost-effectiveness. PLoS ONE. 2013;8:e79847. doi: 10.1371/journal.pone.0079847 24260307
19. Pandey A, Sahu D, Bakkali T, Reddy D, Venkatesh S, Kant S, et al. Estimate of HIV prevalence and number of people living with HIV in India 2008–2009. BMJ Open. 2012;2:e000926. doi: 10.1136/bmjopen-2012-000926 23028110
20. Bashorun A, Nguku P, Kawu I, Ngige E, Ogundiran A, Sabitu K, et al. A description of HIV prevalence trends in Nigeria from 2001 to 2010: what is the progress, where is the problem? Pan Afr Med J. 2014;18 (Suppl 1):3. doi: 10.11694/pamj.supp.2014.18.1.4608 25328622
21. Stover J, Brown T, Marston M. Updates to the Spectrum/Estimation and Projection Package (EPP) model to estimate HIV trends for adults and children. Sex Transm Infect. 2012;88 (Suppl 2):i11–i16. doi: 10.1136/sextrans-2012-050640 23172341
22. Yiannoutsos CT, Johnson LF, Boulle A, Musick BS, Gsponer T, Balestre E, et al. Estimated mortality of adult HIV-infected patients starting treatment with combination antiretroviral therapy. Sex Transm Infect. 2012;88 (Suppl 2):i33–i43. doi: 10.1136/sextrans-2012-050658 23172344
23. Structured Data. RiskAMP version 4.72 professional edition [computer program]. San Francisco: Stuctured Data; 2015.
24. Joint United Nations Programme on HIV/AIDS. AIDSinfo Online Database [database]. Geneva: Joint United Nations Programme on HIV/AIDS. Available: http://www.aidsinfoonline.org/devinfo/libraries/aspx/Home.aspx. Accessed 15 July 2015.
25. Shafer R. Rationale and uses of a public HIV drug-resistance database. J Infect Dis. 2006;194:S51–S58. 16921473
26. World Health Organization. Antiretroviral medicines in low - and middle-income countries: forecasts of global and regional demand for 2013–2016. Geneva: World Health Organization; 2014.
27. Hong SY, Jonas A, Dumeni E, Badi A, Pereko D, Blom A, et al. Population-based monitoring of HIV drug resistance in Namibia with early warning indicators. J Acquir Immune Defic Syndr. 2010;55 : 27. doi: 10.1097/QAI.0b013e3181f5376d 20838224
28. Scott CA, Iyer HS, McCoy K, Moyo C, Long L, Larson BA, et al. Retention in care, resource utilization, and costs for adults receiving antiretroviral therapy in Zambia: a retrospective cohort study. BMC Public Health. 2014;14 : 296. doi: 10.1186/1471-2458-14-296 24684772
29. Assefa Y, Kiflie A, Tesfaye D, Mariam DH, Kloos H, Edwin W, et al. Outcomes of antiretroviral treatment program in Ethiopia: retention of patients in care is a major challenge and varies across health facilities. BMC Health Serv Res. 2011;11 : 81. doi: 10.1186/1472-6963-11-81 21501509
30. Gupta RK, Jordan MR, Sultan BJ, Hill A, Davis DHJ, Gregson J, et al. Global trends in antiretroviral resistance in treatment-naive individuals with HIV after rollout of antiretroviral treatment in resource-limited settings: a global collaborative study and meta-regression analysis. Lancet. 2012;380 : 1250–1258. doi: 10.1016/S0140-6736(12)61038-1 22828485
31. Fox MP, Van Cutsem G, Giddy J, Maskew M, Keiser O, Prozesky H, et al. Rates and predictors of failure of first-line antiretroviral therapy and switch to second-line ART in South Africa. J Acquir Immune Defic Syndr. 2012;60 : 428. doi: 10.1097/QAI.0b013e3182557785 22433846
32. Auld AF, Mbofana F, Shiraishi RW, Sanchez M, Alfredo C, Nelson LJ, et al. Four-year treatment outcomes of adult patients enrolled in Mozambique’s rapidly expanding antiretroviral therapy program. PLoS ONE. 2011;6:e18453. doi: 10.1371/journal.pone.0018453 21483703
33. Clinton Health Access Initiative. The state of the antiretroviral drug market in low - and middle-income countries: ARV market report. Boston: Clinton Health Access Initiative; 2013.
34. World Health Organization. Transaction prices for antiretroviral medicines from 2010 to 2013: Global Price Reporting Mechanism. Geneva: World Health Organization; 2013.
35. Perriëns JH, Habiyambere V, Dongmo-Nguimfack B, Hirnschall G. Prices paid for adult and paediatric antiretroviral treatment by low-and middle-income countries in 2012: high, low or just right? Antivir Ther. 2014;19 : 39–47. doi: 10.3851/IMP2899 25310645
36. Médecins Sans Frontières. Untangling the web of antiretroviral price reductions, 17th edition. Geneva: Médecins Sans Frontières; 2014.
37. Nachega JB, Mugavero MJ, Zeier M, Vitória M, Gallant JE. Treatment simplification in HIV-infected adults as a strategy to prevent toxicity, improve adherence, quality of life and decrease healthcare costs. Patient Prefer Adherence. 2011;5 : 357–367. doi: 10.2147/PPA.S22771 21845035
38. Nakakeeto ON, Elliott BV. Antiretrovirals for low income countries: an analysis of the commercial viability of a highly competitive market. Global Health. 2013;9 : 6. doi: 10.1186/1744-8603-9-6 23410145
39. Clinton Health Access Initiative. 2014 antiretroviral (ARV) ceiling price list. Boston: Clinton Health Access Initiative; 2014.
40. Godlevskiy D, Volgina A, Golovin S, Girchenko P, Skvortsov A. To treat or not to treat? ARV treatment procurement and provision in Russia. Saint Petersburg: ITPCru; 2012.
41. Meyer-Rath G, Brennan A, Long L, Ndibongo B, Technau K, Moultrie H, et al. Cost and outcomes of paediatric antiretroviral treatment in South Africa. AIDS. 2013;27 : 243–250. doi: 10.1097/QAD.0b013e32835a5b92 23014517
42. Dutta A, Perales N, Semeryk O, Balakireva O, Aleksandrina T, Leshchenko O, et al. Lives on the line: funding needs and impacts of Ukraine’s national HIV/AIDS program, 2014–2018. Washington (District of Columbia): Palladium; 2014.
43. Dutta A, Perales N, Silva R, Cirera i Criville L. Estimated resource needs and impact of Mozambique’s Plano Estrategico do Sector Saude, 2014–2019. Washington (District of Columbia): Palladium; 2014.
44. Perales N, Dutta A, Maina T. Resource needs for the Kenya health sector strategic and investment plan: analysis using the OneHealth Tool. Washington (District of Columbia): Palladium; 2015.
45. Médecins Sans Frontières. How low can we go? Pricing for HIV viral load testing in low - and middle-income countries. Geneva: Médecins Sans Frontières; 2013.
46. Kahn JG, Marseille E, Moore D, Bunnell R, Were W, Degerman R, et al. CD4 cell count and viral load monitoring in patients undergoing antiretroviral therapy in Uganda: cost effectiveness study. BMJ. 2011;343:d6884. doi: 10.1136/bmj.d6884 22074713
47. World Health Organization. Technical and operational considerations for implementing HIV viral load testing. Geneva: World Health Organization; 2014.
48. UNITAID. HIV/AIDS diagnostics technology landscape. 4th edition. Vernier (Switzerland): UNITAID; 2014.
49. Roche. Roche launches Global Access Program for HIV viral load testing. 26 September 2014. Basel: Roche.
50. Clinton Health Access Initiative. Annual report 2014. Boston: Clinton Health Access Initiative; 2013.
51. Wu G, Zaman MH. Low-cost tools for diagnosing and monitoring HIV infection in low-resource settings. Bull World Health Organ. 2012;90 : 914–920. doi: 10.2471/BLT.12.102780 23284197
52. Setty MKHG Hewlett IK. Point of care technologies for HIV. AIDS Res Treat. 2014;2014 : 497046. doi: 10.1155/2014/497046 24579041
53. Tagar E, Sundaram M, Condliffe K, Matatiyo B, Chimbwandira F, Chilima B, et al. Multi-Country Analysis of Treatment Costs for HIV/AIDS (MATCH): facility-level ART unit cost analysis in Ethiopia, Malawi, Rwanda, South Africa and Zambia. PLoS ONE. 2014;9:e108304. doi: 10.1371/journal.pone.0108304 25389777
54. Galárraga O, Wirtz V, Figueroa-Lara A, Santa-Ana-Tellez Y, Coulibaly I, Viisainen K, et al. Unit costs for delivery of antiretroviral treatment and prevention of mother-to-child transmission of HIV. Pharmacoeconomics. 2011;29 : 579–599. doi: 10.2165/11586120-000000000-00000 21671687
55. Riviere C, Faust E, Miller T, Beck EJ, Baruwa E, Severe P, et al. Superior outcomes and lower outpatient costs with scale-up of antiretroviral therapy at the GHESKIO Clinic in Port-au-Prince, Haiti. J Acquir Immune Defic Syndr. 2014;66:e72–e79. doi: 10.1097/QAI.0000000000000200 24984189
56. Health Policy Project, Côte d’Ivoire Ministry of Health. Estimating the cost of HIV treatment for adults, children, and pregnant women in Cote d’Ivoire. Washington (District of Columbia): Futures Group; 2015.
57. Moreland S, Namisango E, Paxton A, Powell RA. The costs of HIV treatment, care, and support services in Uganda. Available: http://www.cpc.unc.edu/measure/publications/tr-13-94. Chapel Hill (North Carolina): MEASURE Evaluation; 2013.
58. Marseille E, Giganti MJ, Mwango A, Chisembele-Taylor A, Mulenga L, Over M, et al. Taking ART to scale: determinants of the cost and cost-effectiveness of antiretroviral therapy in 45 clinical sites in Zambia. PLoS ONE. 2012;7:e51993. doi: 10.1371/journal.pone.0051993 23284843
59. Scott CA, Iyer H, Bwalya DL, McCoy K, Meyer-Rath G, Moyo C, et al. Retention in care and outpatient costs for children receiving antiretroviral therapy in Zambia: a retrospective cohort analysis. PLoS ONE. 2013;8:e67910. doi: 10.1371/journal.pone.0067910 23840788
60. Larson BA, Bii M, Henly-Thomas S, McCoy K, Sawe F, Shaffer D, et al. ART treatment costs and retention in care in Kenya: a cohort study in three rural outpatient clinics. J Int AIDS Soc. 2013;16 : 18026. doi: 10.7448/IAS.16.1.18026 23305696
61. Aliyu HB, Chuku NN, Kola-Jebutu A, Abubakar Z, Torpey K, Chabikuli ON. What is the cost of providing outpatient HIV counseling and testing and antiretroviral therapy services in selected public health facilities in Nigeria? J Acquir Immune Defic Syndr. 2012;61 : 221–225. 22820805
62. Obure CD, Sweeney S, Darsamo V, Michaels-Igbokwe C, Guinness L, Terris-Prestholt F, et al. The Costs of delivering integrated HIV and sexual reproductive health services in limited resource settings. PLoS ONE. 2015;10:e0124476. doi: 10.1371/journal.pone.0124476 25933414
63. Duong AT, Kato M, Bales S, Do NT, Minh Nguyen TT, Thanh Cao TT, et al. Costing analysis of national HIV treatment and care program in Vietnam. J Acquir Immune Defic Syndr. 2014;65:e1–e7. doi: 10.1097/QAI.0b013e3182a17d15 23846564
64. Meyer-Rath G. National ART cost model, South Africa. Johannesburg: Health Economics and Epidemiology Research Office; 2015.
65. Meyer-Rath G, Over M. HIV treatment as prevention: modelling the cost of antiretroviral treatment—state of the art and future directions. PLoS Med. 2012;9:e1001247. doi: 10.1371/journal.pmed.1001247 22802731
66. Callahan K, Gunda A, Phanitsiri S, Kaur M, Mgomezulu L, Tagar E, et al. Analysis of the change in facility-level ART unit costs after implementation of the new WHO treatment guidelines in Malawi [abstract]. 8th IAS Conference on HIV Pathogenesis, Treatment and Prevention; 19–22 Jul 2015; Vancouver, Canada.
67. World Health Organization. Antiretroviral therapy for HIV infection in adults and adolescents: recommendations for a public health approach. Geneva: World Health Organization; 2010.
68. World Health Organization. Antiretroviral therapy for HIV infection in infants and children: towards universal access. Geneva: World Health Organization; 2010.
69. World Health Organization. Antiretroviral drugs for treating pregnant women and preventing HIV infection in infants: recommendations for a public health approach. Geneva: World Health Organization; 2010.
70. World Health Organization. Global update on HIV treatment 2013: results, impact and opportunities. Geneva: World Health Organization; 2013.
71. Nguyen LT, Tran BX, Tran CT, Le HT, Van Tran S. The cost of antiretroviral treatment service for patients with HIV/AIDS in a central outpatient clinic in Vietnam. Clinicoecon Outcomes Res. 2014;6 : 101–108. doi: 10.2147/CEOR.S57028 24591843
72. Diabaté S, Zannou DM, Geraldo N, Chamberland A, Akakpo J, Ahouada C, et al. Antiretroviral therapy among HIV-1 infected female sex workers in Benin: a comparative study with patients from the general population. World J AIDS. 2011;1 : 94.
73. Menzies NA, Berruti AA, Blandford JM. The determinants of HIV treatment costs in resource limited settings. PLoS ONE. 2012;7:e48726. doi: 10.1371/journal.pone.0048726 23144946
74. U.S. President’s Emergency Plan for AIDS Relief. 2014 report on costs of treatment in the President’s Emergency Plan for AIDS Relief. Washington ((District of Columbia): U.S. President’s Emergency Plan for AIDS Relief; 2014.
75. Simmons B, Hill A, Ford N, Ruxrungtham K, Ananworanich J. Prices of second-line antiretroviral treatment for middle-income countries inside versus outside sub-Saharan Africa. J Int AIDS Soc. 2014;17 (Suppl 3):19604.
76. International Monetary Fund. IMF eLibrary data: gross domestic product, deflator, index [database]. Available: http://elibrary-data.imf.org/FindDataReports.aspx?d=33061&e=169393. Accessed 22 October 2015.
77. Global Fund to Fight AIDS, Tuberculosis and Malaria. Price and Quality Reporting [database]. Geneva: Global Fund to Fight AIDS, Tuberculosis and Malaria; 2015.
78. Global Fund to Fight AIDS, Tuberculosis and Malaria. Report of the Secretariat’s Grant Approvals Committee: GF/B33/ER03 Board Decision. Geneva: Global Fund to Fight AIDS, Tuberculosis and Malaria; 2015.
79. Birx, DL. PEPFAR 3.0 overview: right things in the right places, right now for epidemic control and an AIDS-free generation. PEPFAR Scientific Advisory Board (SAB) Introductory Teleconference. 30 April 2015. Available: http://www.pepfar.gov/documents/organization/244554.pdf. Accessed 28 October 2015.
80. Unidad Nacional de Gestión de Medicamentos e Insumos. Reevaluation of the HIV financing gap in the framework of SUGEMI planning for 2013. Santo Domingo (Dominican Republic): Unidad Nacional de Gestión de Medicamentos e Insumos; 2013.
81. International Council of AIDS Service Organizations, Global Forum on MSM and HIV. Punishing success? Explanation of band 4 of the Global Fund to Fight AIDS, Tuberculosis and Malaria and its implications for civil society and key populations. Toronto: International Council of AIDS Service Organizations; 2014.
82. Abdullaev T, Konstantinov B, Hamelmann C. Legal and regulatory frameworks for antiretroviral medicines and treatment in selected countries of the Commonwealth of Independent States: a sub-regional analytical report including Belarus, Kazakhstan, Russia, Tajikistan, and Uzbekistan. New York: United Nations Development Programme; 2014.
83. Barbada Carasso K, Chee G, Cico A, Quyen DH, Cam Tu P, Sitruk A. Options for integrating procurement and supply chain systems for ARVs, methadone, and anti-tuberculosis drugs in Vietnam. Bethesda (Maryland): Health Finance and Governance Project; 2014.
84. Bekker L-G, Venter F, Cohen K, Goemare E, Van Cutsem G, Boulle A, et al. Provision of antiretroviral therapy in South Africa: the nuts and bolts. Antivir Ther. 2014;19 (Suppl 3):105–116. doi: 10.3851/IMP2905 25310359
85. Ripin DJ, Jamieson D, Meyers A, Warty U, Dain M, Khamsi C. Antiretroviral procurement and supply chain management. Antivir Ther. 2014;19 : 79–89. doi: 10.3851/IMP2903 25310145
86. Sennamose O. Government spends P1.3 billion on ARVs. Botswana Daily News. 29 Aug 2013.
87. The Jakarta Post. Govt urged to drop plan on ARV budget cut. The Jakarta Post. 22 May 2014.
88. Tjitemisa K. MOHSS awards multi-million tenders. New Era. 8 Aug 2014.
89. South African Press Association. Health Department awards R10 billion ARV tender. Times Live. 24 December 2014.
90. Hunger J, Derrick D, Korah G. Increasing domestic investment [presentation]. Geneva: Global Fund to Fight AIDS, Tuberculosis and Malaria; 2014.
91. Hastuti EB. ARV programs in Indonesia: advantages, challenges and the way forward [abstract]. 7th IAS Conference on HIV Pathogenesis, Treatment and Prevention; 30 Jun–3 Jul 2013; Kuala Lumpur, Malaysia.
92. Ngadiman SB. Financing ARV—experience from Malaysia [abstract]. 7th IAS Conference on HIV Pathogenesis, Treatment and Prevention; 30 Jun–3 Jul 2013; Kuala Lumpur, Malaysia.
93. Bhakeecheep D. ART program management under universal health coverage [abstract]. 7th IAS Conference on HIV Pathogenesis, Treatment and Prevention; 30 Jun–3 Jul 2013; Kuala Lumpur, Malaysia.
94. Health Policy Project. Health Policy Project helps generate US$30 million for strategic health commodities including ARVs in Kenya. Washington (District of Columbia): Palladium; 2015.
95. Instituto Nacional de Luta Contra a SIDA. Plano de acção 2015 revisto. Luanda (Angola): Instituto Nacional de Luta Contra a SIDA; 2015.
96. RITES. Tenders: World Bank tenders—supply tenders. Gurgaon (India): RITES. Available: http://new.rites.com/index.php?page=page&id=65&name=Supply%20Tenders%20&mid=73. Accessed 11 May 2015.
97. Lin RL, Auton M, editors. The Global Fund: ARV acquisition strategy [presentation]. The Global Fund–PEPFAR ARV Supplier Conference; 24–25 Jun 2014; Dubai. Available: http://www.google.com/url?sa=t&rct=j&q=&esrc=s&source=web&cd=1&cad=rja&uact=8&ved=0CB0QFjAAahUKEwjno9ugjeXIAhUBdx4KHTlyCW8&url=http%3A%2F%2Fwww.theglobalfund.org%2Fdocuments%2Fp4i%2Fevents%2FP4I_2014-06-25-GF-PEPFAR-ARV-Supplier-Conference-Introduction_Presentation_en%2F&usg=AFQjCNGgSBAtzSWYFnERpQ4cWGSLLb1Kpw&sig2=BoOmkSxbd14Z4g2DsaI1Sg. Accessed 28 October 2015.
98. Kavanagh M, Thorp M. PEPFAR’s declining investment in HIVAIDS treatment. Available: http://healthaffairs.org/blog/2011/11/29/pepfars-declining-investment-in-hivaids-treatment/. Health Affairs Blog. 29 November 2011.
99. Joint United Nations Programme on HIV/AIDS. Global AIDS response progress reporting 2013: construction of core indicators for monitoring the 2011 UN Political Declaration on HIV/AIDS. Geneva: Joint United Nations Programme on HIV/AIDS; 2013.
100. World Health Organization. Database on procurement of HIV and hepatitis products. Geneva: World Health Organization. Available: http://www.who.int/hiv/pub/amds/hiv-hep-procurement-database/en/. Accessed 29 May 2015.
101. Beyrer C, Sullivan PS, Sanchez J, Dowdy D, Altman D, Trapence G, et al. A call to action for comprehensive HIV services for men who have sex with men. Lancet. 2012;380 : 424–438. doi: 10.1016/S0140-6736(12)61022-8 22819663
102. Beyrer C, Malinowska-Sempruch K, Kamarulzaman A, Kazatchkine M, Sidibe M, Strathdee SA. Time to act: a call for comprehensive responses to HIV in people who use drugs. Lancet. 2010;376 : 551–563. doi: 10.1016/S0140-6736(10)60928-2 20650515
103. Kerrigan D, Wirtz A, Baral S, Stanciole A, Butler J, Oelrichs R, et al. The global HIV epidemics among sex workers. Washington (District of Columbia): The World Bank; 2012.
104. Eaton JW, Menzies NA, Stover J, Cambiano V, Chindelevitch L, Cori A, et al. How should HIV programmes respond to evidence for the benefits of earlier treatment initiation? A combined analysis of twelve mathematical models. Geneva: World Health Organization; 2013.
105. Braithwaite RS, Nucifora KA, Toohey C, Kessler J, Uhler LM, Mentor SM, et al. How do different eligibility guidelines for antiretroviral therapy affect the cost-effectiveness of routine viral load testing in sub-Saharan Africa? AIDS. 2014;28:S73–S83. doi: 10.1097/QAD.0000000000000110 24468949
106. Barnhart M, Shelton JD. ARVs: the next generation. Going boldly together to new frontiers of HIV treatment. Glob Health Sci Pract. 2015;3 : 1–11. doi: 10.9745/GHSP-D-14-00243 25745115
107. Spreen WR, Margolis DA, Pottage JC. Long-acting injectable antiretrovirals for HIV treatment and prevention. Current Opin HIV AIDS. 2013;8 : 565–571. doi: 10.1097/COH.0000000000000002 24100877
108. Heger M. Trials challenging HIV drug doses could usher in huge cost cuts. Nat Med. 2013;19 : 953. doi: 10.1038/nm0813-953 23921730
109. Mdege ND, Chindove S, Ali S. The effectiveness and cost implications of task-shifting in the delivery of antiretroviral therapy to HIV-infected patients: a systematic review. Health Policy Plan. 2012;28 : 223–236. doi: 10.1093/heapol/czs058 22738755
110. Callaghan M, Ford N, Schneider H. A systematic review of task-shifting for HIV treatment and care in Africa. Hum Resour Health. 2010;8 : 8–16. doi: 10.1186/1478-4491-8-8 20356363
111. Waning B, Kaplan W, King AC, Lawrence DA, Leufkens HG, Fox MP. Global strategies to reduce the price of antiretroviral medicines: evidence from transactional databases. Bull World Health Organ. 2009;87 : 520–528. 19649366
Štítky
Interní lékařstvíČlánek vyšel v časopise
PLOS Medicine
2015 Číslo 11
- Alternativní léčebné možnosti u hypercholesterolemie při intoleranci statinů
- Vliv kombinace nutraceutik na remodelaci levé komory srdeční u osob s metabolickým syndromem
- Nutraceutika a jejich ovlivnění mírného kardiometabolického rizika
- Princip účinku medu v léčbě chronických i infikovaných ran
- Superoxidovaný roztok a jeho využití v léčbě ran
Nejčtenější v tomto čísle
- Venous Thrombosis Risk after Cast Immobilization of the Lower Extremity: Derivation and Validation of a Clinical Prediction Score, L-TRiP(cast), in Three Population-Based Case–Control Studies
- The First Use of the Global Oral Cholera Vaccine Emergency Stockpile: Lessons from South Sudan
- The HIV Treatment Gap: Estimates of the Financial Resources Needed versus Available for Scale-Up of Antiretroviral Therapy in 97 Countries from 2015 to 2020
- Selection of an HLA-C*03:04-Restricted HIV-1 p24 Gag Sequence Variant Is Associated with Viral Escape from KIR2DL3+ Natural Killer Cells: Data from an Observational Cohort in South Africa