
Glycemic Control and the Risk of Tuberculosis: A Cohort Study
Hsien-Ho Lin and colleagues investigate the association between glycemic control and risk of tuberculosis in a cohort from northern Taiwan.
Published in the journal:
. PLoS Med 13(8): e32767. doi:10.1371/journal.pmed.1002072
Category:
Research Article
doi:
https://doi.org/10.1371/journal.pmed.1002072
Summary
Hsien-Ho Lin and colleagues investigate the association between glycemic control and risk of tuberculosis in a cohort from northern Taiwan.
Introduction
In its post-2015 End TB Strategy, the World Health Organization considers diabetes mellitus (DM) an important risk factor and comorbidity to be addressed in several components of tuberculosis (TB) control [1]. Recent studies suggested that DM increased the risk of active TB and was associated with higher risks of TB treatment failure, relapse after treatment completion, and mortality [2,3]. It was also noted that the greater risk of TB in patients with diabetes varied substantially across studies [2]. Meanwhile, the prevalence of DM has been rising in most low - and middle-income countries [4]. The looming co-epidemic of DM and TB could therefore undermine TB control in these countries [5]. There is an urgent need for solutions and actions to reduce the impact of DM on TB and to prevent the colliding epidemics.
Despite the well-documented association between DM and TB risk, it remains unclear whether improving glycemic control in DM patients could modify this risk. Previous studies suggested that good glycemic control was associated with better clinical outcome in common infections and decreased the risk of infectious complications from surgery [6,7]. However, evidence on the association between glycemic control and TB risk has been limited and inconsistent. While some studies suggested that good glycemic control was associated with a lower risk of TB, others did not find such an association [8–11]. In a recent modeling study of 13 countries with high TB burden, model outcomes suggested that prevention of DM would accelerate the decline of TB incidence and mortality, averting millions of TB cases and TB deaths in the next two decades [12]. It follows that glycemic control in DM patients may also be an important strategy for global TB control. We hypothesized that adequate management of blood glucose would reduce the risk of TB among diabetic patients; therefore, we conducted a cohort study to investigate the association between glycemic control in DM patients and the risk of active TB disease.
Methods
Settings and Study Population
We enrolled individuals participating in a community-based multiple screening service in New Taipei City from 5 March 2005 to 27 July 2008. The service provided free screening for chronic diseases and common cancers to adults ≥ 30 y old. The screening included a questionnaire about demographic and lifestyle information, a physical examination, and blood and urine tests. Of the 127,085 people who participated in the screening service, 124,455 provided written consent to be enrolled in the study. After excluding those with a previous history of TB and those with a diagnosis of TB within the first 28 d of follow-up (n = 909), 123,546 were included in the analysis. In order to obtain detailed information on DM and TB for each individual, we used patients’ unique national identification numbers to cross-match the screening service database to the national health insurance database and the vital registry. The participants were followed up until the occurrence of TB, death, or 31 December 2012, whichever came first.
Measurement of Diabetes and Glycemic Control
DM status and glycemic control were defined using information from the screening service (fasting plasma glucose [FPG]) and the national health insurance database. DM was defined by the prescription of a hypoglycemic drug for ≥28 d within 2 y before the date of screening or FPG ≥ 126 mg/dl at screening [13]. The hypoglycemic agents included sulfonylureas, biguanides, alpha-glucosidase inhibitors, thiazolidinediones, meglitinides, and insulin. We divided DM status into three groups based on the recommendation of the American Diabetes Association: (i) no DM; (ii) DM with good glycemic control: FPG ≤ 130 mg/dl; and (iii) DM with poor glycemic control: FPG >130 mg/dl [14]. We also determined whether the diabetic patients had DM-related complications at baseline using the national health insurance database [15].
Ascertainment of Tuberculosis
We identified incident TB disease from the national health insurance database. In Taiwan, TB care is provided for free, and the reimbursement is done through the national health insurance system, which has a coverage rate of over 99% nationwide [16]. We defined TB as ICD-9-CM code 010–018 in the patient’s medical record plus prescription of anti-TB treatment for ≥90 d (including inpatient and outpatient services). The 90-d cutoff was used because the turnaround time for mycobacterial culture examination might be longer than 2 mo. A previous validation study was conducted using confirmed cases in the National TB Registry as the gold standard. The case definition based on ICD-9 code and prescription record was found to have a sensitivity of 87% and a specificity of nearly 100% [17].
Measurement of Other Covariates
We collected information of other covariates that are known risk factors for TB. Information on demographic and lifestyle factors was obtained from the questionnaire of the health screening service. End-stage renal disease (ESRD) was defined by estimated glomerular filtration rate < 15 ml/min (calculated from the MDRD equation). We also identified malignancy (ICD-9-CM code 140–208), pneumoconiosis (ICD-9-CM code 500–503, 505), and use of systematic steroids (prescription of steroid for ≥30 d) in the previous 2 y before screening. Lastly, because diabetic patients may be more likely to attend clinics and therefore be exposed to TB patients, we used the national health insurance database to determine the frequency of outpatient visits in the year after screening as a proxy of health service utilization.
Statistical Analysis
We computed the incidence rate of TB in all participants and by DM status. We used Kaplan-Meier curves to compare the time to incident TB among the different DM groups. The survival curves were adjusted for age by reweighting the data within each DM group using the age distribution (by 5-y span) of the study population [18,19]. A Cox proportional hazards regression model was used to estimate the adjusted hazard ratio (aHR) and corresponding 95% CI for diabetic patients with poor glycemic control and those with good glycemic control, using the nondiabetic population as the reference. We adjusted for other demographic and clinical risk factors for incident TB, including age, sex, body mass index (BMI), level of education, marital status, smoking status, alcohol use, betel nut use (as a proxy measurement of socioeconomic status) [20], ESRD, malignancy, pneumoconiosis, steroid use, and frequency of outpatient visits. Because BMI was strongly associated with both DM and TB, we adjusted for BMI categorically (<18.5, ≥18.5 to <25.0, ≥25.0 to < 30.0, ≥30.0) and continuously in two different models [21]. We examined the dose-response relationship between FPG and risk of TB both linearly and nonlinearly in the Cox regression model. The potential nonlinear relationship was investigated using penalized spline regression (with three degrees of freedom), and the test for nonlinearity was done using the likelihood ratio test [22].
We conducted subgroup analyses to explore whether the association between DM status and incident TB might be modified by the following factors: (i) age (<65, ≥65 y), (ii) sex, and (iii) BMI (<25, ≥25 kg/m2). To estimate the aHRs of DM status among different subgroups, we added cross-product terms to the multivariable Cox regression model, adjusting for all other covariates. We compared models with and without the cross-product terms using the likelihood ratio test to test for effect modification.
In all, 5.4% (6,643 out of 123,546) of participants had missing data for at least one of the covariates in the analysis (Table 1). A comparison of those with and without missing information showed similar basic characteristics in the two groups (S1 Table). Under the assumption of missing at random, we used multiple imputation to impute missing data using the chained equations approach, with five imputed datasets and 20 burn-in iterations [23]. For each covariate with missing information, we used all the other covariates in the analysis (Table 1) as the predictors to impute missing values. For continuous variables we set the lower and upper bounds of imputed values using the minimal and maximal values in the observed data. The distributions of observed and imputed values did not differ substantially for all imputed covariates (S2 Table). All regression analyses were conducted in each imputed dataset; results from all imputed datasets were combined using the standard rules from Rubin [24]. The only exception was the dose-response analysis of FPG and TB, where complete case analysis was used (because the nonlinear dose-response analysis cannot be conducted using multiple imputation). We used the procedures PROC MI and PROC MI ANALYZE in SAS 9.4 (SAS Institute) for multiple imputation.

Lastly, we estimated the population attributable fraction (PAF) of TB due to poor glycemic control using the following formula:

All analyses were conducted using SAS software version 9.4 (SAS Institute) and R software version 3.1.2 (R Project). The original prospective analysis plan from the institutional review board submission is available (S1 and S2 Texts). The main analysis in the present report (glycemic control and hazard of active TB) was consistent with the prospective analysis plan. The dose-response analysis and the subgroup analyses were formulated at the data analysis stage.
This study was approved by the ethics committee of the Taiwan National Health Research Institutes (IRB No. EC1011004-E). Written consent was obtained from each participant during enrollment.
Results
Of the 123,546 participants, 1,504 (1.2%) had unknown DM status because of missing FPG information. In the 122,042 participants with FPG information, 11,260 (9.2%) had DM at baseline, and 8,015 of those with DM (71.2%) had poor glycemic control (FPG > 130 mg/dl) (Table 1). At baseline, compared with nondiabetic individuals, those with DM were older and more likely to be male, had higher BMI, and had a lower level of education. Among diabetic patients, the difference in baseline characteristics between those with good and poor glycemic control was small (Table 1).
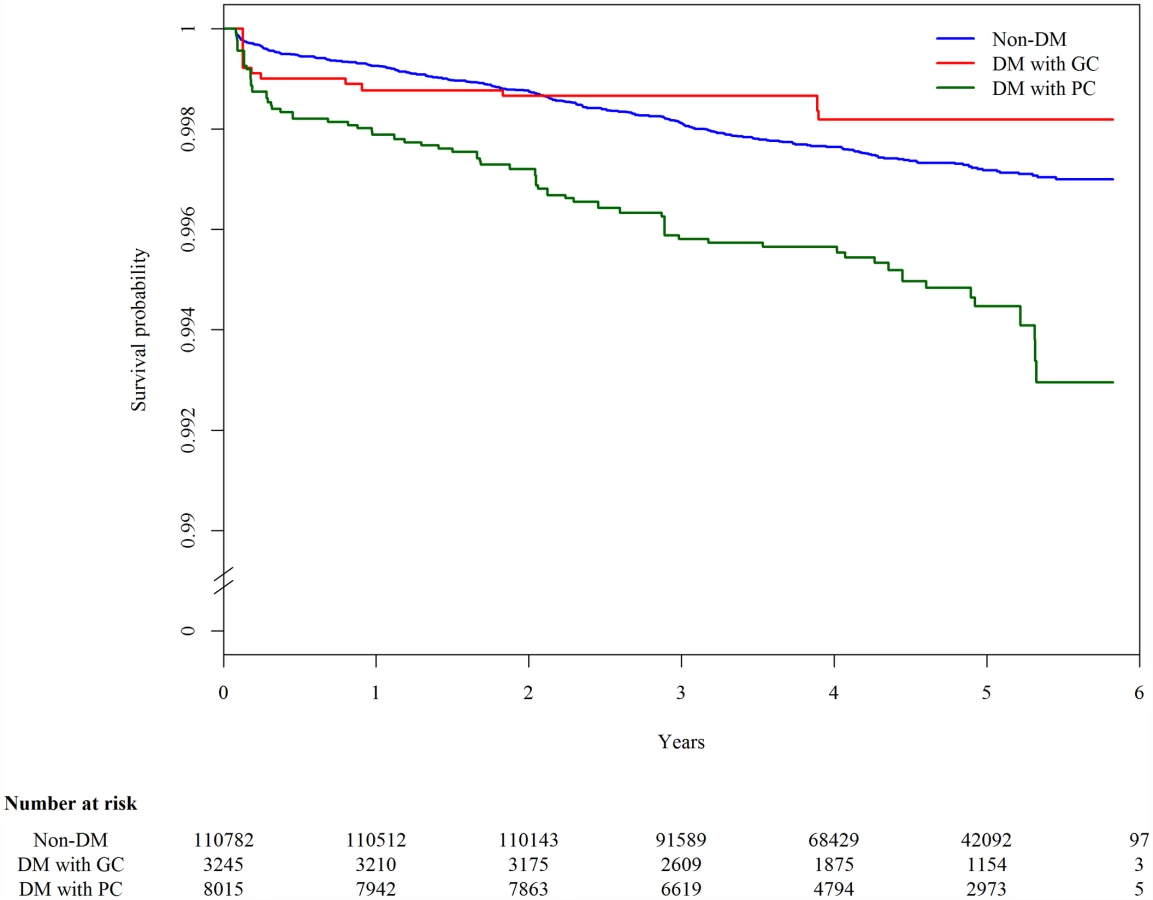
The 123,546 participants were followed up for a median of 4.6 y, and 327 cases of TB developed in 540,120 person-years. The overall incidence rate of TB was 60.5 (95% CI 54.0–67.1) per 100,000 person-years. Among those with DM information (n = 122,042), the incidence rate of TB was 54.2 (95% CI 47.7–60.8), 65.1 (95% CI 22.6–107.6), and 155.5 (95% CI 114.0–196.9) per 100,000 person-years in nondiabetic individuals, DM patients with good glycemic control, and DM patients with poor glycemic control, respectively. In the Kaplan-Meier plot, TB-free survival was significantly different by DM status (p-value from log-rank test for overall difference: 0.0019; Fig 1). Compared to DM patients with good glycemic control and individuals without DM, DM patients with poor glycemic control developed TB more quickly.
In the multivariable Cox regression analysis, DM was associated with a higher hazard of incident TB compared with nondiabetic individuals (aHR 1.70, 95% CI 1.27–2.27, p < 0.001) (Table 2). The hazard was higher among those with poor glycemic control (aHR 2.21, 95% CI 1.63–2.99, p < 0.001). The hazard of TB in those with good glycemic control did not differ significantly from that in nondiabetic individuals (aHR 0.69, 95% CI 0.35–1.36, p = 0.281). When we restricted the analysis to diabetic patients without DM-related complications, the association between glycemic control and TB risk remained unchanged (Table 2). Results from the complete case analysis were very similar to those from the main analysis using multiple imputation (S3 Table).

In the linear dose-response analysis, the hazard of TB increased with FPG (aHR 1.06 per 10-mg/dl increase in FPG, 95% CI 1.03–1.08, p < 0.001). In the penalized spline regression, the positive dose-response relationship between FPG and the hazard of TB persisted (Fig 2); the test for nonlinearity was not statistically significant (p = 0.081).

Across different subgroups of age, sex, and BMI level, poor glycemic control was associated with a higher hazard of TB and good glycemic control was not significantly associated with the hazard of TB (Table 3). There was a non-significant (p = 0.053) difference in the association between poor glycemic control and TB when grouped by age: for participants <65 y old, the aHR was 3.38 (95% CI 2.25–5.09, p < 0.001), while for those ≥65 y old, the aHR was 1.63 (95% CI 1.05–2.53, p = 0.028). We did not find evidence of effect modification by sex (p = 0.658) or BMI level (p = 0.167).

Assuming the observed association between glycemic control and risk of TB was causal, we estimated that 7.5% (95% UI 4.1%–11.5%) of all TB cases in our population would have been avoided if all diabetic patients had achieved good glycemic control.
Discussion
In this cohort study, we found that people with DM had a 70% greater hazard of active TB compared to nondiabetic individuals. However, the higher TB risk was not uniform across all DM patients. The hazard of TB, compared to those without DM, was higher (over 2-fold) in patients with poor glycemic control (FPG > 130 mg/dl) but was not significantly different in those with good glycemic control (FPG ≤ 130 mg/dl). In the dose-response analysis, the hazard of TB increased with increasing levels of FPG. Assuming the observed association between glycemic control and TB was causal, we determined that 7.5% of incident TB in the study population could be attributed to poor glycemic control.
Previous observational studies have shown that the risk of TB is greater in patients with diabetes to varying degrees [2]. The present analysis suggests that the variation in DM-TB association might be partially explained by different levels of glycemic control in the study populations. Few studies have investigated the association between glycemic control and TB risk. In a cohort study of older individuals in Hong Kong, DM patients with hemoglobin A1c (HbA1c) ≥ 7% had a higher risk of developing active TB than individuals without DM (aHR 2.56), while the risk among patients with HbA1c < 7% was not elevated [9]. Another cohort study of DM patients in Chile reported that 24.2% of insulin-dependent DM patients developed active TB in 10 y, while the risk of TB for other DM patients was 4.8% [26]. Baker et al. used the number of DM-related complications as a proxy measurement for DM severity and found that the risk of TB increased with increasing DM severity [8]. On the other hand, in two population-based studies in Denmark and the UK, the level of HbA1c was not associated with the risk of TB [10,11]. We note that several factors including BMI, smoking status, and alcohol use were not adjusted for in the Denmark study. High BMI is associated with poor glycemic control and a lower risk of TB; therefore, the negative result in the Denmark study could be due to confounding by high BMI. In the UK study, glycemic control was generally good in diabetic patients, with nearly two-thirds of patients having HbA1c of < 7.5%. This was in contrast to our diabetic patients, in whom only one-third had good glycemic control. The lack of association between glycemic control and TB risk in the UK study might be explained by DM being well-controlled among diabetic patients in this population. In sum, the finding from the present study, together with previous research, suggests that good glycemic control could potentially modify the higher risk of TB among DM patients.
This study is an observational study, but the finding of a beneficial effect of glycemic control on TB was unlikely to be due to biases. First, the distribution of other major risk factors for TB was similar in the two DM groups (good glycemic control versus poor glycemic control; Table 1). We note, however, that we cannot rule out the possibility of confounding by other unmeasured covariates. Second, TB patients can have transient hyperglycemia before receiving anti-TB treatment [27]. Therefore, the apparently higher hazard among DM patients with poor glycemic control could be due to reverse causality. However, the long follow-up period (>4 y) and exclusion of TB cases that occurred within the first month of follow-up minimized the chance of reverse causality. In the Kaplan-Meier plot, the group of diabetic patients with poor glycemic control was separated from the other two groups during the whole follow-up period, and the separation gradually increased over time. Therefore, our results could not be explained by reverse causality. Third, people with long-term DM may be more likely to have poor glycemic control than those with new-onset DM. As a result, the observed lower hazard of TB in those with good glycemic control could be simply due to the early stage of DM instead of being the effect of glycemic control. However, when we restricted the analysis to those without any DM complications to adjust for the duration of DM, the result remained unchanged. Overall, the evidence from our analysis supports a probable causal effect of glycemic control on the occurrence of TB.
Although the exact mechanism underlying the association between DM and TB is yet to be clearly elucidated, previous laboratory studies have suggested that both the innate and adaptive immunity related to TB defense were impaired in DM patients [28]. A few studies further shed light on the possibility that improved glycemic control could restore immune function and reverse the risk of TB. Using serial whole blood chemiluminescence, MacRury et al. found that phagocytic function was below normal in non-insulin-dependent DM patients with poor glycemic control; phagocytic function was significantly elevated when glycemic control was improved [29]. In another study, impaired granulocyte adherence was noted in patients with poorly controlled DM. After 1–2 wk of antidiabetic treatment and lowering of fasting blood glucose, granulocyte adherence improved significantly [30]. Another study found that diabetic mice had lower expression of Th1-related cytokines in response to Mycobacterium tuberculosis infection, and insulin treatment significantly improved the synthesis of related cytokines [31]. Lastly, Gomez et al. found that the attachment and ingestion of M. tuberculosis in human monocytes was lower in diabetic than nondiabetic individuals. In multivariable analysis, poorly controlled DM (measured by HbA1c and plasma glucose level) was a significant predictor of lower interaction between monocytes and M. tuberculosis [32].
In our study, the point estimate of relative risk for DM patients with good glycemic control was lower than the null value of one (compared to nondiabetic individuals), although the confidence interval was very wide. A similar pattern was also observed in a previous study of the elderly population in Hong Kong (aHR 0.81 comparing DM patients with HbA1c < 7% to those without DM, 95% CI 0.44–1.48) [9]. Baker et al. suggested that residual confounding by BMI level might explain the lower risk in those with good glycemic control in their study [8]. In our analysis, however, BMI was adjusted for both continuously and categorically (Table 2 and S4 Table). Another possibility is the anti-TB effect of metformin. In a recent study, metformin was found to inhibit the intracellular growth of M. tuberculosis in a human monocytic cell line and to improve the treatment outcome of TB patients [33]. Since metformin is a commonly prescribed antidiabetic agent, it may be possible that the “metformin group” of patients with well-controlled diabetes was driving the trend towards a protective effect for patients with well-controlled diabetes relative to nondiabetic individuals. Further studies are required to confirm the efficacy of metformin against TB.
Our study has limitations. The information on glycemic control was based on a single FPG test at baseline, and this may not reflect the long-term status of individuals’ glycemic control during the study period. Previous large-scale studies showed a good correlation between FPG and HbA1c [34,35]. In addition, levels of FPG and HbA1c were both found to correlate well with the prevalence of diabetic retinopathy in several populations [34,36]. In our study, the single measurement of fasting glucose was still strongly predictive of subsequent development of TB. In case of any measurement error of glycemic control in our study, this error would likely be nondifferential with regard to the risk of TB (after adjusting for other major TB risk factors), and would mostly likely bias our results toward a less significant association between glycemic control and TB. In other words, the association between glycemic control and TB might have been even larger if we had obtained more complete information on long-term glycemic control over time. Furthermore, we do not have information on latent TB infection at baseline because tuberculin skin tests and interferon gamma release assays were not performed in the screening survey. Further studies are needed to better understand the role of DM in primary progressive TB versus reactivation disease.
The study population was voluntary participants of a community-based health screening service. It is possible that nonparticipants were at greater risk of poor glycemic control as well as greater risk of TB, causing selection bias. In addition, although major risk factors for TB were adjusted for in the analysis, we cannot rule out the possibility of unmeasured or residual confounding in this observational study. The definition of DM was based on prescription of antidiabetics and FPG. It was possible that nondiabetic patients with obesity or polycystic ovary syndrome were misclassified as DM patients because of metformin use. We conducted a sensitivity analysis excluding metformin from the list of antidiabetics in DM definition, and the results remained unchanged. Lastly, the diagnosis of TB was based on the national health insurance database. To explore the impact of outcome misclassification, we conducted a sensitivity analysis using different durations of anti-TB treatment (30 d and 60 d) to define TB, and the results were similar.
In some countries with low or intermediate burden of TB, non-foreign-born TB cases are increasingly concentrated in the elderly population as a result of reactivation from remote latent infection. In these settings, TB case detection and treatment will have limited impact on the incidence of TB disease. Preventive therapy can effectively reduce the risk of TB in those with latent TB infection, but potential drug toxicity limits its use in the elderly [37]. On the other hand, DM is a prevalent disease in the elderly and contributes substantially to TB burden, especially in populations with poorly controlled diabetes [38]. Management of DM provides an alternative solution to reduce TB in the elderly. In our study cohort, 70% of DM patients had suboptimal glycemic control (FPG > 130 mg/dl) despite the universal coverage of national health insurance. Consistent with our finding, the percentage of patients with poor glycemic control (defined as HbA1c ≥ 7.0%) was 68% and 66% in 2006 and 2011, respectively, in recent national surveys [39]. Further studies are needed to identify and evaluate effective strategies to improve glycemic control at the population level [40].
DM is a major risk factor for TB and will likely be an important driver of TB epidemiology in the upcoming decades [41]. In a modeling study, Pan et al. found that prevention of DM could avoid millions of TB cases and TB deaths in 13 high-burden countries over the next two decades [12]. Our study provides further evidence that, in addition to prevention of DM, improving glycemic control in DM patients may also benefit TB control. Echoing the new WHO End TB Strategy, we urge that more efforts be made to link non-communicable and communicable disease programs in order to leverage the overall impact on disease control and prevention. In practice, the comprehensive program for DM-TB management should include prevention of DM, early detection of DM followed by proper glycemic control, and bi-directional screening of DM and TB.
Supporting Information
Zdroje
1. World Health Organization. Global strategy and targets for tuberculosis prevention, care and control after 2015. 2013 Nov 29 [cited 13 May 2015]. http://apps.who.int/gb/ebwha/pdf_files/EB134/B134_12-en.pdf?ua=1.
2. Jeon CY, Murray MB. Diabetes mellitus increases the risk of active tuberculosis: a systematic review of 13 observational studies. PLoS Med. 2008;5:e152. doi: 10.1371/journal.pmed.0050152 18630984
3. Baker MA, Harries AD, Jeon CY, Hart JE, Kapur A, Lonnroth K, et al. The impact of diabetes on tuberculosis treatment outcomes: a systematic review. BMC Med. 2011;9 : 81. doi: 10.1186/1741-7015-9-81 21722362
4. Danaei G, Finucane MM, Lu Y, Singh GM, Cowan MJ, Paciorek CJ, et al. National, regional, and global trends in fasting plasma glucose and diabetes prevalence since 1980: systematic analysis of health examination surveys and epidemiological studies with 370 country-years and 2.7 million participants. Lancet. 2011;378 : 31–40. doi: 10.1016/S0140-6736(11)60679-X 21705069
5. Harries AD, Lin Y, Satyanarayana S, Lonnroth K, Li L, Wilson N, et al. The looming epidemic of diabetes-associated tuberculosis: learning lessons from HIV-associated tuberculosis. Int J Tuberc Lung Dis. 2011;15 : 1436–1444. doi: 10.5588/ijtld.11.0503 21902876
6. Leibovici L, Yehezkelli Y, Porter A, Regev A, Krauze I, Harell D. Influence of diabetes mellitus and glycaemic control on the characteristics and outcome of common infections. Diabet Med. 1996;13 : 457–463. doi: 10.1002/(sici)1096-9136(199605)13 : 5<457::aid-dia83>3.0.co;2-t 8737028
7. Dronge AS, Perkal MF, Kancir S, Concato J, Aslan M, Rosenthal RA. Long-term glycemic control and postoperative infectious complications. Arch Surg. 2006;141 : 375–380. doi: 10.1001/archsurg.141.4.375 16618895
8. Baker MA, Lin HH, Chang HY, Murray MB. The risk of tuberculosis disease among persons with diabetes mellitus: a prospective cohort study. Clin Infect Dis. 2012;54 : 818–825. doi: 10.1093/cid/cir939 22238171
9. Leung CC, Lam TH, Chan WM, Yew WW, Ho KS, Leung GM, et al. Diabetic control and risk of tuberculosis: a cohort study. Am J Epidemiol. 2008;167 : 1486–1494. doi: 10.1093/aje/kwn075 18400769
10. Leegaard A, Riis A, Kornum JB, Prahl JB, Thomsen VO, Sorensen HT, et al. Diabetes, glycemic control, and risk of tuberculosis: a population-based case-control study. Diabetes Care. 2011;34 : 2530–2535. doi: 10.2337/dc11-0902 21972407
11. Pealing L, Wing K, Mathur R, Prieto-Merino D, Smeeth L, Moore DA. Risk of tuberculosis in patients with diabetes: population based cohort study using the UK Clinical Practice Research Datalink. BMC Med. 2015;13 : 135. doi: 10.1186/s12916-015-0381-9 26048371
12. Pan SC, Ku CC, Kao D, Ezzati M, Fang CT, Lin HH. Effect of diabetes on tuberculosis control in 13 countries with high tuberculosis: a modelling study. Lancet Diabetes Endocrinol. 2015;3 : 323–330. doi: 10.1016/S2213-8587(15)00042-X 25754415
13. American Diabetes Association. Standards of medical care in diabetes—2013. Diabetes Care. 2013;36(Suppl 1):S11–S66. doi: 10.2337/dc13-S011 23264422
14. American Diabetes Association. (6) Glycemic targets. Diabetes Care. 2015;38(Suppl):S33–S40. doi: 10.2337/dc15-S009 25537705
15. Young BA, Lin E, Von Korff M, Simon G, Ciechanowski P, Ludman EJ, et al. Diabetes complications severity index and risk of mortality, hospitalization, and healthcare utilization. Am J Manag Care. 2008;14 : 15–23. 18197741
16. Taiwan National Health Insurance Administration. [National health insurance in Taiwan 2014–2015 annual report.] 2014 [cited 5 May 2016]. http://www.nhi.gov.tw/Nhi_E-LibraryPubWeb/CustomPage/P_Detail.aspx?FType=8&CP_ID=129.
17. Chen CC, Chiang CY, Pan SC, Wang JY, Lin HH. Health system delay among patients with tuberculosis in Taiwan: 2003–2010. BMC Infect Dis. 2015;15 : 491. doi: 10.1186/s12879-015-1228-x 26527404
18. Hernan MA. The hazards of hazard ratios. Epidemiology. 2010;21 : 13–15. doi: 10.1097/EDE.0b013e3181c1ea43 20010207
19. Therneau TM, Crowson CS, Atkinson EJ. Adjusted survival curves. 2015 Jan [cited 5 May 2016]. https://cran.r-project.org/web/packages/survival/vignettes/adjcurve.pdf.
20. Wen CP, Cheng CW, Cheng TY, Tsai MK, Chiang PH, Tsai SP, et al. Trends in betel quid chewing behavior in Taiwan—exploring the relationship between betel quid chewing and smoking. Taiwan J Public Health. 2009;28 : 407–419.
21. Lonnroth K, Williams BG, Cegielski P, Dye C. A consistent log-linear relationship between tuberculosis incidence and body mass index. Int J Epidemiol. 2010;39 : 149–155. doi: 10.1093/ije/dyp308 19820104
22. Therneau TM, Grambsch PM. Modeling survival data: extending the Cox model. New York: Springer; 2000.
23. White IR, Royston P, Wood AM. Multiple imputation using chained equations: issues and guidance for practice. Stat Med. 2011;30 : 377–399. doi: 10.1002/sim.4067 21225900
24. Rubin DB. Multiple imputation for nonresponse in surveys. Hoboken (New Jersey): John Wiley & Sons; 2008.
25. Miettinen OS. Proportion of disease caused or prevented by a given exposure, trait or intervention. Am J Epidemiol. 1974;99 : 325–332. 4825599
26. Olmos P, Donoso J, Rojas N, Landeros P, Schurmann R, Retamal G, et al. [Tuberculosis and diabetes mellitus: a longitudinal-retrospective study in a teaching hospital]. Rev Med Chil. 1989;117 : 979–983. 2519480
27. Dooley KE, Chaisson RE. Tuberculosis and diabetes mellitus: convergence of two epidemics. Lancet Infect Dis. 2009;9 : 737–746. doi: 10.1016/S1473-3099(09)70282-8 19926034
28. Martinez N, Kornfeld H. Diabetes and immunity to tuberculosis. Eur J Immunol. 2014;44 : 617–626. doi: 10.1002/eji.201344301 24448841
29. MacRury SM, Gemmell CG, Paterson KR, MacCuish AC. Changes in phagocytic function with glycaemic control in diabetic patients. J Clin Pathol. 1989;42 : 1143–1147. 2584425
30. Bagdade JD, Stewart M, Walters E. Impaired granulocyte adherence. A reversible defect in host defense in patients with poorly controlled diabetes. Diabetes. 1978;27 : 677–681. 658613
31. Yamashiro S, Kawakami K, Uezu K, Kinjo T, Miyagi K, Nakamura K, et al. Lower expression of Th1-related cytokines and inducible nitric oxide synthase in mice with streptozotocin-induced diabetes mellitus infected with Mycobacterium tuberculosis. Clin Exp Immunol. 2005;139 : 57–64. doi: 10.1111/j.1365-2249.2005.02677.x 15606614
32. Gomez DI, Twahirwa M, Schlesinger LS, Restrepo BI. Reduced Mycobacterium tuberculosis association with monocytes from diabetes patients that have poor glucose control. Tuberculosis (Edinb). 2013;93 : 192–197. doi: 10.1016/j.tube.2012.10.003
33. Singhal A, Jie L, Kumar P, Hong GS, Leow MK, Paleja B, et al. Metformin as adjunct antituberculosis therapy. Sci Transl Med. 2014;6 : 263ra159. doi: 10.1126/scitranslmed.3009885 25411472
34. Davidson MB, Schriger DL, Peters AL, Lorber B. Relationship between fasting plasma glucose and glycosylated hemoglobin: potential for false-positive diagnoses of type 2 diabetes using new diagnostic criteria. JAMA. 1999;281 : 1203–1210. 10199430
35. Liang CC, Tsan KW, Ma SM, Chow SF, Wu CC. The relationship between fasting glucose and HbA1c among customers of health examination services. Formos J Endocrinol Metab. 2010;1 : 1–5.
36. Azizi-Soleiman F, Heidari-Beni M, Ambler G, Omar R, Amini M, Hosseini SM. Iranian risk model as a predictive tool for retinopathy in patients with type 2 diabetes. Can J Diabetes. 2015;39 : 358–363. doi: 10.1016/j.jcjd.2015.01.290 25837808
37. Kunst H, Khan KS. Age-related risk of hepatotoxicity in the treatment of latent tuberculosis infection: a systematic review. Int J Tuberc Lung Dis. 2010;14 : 1374–1381. 20937175
38. Restrepo BI, Schlesinger LS. Impact of diabetes on the natural history of tuberculosis. Diabetes Res Clin Pract. 2014;106 : 191–199. doi: 10.1016/j.diabres.2014.06.011 25082309
39. Yu NC, Su HY, Chiou ST, Yeh MC, Yeh SW, Tzeng MS, et al. Trends of ABC control 2006–2011: a national survey of diabetes health promotion institutes in Taiwan. Diabetes Res Clin Pract. 2013;99 : 112–119. doi: 10.1016/j.diabres.2012.11.018 23265923
40. Walker RJ, Smalls BL, Campbell JA, Strom Williams JL, Egede LE. Impact of social determinants of health on outcomes for type 2 diabetes: a systematic review. Endocrine. 2014;47 : 29–48. doi: 10.1007/s12020-014-0195-0 24532079
41. Lonnroth K, Castro KG, Chakaya JM, Chauhan LS, Floyd K, Glaziou P, et al. Tuberculosis control and elimination 2010–50: cure, care, and social development. Lancet. 2010;375 : 1814–1829. doi: 10.1016/S0140-6736(10)60483-7 20488524
Štítky
Interní lékařstvíČlánek vyšel v časopise
PLOS Medicine
2016 Číslo 8
- Alternativní léčebné možnosti u hypercholesterolemie při intoleranci statinů
- Vliv kombinace nutraceutik na remodelaci levé komory srdeční u osob s metabolickým syndromem
- Nutraceutika a jejich ovlivnění mírného kardiometabolického rizika
- Princip účinku medu v léčbě chronických i infikovaných ran
- Superoxidovaný roztok a jeho využití v léčbě ran
Nejčtenější v tomto čísle
- Glycemic Control and the Risk of Tuberculosis: A Cohort Study
- Transitioning to Country Ownership of HIV Programs in Rwanda
- Dementia across the Lifespan and around the Globe—Pathophysiology, Prevention, Treatment, and Societal Impact: A Call for Papers
- Social Dancing and Incidence of Falls in Older Adults: A Cluster Randomised Controlled Trial