
The World Health Organization Fetal Growth Charts: A Multinational Longitudinal Study of Ultrasound Biometric Measurements and Estimated Fetal Weight
Using data from a multinational longitudinal study, Mariana Widmer and colleagues report The World Health Organization fetal growth charts.
Published in the journal:
. PLoS Med 14(1): e32767. doi:10.1371/journal.pmed.1002220
Category:
Research Article
doi:
https://doi.org/10.1371/journal.pmed.1002220
Summary
Using data from a multinational longitudinal study, Mariana Widmer and colleagues report The World Health Organization fetal growth charts.
Introduction
Global mortality for infants under age 5 y halved from 90 to 43 deaths per 1,000 live births between 1990 and 2015. This is the result of a tremendous global effort to achieve the UN Millennium Development Goals [1] and the goals of the UN Secretary-General’s Every Woman Every Child initiative [2]. Neonatal mortality in the first 28 d declined (by 47%) from 5.0 to 2.6 million deaths annually over this period. Unfortunately, inequality between countries persists, with 98% of neonatal deaths occurring in low - and middle-income countries [3]. Importantly, more than 60% of such deaths are associated with low birthweight due to intrauterine growth restriction or preterm birth or both [4,5]. Ultrasound imaging has become an essential tool for assuring correct gestational age and for fetal size assessment, increasingly so even in societies with restricted resources. Correspondingly, evidence is emerging at the population level that use of ultrasound biometry increases the rate of detection of fetal growth restriction and the identification of those at increased risk of neonatal morbidity [6].
Birthweight, closely linked to fetal growth, is also a marker of risks for noncommunicable diseases in adult life, with cardiovascular diseases, type II diabetes, and obesity being the most prominent [7,8]. While the birthweight gradient across the entire population reflects the distribution of degrees of such risk, it is increasingly evident that it is the developing physiology associated with fetal growth, rather than birthweight per se, that conditions cardiovascular, metabolic, endocrine, and neural functions for the life course, and thus long-term health and disease risks [9]. For this reason, fetal growth data and aspects of intrauterine development need to be included as an important part of an early-life noncommunicable disease prevention initiative, as this targets the time when the effect of an intervention is greatest [10].
A meeting of experts convened by WHO in 2002 reviewed current knowledge on birthweight as a health outcome and identified a need for research to develop fetal growth charts for international use [11]. In 2006, WHO published the multicenter WHO Child Growth Standards [12] using a prescriptive concept that assumes that, under optimal socioeconomic and nutritional conditions, all children follow one growth standard, regardless of ethnic background. Some support for this concept was drawn from previous studies [13,14]. Although widely adopted, the applicability of these child growth standards has been questioned on the grounds of lack of fit to some populations [15,16], especially for the head circumference standards [17].
Recently, a large multicenter study, the Fetal Growth Longitudinal Study of the Intergrowth-21st Project [18], applied the same concept and approach to fetal growth. The study presented growth standards using ultrasound biometric measurements but did not estimate fetal weight (EFW), even though this is the single most widely used clinical assessment of fetal growth today. Another large recent study, the NICHD Fetal Growth Studies, showed significant differences in fetal growth with ethnicity, and established ethnic-specific growth charts [19]. This contradicts the prescriptive concept that one standard fits all. The study was, however, restricted to four self-reported ethnic groups of Asian, Hispanic, black, and white women in the US.
The present study is the fetal component of the WHO Multicentre Growth Reference Study, which aimed to establish growth charts for clinical use based on populations recruited from multiple countries [20].
Methods
Design
This was a multinational observational study approved by the WHO Research Project Review Panel (RP2) and the WHO Research Ethics Review Committee, secondarily approved by the national or local ethics review committee for each study center, and correspondingly carried out according to the Helsinki declaration on ethical principles for medical research in humans [20,21]. All women were recruited specifically for this study, gave written informed consent at inclusion, and otherwise followed their conventional antenatal care program separately from study sessions. Study measurements were revealed to the clinician when the information was thought to be of importance for the management of the pregnancy. The study protocol was published previously [20], so here we present a condensed account of the methods. The study selected participating centers from a range of ethnic and geographical settings, and intended to recruit 1,400 participants. The sample size calculation procedure was published previously [20].
Setting
The following centers participated in the study based on the proficient use of ultrasonography: Centro Rosarino de Estudios Perinatales, Rosario, Argentina; University of Campinas, Campinas, Brazil; University of Kinshasa, Kinshasa, Democratic Republic of the Congo (D. R. Congo); Rigshospitalet, Copenhagen University, Copenhagen, Denmark; Assiut University, Assiut, Egypt; Hôpital Antoine Béclère, Paris, France; University Medical Center, Hamburg-Eppendorf, Germany; All India Institute of Medical Sciences, New Delhi, India; Haukeland University Hospital, Bergen, Norway; and Khon Kaen University, Khon Kaen, Thailand.
Participants
Participants without known health, environmental, and/or socioeconomic constraints were invited to participate in the study. Further inclusion criteria were used: living at an altitude lower than 1,500 m and near the study area (intended to promote compliance for the duration of the study and any possible follow-up studies); age ≥ 18 y and ≤ 40 y; body mass index (BMI) 18–30 kg/m2; singleton pregnancy; gestational age at entry between gestational week 8+0 d and 12+6 d according to reliable information on last menstrual period (LMP) and confirmed by ultrasound measurement of fetal crown–rump length; no history of chronic health problems; no long-term medication (including fertility treatment); no environmental or economic constraints likely to impede fetal growth; not smoking currently or in the previous 6 mo; no history of recurrent miscarriages; no previous preterm delivery (<37 wk) or birthweight < 2,500 g; and no evidence in the present pregnancy of congenital disease or fetal anomaly at study entry. Fetal anomalies detected during pregnancy or at birth were noted and verified postnatally. Pregnancies in which small-for-gestation-age fetuses were observed or intrauterine growth restriction was suspected were also noted. All mothers recruited were followed up until the end of the study, apart from those withdrawing consent.
Study Procedures
Women in the first trimester (before week 12+6 d of gestation) attending antenatal care clinics were approached by members of the study team and asked to participate. They were informed about the study objectives and procedures. Those who signed the consent form were enrolled in the study. After the ultrasound scan to assess agreement between gestational age based on LMP and that based on crown–rump length, they were scheduled for fetal biometry scans at monthly intervals.
All infants had an anthropometric assessment after delivery, including measurement of birthweight. All pregnant women in the study were asked for a 24-h dietary recall at entry into the study (and at 28 and 36 wk of gestation) [22]. Clinically relevant conditions (e.g., hypertension, preeclampsia, and diabetes) occurring during pregnancy and childbirth were noted. Otherwise, no further procedures were added to the routine antenatal care provided at the study centers.
Gestational Age Assessment
Gestational age was confirmed by measuring the crown–rump length between gestational week 8 + 0 d and 12 + 6 d based on LMP and recorded as the average of three measurements. To acquire the crown–rump length, the midline sagittal section of the whole fetus was visualized with the fetus horizontal on the screen at 90 degrees to the angle of insonation. Gestational age was assessed by using the reference charts published by Robinson and Fleming [23]. The woman was eligible for the study provided that gestational age by crown–rump length confirmed LMP-based age within 7 d. The LMP-based age was used for the analyses.
Ultrasound Measurements
The first visit (dating scan) was between 8 + 0 and 12 + 6 wk, and subsequent visits for fetal biometry were scheduled at approximately 4-wk (±1 wk) intervals at 14, 18, 24, 28, 32, 36, and 40 wk. All scanning appointments were arranged at the time of the dating scan and study enrollment. All participants were scanned in the lateral recumbent position.
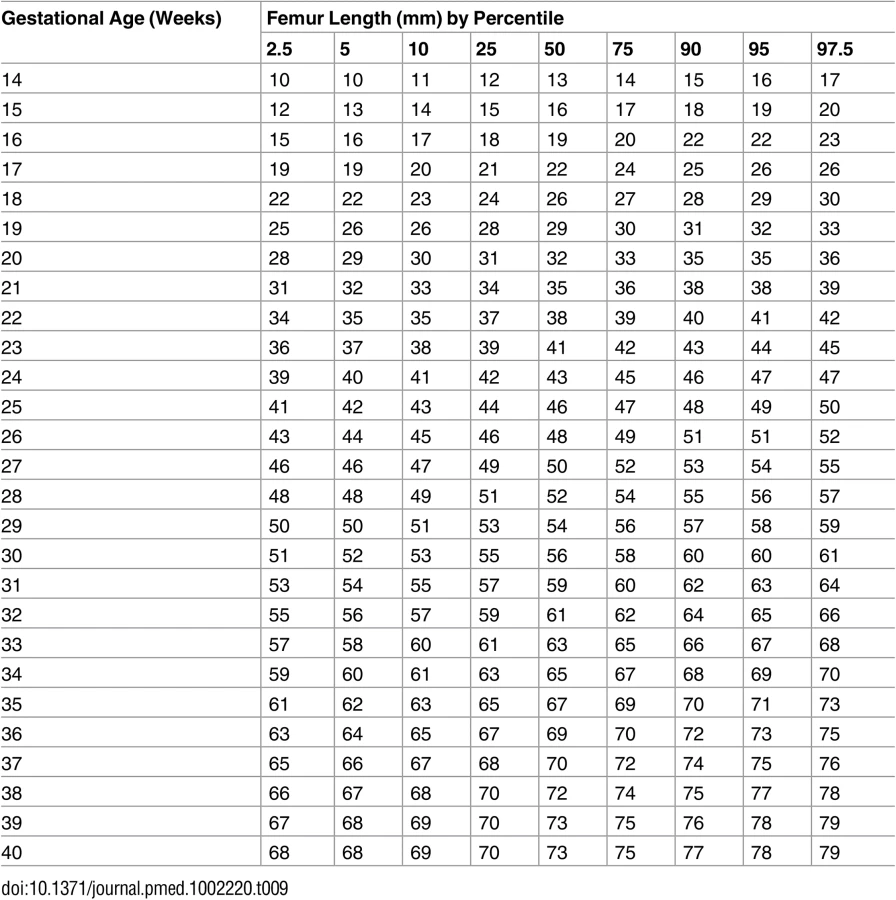
The compulsory ultrasound measurements obtained at all visits included the following biometric parameters: biparietal diameter (BPD), head circumference (HC), abdominal circumference (AC), femur length (FL), and humerus length (HL). At each examination, all measurements were obtained three times from three separately generated ultrasound images and uploaded electronically (with the associated images) to the data management system. The median of the three measurements of each parameter was used in the analyses.
In addition, a full morphological evaluation (anomaly scan) was conducted at 18–24 wk following standard practice at each center. Fetuses diagnosed with any anomaly were managed according to local clinical guidelines. Their ultrasound measurements were included in the study, and the possible effect on the percentiles derived was evaluated. The following measurement techniques were used. BPD was measured as the outer–inner distance of the parietal bones in a cross-sectional view of the fetal head at the level of the thalami and cavum septi pellucidi or cerebral peduncles. The cerebellum was not included in the section. The measurement was obtained from an image with the midline echo as close as possible to the horizontal plane, 90 degrees to the ultrasound beam. HC was obtained from the same image as BPD as follows: calipers were placed on the outer borders of the occipital and frontal edges of the bone at the point of the midline of the skull, and the ellipse facility was used to follow the outer perimeter of the skull to calculate HC. AC was measured in the transverse section of the fetal abdomen that was as close as possible to circular and that included the stomach and the junction of the umbilical vein and portal sinus. The anteroposterior and transverse diameters were then measured with calipers placed on the outer borders of the body outline. The anteroposterior diameter was measured from the spine to the anterior abdominal wall, and the transverse diameter at a right angle to the anteroposterior diameter. The ellipse facility was used to calculate AC as outlined above. FL was measured from an image of the full femoral shaft in a plane close to 90 degrees to the ultrasound beam. The distal femoral epiphysis was excluded. Similarly, HL was measured from an image of the full humeral shaft in a plane close to 90 degrees to the ultrasound beam.
The participating centers used identical ultrasound machines during the project (Voluson Expert E8, General Electric, Kretz Ultrasound, Zipf, Austria) equipped with two curvilinear transabdominal transducers (4–8 MHz and 1–5 MHz) and a transvaginal transducer (6–12 MHz), observing that the energy output was set so that thermal index (TI) was <1.0. The TI was automatically recorded and transmitted to the web-based data management system by the ultrasound machine.
Measurement results were stored electronically, with the images together with all information collected from the mother and the perinatal outcomes. EFW was calculated by including HC, AC, and FL in Hadlock et al.’s third formula [24]. To facilitate assessment of relative fetal head size and growth, the ratios FL/HC and FL/BPD were established.
Training and Quality Assurance
The choice of participating centers was based on their proficient use of ultrasound by experienced sonographers. The sonographers participating in the study received specific training for the study and were certified as proficient under the supervision of a qualified instructor, according to a standard protocol. All the ultrasound operators had their scans assessed for quality during their early period in the project. Instruments and techniques used in all centers were standardized, i.e., equipment and training were provided to each of the measurement teams.
Maternal Anthropometric and Nutritional Assessment and Birthweight
Weight wearing light clothing was measured using a beam balance with nondetachable weights and recorded to the nearest 0.1 kg. Height of the mother was measured in the standing position using a stadiometer and recorded to the nearest millimeter. If the reading fell between two values, the lower was recorded.
The 24-h diet recall assessment was carried out by a specifically trained nutritionist or nurse who asked the study participant about food and beverages consumed during the previous 24 h [22]. Further details are available elsewhere [20]. Birthweight was assessed at delivery, and neonatal morphometry carried out within 24 h according to the protocol [20].
Data Management
Data were collected via a web-based data management system developed by Centro Rosarino de Estudios Perinatales, Rosario, Argentina. All data (clinical, anthropometric, nutritional, and fetal biometry measurements plus 2-D/3-D images) were stored in a central server compliant with good clinical practice. Data transmission was encrypted to assure data integrity and patient confidentiality. Access to the web system was password protected, and only authorized users had access. Data changes were documented by a complete audit trail record kept automatically by the web system (recording when, by whom, and why data were changed). Data entered into the web system were checked by the coordinating unit at Centro Rosarino de Estudios Perinatales for completeness, accuracy, reliability, and consistent intended performance. Different kinds of validation procedures were carried out (checking missing values and outliers, cross-checks, cross-time verifications among scanning appointments, and protocol compliance). Measurements and 2-D/3-D images corresponding to fetal biometry had special processing. In collaboration with General Electric Healthcare, Germany, ViewPoint software was installed at all participating centers, allowing a standard interface/procedure for scans and an automatic transfer of fetal biometry measurements/images to the web-based system. Thus, all fetal biometry measurements considered by the protocol were automatically transferred instead of being entered manually (except for D. R. Congo; there, a complete checking of values was done by the comparison of images and values entered into the web-based system). The above mentioned web-based system and procedures have been used in five previous HRP (UNDP/UNFPA/UNICEF/WHO/World Bank Special Programme of Research, Development and Research Training in Human Reproduction)/WHO multicenter studies and are proven to be efficient and compliant with HRP/WHO Standard Operating Procedures as well as with Title 21 CFR Part 11 of the Code of Federal Regulations, which deals with United States Food and Drug Administration guidelines on electronic records.
Adjustments of Analyses Compared with the Protocol and Justifications
Compared with the original protocol [20], the following aspects of the study were adjusted. Reliable information on LMP (confirmed by a measurement of crown–rump length), rather than ultrasound measured crown–rump length alone, was used as the basis for gestational age calculation for the following reasons: there is no evidence that ultrasound dating more accurately determines gestational age than a reliable LMP confirmed by crown–rump length; reliable LMP is the basis for establishing crown–rump length charts for dating; crown–rump length dating translates natural variation of size into variation of gestational age, which is not desirable for a study of growth; and LMP, not crown–rump length, is the accessible, low-cost method for gestational age assessment for all women in the world, and for the low-income areas usually the only one.
The sample size calculation was based on the assumption of normality for the distribution of ultrasound measurements. However, we used quantile regression, which calculates quantiles (i.e., percentiles) directly from the observed measurements without making assumptions about the distribution.
Maternal and fetal conditions occurring during pregnancy were not excluded from the analysis. The rationale for this was that the reference intervals of this study are intended primarily for clinical use and therefore should reflect the population for which they are intended as closely as possible. The pregnancy conditions (e.g., complications) that the study population experienced are those common to low-risk pregnancies around the world. Likewise, excluding all neonates below the 10th percentile of birthweight, as suggested in the protocol [20], would by definition remove the 10% of the participants at the bottom of the range (the vast majority being healthy in this low-risk cohort) and cause a corresponding distortion of the new growth charts, i.e., a substantial upward shift of all the lowest percentiles (10, 5, 2.5, and 1) in the direction of supernormal.
Given the plethora of measurements, we prioritized clinical usefulness in the analyses and results presented here (e.g., EFW and common biometric measurements) and left the following for secondary studies and publications: transverse cerebellar diameter, fetal foot length, 3-D ultrasound acquisitions, maternal anthropometric measurements except height and weight, the second and third sets of dietary 24-h-recall data (at 28 and 36 wk of gestation), and newborn anthropometric measurements except birthweight.
Data Analysis and Statistical Methods
Descriptive statistics were calculated for the women’s characteristics at study entry, for mode of delivery, for birth events, and for fetal, neonatal, and maternal conditions, by country and overall. Protocol compliance was evaluated by comparing the dates of the windows of gestational age defined in the protocol with the dates of actual measurements.
The ultrasound measurements were used to estimate reference curves for individual parameters (BPD, HC, AC, FL, HL, FL/HC, FL/BPD) and EFW based on Hadlock et al.’s formula 3 [24]. Reference curves were fitted using quantile regression for reference models, as described by Wei et al. [25] from the work of Koenker [26,27].
The development of reference curves has up to now in general used parametric models, based on assumptions about distribution and on transformation of the observations to normal distributions. Advances brought by computer power and by the work of Koenker and others have made it possible to estimate the distributions directly by estimating their quantiles. Quantile regression is now a well-established technique [26,27], and statistical software is available to fit quantile regression models. Quantile regression fits a function to each chosen quantile using linear programming and has the advantage of not imposing any distributional assumptions. The asymmetry and kurtosis of the fitted distributions may thus assume any form dictated by the data, even changing with gestational age. In addition, quantile regression is more robust against the influence of outliers in the data. The flexibility of the fitting and the fact that any inference drawn is entirely data-driven led us to choose quantile regression as the method for the construction of reference curves.
The estimated quantiles were smoothed by polynomial functions of gestational age. Full models fitted a polynomial on gestational age for each country by including interaction terms between gestational age polynomial and country. Additive terms were included for other covariates.
The models were checked by the residual analysis produced by the software. Hypotheses on the overall importance of covariates were formally tested using likelihood ratio or Wald chi-square tests. In addition, visual inspection of quantile profilers was used to assess the relevance of each covariate in explaining the variation. To compare the distributions of the different countries with the overall distribution, we used quantile–quantile plots. We calculated 95% confidence intervals for the difference between country and global EFW percentiles for particular gestational ages, using the result that the parameter estimates from quantile regression were asymptotically normally distributed [28].
Logarithms of ultrasound parameters and EFW were used for the fitting. This was done only to achieve better numerical accuracy and faster convergence of the fitting algorithm. After the fitting, the results were retransformed to the original scale. To describe growth asymmetry, we used the Bowley coefficient of asymmetry [29], based on differences of semi-quartile ranges relative to the quartile range, for the gestational ages 15 and 40 wk.
Data were analyzed using SAS Software version 9.4 (SAS Institute, Cary, North Carolina, US) and JMP Pro 12 (SAS Institute, Cary, North Carolina, US).
Results
Participants
A total of 1,439 women were enrolled between October 2009 and September 2014, with data collection being completed with the last childbirth in April 2015. Of these, 52 (3.6%) withdrew consent, leaving 1,387 women and their fetuses participating in the study. Table 1 shows the numbers of women recruited, those withdrawing consent, those lost to follow-up, and those having miscarriages or intrauterine deaths, by country. Among women lost to follow-up and with miscarriage or intrauterine death, 10 and 15, respectively, did not contribute ultrasound information. All women other than those withdrawing consent were included in the growth curve analyses if they contributed ultrasound information, with the number in this analysis being 1,362.

Population Characteristics
Statistics for participating women’s characteristics, their daily caloric intake, and ethnicity are presented in Table 2. Median age at study entry was 28 y but varied between 24 y (Argentina and Egypt) and 32 y (France). Median maternal height ranged from 155 cm (India) to 169 cm (Germany), and weight from 54 kg (Thailand) to 66 kg (Germany). While overall median BMI was 23.1 kg/m2, the median by country ranged from 21.6 kg/m2 in Thailand to 25.9 kg/m2 in Egypt. Median daily caloric intake in the study group was 1,848 calories according to the 24-h dietary recall assessment, with Thailand having the lowest median, 1,232 calories, and Egypt having the highest median, 2,094 calories. The ethnic distribution of the study group was roughly 20% African (including the peri-Mediterranean Egypt), 20% Asian, and 60% white.

Perinatal Outcomes
Table 3 shows delivery information. The overall rate of spontaneous onset of birth was 67.3%, with a wide range by country: 28.5% in Brazil to 94.5% in D. R. Congo. There was an overall cesarean section rate of 32.1%, with a considerable range from 5.5% in D. R. Congo to 70.1% in Brazil. The occurrence of Apgar score < 7 at 5 min was similar in all countries, i.e., 0%–2.2%. Most of the countries had a similar distribution between female and male neonates except for Egypt, Germany, and Norway, where about 40% of neonates were female. The incidence of preterm birth varied from 3.6% in Germany to 14.7% in Egypt (p = 0.03 for differences among countries). It was lowest in D. R. Congo, Denmark, Germany, and Norway and highest in Egypt and India.

Gestational Age at Birth and Birthweight
Gestational age at birth varied between countries from a median of 38 wk 4 d in India to 40 wk 3 d in Norway (p < 0.001 for differences among countries) (Table 3). Norway had the highest median birthweight (3,575 g), and Denmark and Germany had birthweights approximately 100 g less, while Argentina, Brazil, and France had birthweights 200 g less. There is a group of countries (D. R. Congo, Egypt, and Thailand) with birthweight a median 400 g less than that of Norway, and lastly India, with birthweight 500 g less. The differences in birthweight between countries were highly significant for all percentiles (p < 0.001 for all). When adjusted for gestational age at birth, the differences were still significant for all the percentiles (p = 0.0018 for the 5th percentile and p < 0.001 for the 10th, 25th, 50th, 75th, 90th, and 95th percentiles). The estimated birthweight according to neonatal sex and gestational age is shown in Table 4.

Maternal Complications and Perinatal Conditions
Conditions occurring in the mother during pregnancy are shown in Table 5, together with fetal malformations and neonatal conditions. In addition to globally experienced maternal complications such as preeclampsia, pregnancy-induced hypertension, gestational diabetes, and anemia, 42 had identified malaria. There was no maternal death. Four small-for-gestational-age fetuses were identified clinically, of which two were examined using Doppler ultrasound; none had abnormal recordings in the umbilical artery or middle cerebral artery, and all were kept in the analysis. It was registered when neonates needed transmission to the neonatal intensive care unit, commonly due to prematurity, respiratory distress syndrome, infections, or jaundice. There were three intrauterine deaths and three neonatal deaths, representing a perinatal mortality of 0.4%.

Compliance with Ultrasound Scans
The median number of ultrasound scans (excluding the study entry screening scan) in all women was 6 (range 0–7). Compliance by gestational age window as defined in the protocol is presented in S1 Table, by country and for all countries combined (“Total”). Compliance for all countries combined in each gestational age window was between 89.1% and 100%; 72% of the participants had a complete set of all the scheduled scans. In addition, for each of the measurements BPD, HC, AC, FL, and HL, scans were obtained ≥2 times for at least 95% of participants.
Thermal Index
Of the 8,372 scan sessions in the project, 115 had no scans stored and 54 belonged to women who withdrew consent, leaving 8,203 for the statistics. The median TI was 0.2, and none had TI ≥ 1.0.
Reference Intervals for Biometric Parameters and Estimated Fetal Weight
Fig 1 presents the overall growth curves for BPD, HC, AC, FL, HL, and EFW, and for the ratios FL/HC and FL/BPD, based on quantile regression. The corresponding reference values are shown in Tables 6–13 and in csv format in S1 File.


The distribution of EFW starts with a slight asymmetry to the left (i.e., lower percentiles) in early pregnancy and ends with a very noticeable right asymmetry (i.e., higher percentiles) in later pregnancy. The Bowley coefficient of asymmetry [29], based on differences of semi-quartile ranges relative to the quartile range, was −0.016 for gestational age 15 wk and +0.111 for 40 wk.
Influence of Covariates on Growth Percentiles
Fetal sex
Male fetuses were larger than female fetuses as measured by EFW, but the disparity was smaller in the lower quantiles of the distribution (3.5%) and larger in the upper quantiles (4.5%) (Fig 2 and S2 Table, without adjustment for country differences). This difference in size by fetal sex was significant at the 5% level for all percentiles. EFW reference values were also established for female and male fetuses separately (Tables 14 and 15) to allow assessment customized according to fetal sex. For example, at gestational week 37, the median EFW of female fetuses is 84 g lower than that of male fetuses.


Country
Countries differed in EFW (Fig 3). Using country as a covariate in a quantile regression model, including interaction terms with gestational age, showed significance at the 5% level for all percentiles 5th, 10th, 25th, 50th, 75th, 90th, and 95th (S2 and S3 Tables). This variation due to country was adjusted for maternal characteristics (mother’s age, parity, height, and weight, or with BMI substituting the latter two) and sex of the fetus. To assess the relative contribution of these variables to the variation in EFW, the Wald chi-square statistics in S2 and S3 Tables are informative, e.g., for the 5th percentile (quantile 0.05, first table in S2 Table), as expected, most of the variation (Wald chi-square = 1,797, 1 df) is due to gestational age (linear) as the fetus grows, and there is significant curvature (Wald chi-square = 207, 1 df). Country variation gives Wald chi-square = 36 (9 df); sex of the fetus, 29 (1 df); mother’s height, 26 (1 df); and mother’s age, 22 (1 df), while the Wald chi-square value for weight is negligible. In the same table, the level of significance is listed for these variables, e.g., p < 0.001 for country, highly significant. It is clear that variation due to country also occurs independently of maternal characteristics and the sex of the fetus. Fig 3 offers a visualization of country variation for the 10th, 50th, and 90th percentiles for EFW. Country variation in the other ultrasound parameters for the 10th, 50th, and 90th percentiles is presented in S2–S6 Figs. Country differences in EFW percentiles and overall EFW percentiles are presented in S4 Table.

The clinical relevance of the differences between the country quantiles and the global quantiles can be assessed in quantile–quantile plots (Fig 4). These plots are intended to enable the reader to derive the magnitude of difference in grams for any size and country and percentile. For example, consider the quantile–quantile plot for the individual country 0.05 quantile (i.e., the 5th percentile) for EFW versus the global 0.05 quantile: the 5th percentiles at low values of EFW cannot be differentiated because of the relative smallness of EFW at early pregnancy (Fig 4). However, at the end of gestation (high values of EFW), the 5th percentile for Norway is 3,200 g, while the overall 5th percentile is 2,800 g; for France it is 2,800 g, and for Egypt, 2,700 g. Similarly, it can be seen that while the 10th percentile for EFW at the end of gestation for Norway is 3,400 g, it is 2,700 g for India (versus about 3,100 g for the global 10th percentile), showing that a fetus weighing 3,200 g would be below the 10th percentile for Norway but well above it for India. The magnitude of the differences among countries can also be appreciated in Fig 5, where selected country percentiles are shown with the corresponding global percentile curve.


Maternal age and maternal height
Maternal age and height seem to be associated with a positive effect on EFW, especially in the lower tail of the distribution, significant at the 5% level, of the order of 2% to 3% for each additional 10 y of age of the mother and 1% to 2% for each additional 10 cm of height (S1D and S1F Fig, without adjusting for country differences).
Maternal weight
Maternal weight seems to be associated with a small positive effect on EFW, especially in the higher tail of the distribution, significant at the 5% level, of the order of 1% to 1.5% for each additional 10 kg of weight of the mother (S1E Fig, without adjusting for country differences).
Parity (0 versus ≥1)
Parous women had heavier fetuses than nulliparous women, with the disparity being much higher in the lower quantiles of the distribution, of the order of 1% to 3%, significant at the 5% level, and subsiding in the upper quantiles (S1C Fig, without adjusting for country differences).
Influence of Clinical Conditions on Growth Percentiles
Participants for whom clinical conditions occurred during pregnancy and childbirth were retained in the study. We then assessed the effect of excluding them on the parameter estimates of the quantiles. We excluded successively maternal conditions, fetal malformations, and neonatal conditions and assessed the fit for the global EFW percentiles. The parameter estimates obtained were indistinguishable.
In order to illustrate variation of the clinically relevant 10th and 90th percentiles for EFW, we compiled the values (without any formal comparison) for 24, 28, 32, and 36 wk of gestation from the present study, the NICHD Fetal Growth Studies [19], a study from D. R. Congo [30], and another study from Norway [31] (Table 16). Since the other existing multinational study, the Fetal Growth Longitudinal Study of the Intergrowth-21st Project, did not publish EFW but rather AC, which is a major determinant for EFW, we also compiled 10th and 90th percentiles for AC from relevant studies [18,19,30,32–34] (Table 17).


Discussion
In this paper we present the WHO fetal growth charts for EFW and common ultrasound biometric measurements intended for international use. They reveal a wide range of variation in human fetal growth across different parts of the world. Significant differences in fetal growth between countries are confirmed by differences in birthweight. Furthermore, the study shows that intrauterine growth is influenced by fetal sex and by maternal age, height, weight, and parity, although these influences explain only partially the differences in growth between countries.
The primary motivation for this study, the fetal component of the WHO Multicentre Growth Reference Study [11], was the need for clinical reference intervals applicable internationally, including for areas of the world where perinatal morbidity and mortality are high, hence the multinational design. Driven by the same motivation, we prioritized ultrasound measurements in common clinical use worldwide, the most prominent being EFW (Fig 1; Table 11). The use of estimated weight in grams is simple and intelligible, which enhances clinical management, facilitates communication within the health care system, and is valuable when counselling patients. In addition to the other common measurements in daily use (BPD, HC, AC, and FL) (Fig 1; Tables 6–9), we established reference intervals for the ratios FL/HC and FL/BPD aimed at facilitating the identification and monitoring of disproportionate fetal head development, e.g., hydrocephaly or microcephaly (Fig 1; Tables 12 and 13). The diagnosis in pregnancies complicated by such conditions is often hampered by uncertainty about gestational age since head size (BPD and HC) is also commonly used for the dating of the pregnancy. FL/HC and particularly FL/BPD are less dependent on gestational age after 20 wk of gestation (Fig 1) and may therefore have diagnostic utility.
A strength of the new growth charts provided by the study (Tables 6–15) is that they are based on multinational data, i.e., ten countries, and therefore are more likely to be applicable internationally than previously published reference intervals for EFW based on single countries. A recent sizeable study found significant variation in fetal growth between Asian, black, Hispanic, and white ethnic groups, with Asian fetuses being the smallest and white fetuses the largest, justifying ethnic-specific growth charts [19]. However, that study was confined to the US. Table 16 demonstrates the relation between studies for the clinically important 10th and 90th percentiles for EFW. The WHO growth chart for all countries lies in the middle of them. Although the present study was not designed to investigate ethnic differences, a limited record of participants’ ethnicity showed a distribution largely according to country (Table 2). Interestingly, there was a significant difference in the growth of EFW between countries that was not explained by maternal factors (Fig 3; S2 Table). While ethnic differences may play a role in this variation, as for the US-based study [19], variation could also be due to differences in diet and cultural and socioeconomic factors commonly associated with particular ethnic groups. These may also have played a role in the US-based study.
Another recently published multinational study by the Intergrowth-21st Project presented biometric growth but not EFW data [18]. We therefore present variation in AC, which is closely linked to EFW and is an important predictor of perinatal outcome [6], for the commonly used cutoffs, the 10th and 90th percentiles (Table 17). Interestingly, the 10th percentile for the Intergrowth-21st Project results seems to fall below that of the WHO study, even though the Intergrowth-21st Project study was carried out according to a strictly “prescriptive” concept to establish so-called optimal fetal growth (low-risk pregnancies with no environmental and nutritional constraints, and excluding all conditions during pregnancy and childbirth that may be associated with effects on fetal growth). The WHO study had a similar recruitment but retained in the analysis pregnancies with maternal, fetal, and neonatal clinical conditions, based on the principle that reference intervals should reflect as closely as possible the population to which they will be applied. Furthermore, we assessed the effect of removing such pregnancies from the dataset and found no identifiable effect on the percentiles. As seen from Table 17, it is as if rigorous selection and exclusions have limited effect, and other uncontrolled factors are responsible for the variation between studies and countries. Apart from random error, systematic error due to differences in ultrasound measurement techniques could influence the differences between the studies. However, these studies had well-trained ultrasound operators specifically instructed for the research procedure using internationally accepted techniques, and this should minimize such error.
Another strength of the present WHO study is the use of quantile regression to establish the reference intervals. Quantile regression makes an inference about regression coefficients for the conditional quantiles of a variable without making assumptions about its distribution: there is no need to assume a particular distribution and to estimate its moments. In consequence, it provides a more direct representation of the observed measurements. This is nicely demonstrated in a recent large study establishing population-specific fetal growth charts [35]. The technique is especially useful when the quantiles vary differently with a covariate such as, in the present study, gestational age. In addition, the method is robust against the effect of outliers and can capture important features of the data that might be missed by models that average across the conditional distribution [25].
Quantile regression is particularly useful in studying distribution changes, and shows in the present study that fetal growth in the population is not symmetrical with gestation. Starting with a higher distribution towards the lower percentiles, EFW shifts to an expanded distribution among the higher percentiles and ends with a noticeable asymmetry near term. The Bowley coefficient for asymmetry changed from −0.016 to +0.111 during that period. We are not sure of the nature of the small negative asymmetry in early pregnancy, but speculate that regulatory functions, such as the process of maternal constraint of fetal growth, change through gestation, i.e., fetuses in the higher percentiles may be exposed to greater influences, which vary with maternal characteristics. This corroborates the differential effects of covariates across the percentiles shown in S1 Fig. We believe that studying distribution dynamics may yield more information on the control of fetal growth.
The study confirmed the biologically interesting facts that fetal sex and maternal height, weight, parity, and age significantly influence fetal growth [31,36,37]. Together with the country differences, the ethnic differences shown in the US population [19], and, not least, the substantial variation in birthweight among carefully selected low-risk pregnancies, these findings document a diversity and plasticity in human prenatal growth dynamics that is only partially understood. There is increasing evidence linking fetal development, and proxies of development such as birthweight, to postnatal health and life course risk of disease [7,9]. This issue is prioritized by the UN and WHO at a time when noncommunicable diseases are becoming global epidemics [10,38]. For example, in our study, birthweights in India were significantly lower than in the other countries, and Indian participants also had the lowest fetal growth and were the shortest mothers. It is known that body composition in Indian newborns contains relatively more fat [39], a pattern that passes across generations [40] and that is linked to increased risk of subsequent type 2 diabetes [41]. It seems clear that the understanding of “optimal” fetal growth needs to incorporate more than birthweight.
To have a single fetal growth chart that fits all pregnancies across the world would require that all fetuses had the same genetic background for growth, that this genetic background was reliably expressed in the mother, and that influences such as nutrition, physical activity, stress, toxicants, and other environmental conditions had similar effects on the genotype in all embryos and fetuses. This is very unlikely: recent research has revealed a range of interactions between the developmental environment and genetic and epigenetic processes [9]. Even influences on fetal growth classically thought to be primarily genetic, such as maternal and paternal height, are complicated by environmental factors. Altitude, climate, geography, other environmental conditions, and the challenges of daily life and nutrition vary around the world. Humans adapt across generations to local conditions, and fetal development adds an important adaptive refinement for the next generation. Secular changes in birthweight and child growth patterns have been shown to accompany social changes [42,43]. Fetal growth charts may thus need to be adjusted to fit the diversity of individuals and populations if they are to be of the greatest clinical utility.
While including ten countries in the present WHO study was a strength compared to previous studies, it still has limitations. The ten population samples, including two in South-East Asia and two in Africa, were included to increase generalizability, but they are still a very limited sample of the global human population. Africa alone has a greater genetic diversity than has the rest of the world [44], and anthropometric variation on that continent is substantial. The present study showed population differences within the pooled dataset, and so the extent to which the results can be extrapolated to other populations, which possibly have other growth dynamics, is at present unknown.
A limitation of the study is that ultrasound measurements were accompanied by a corresponding gestational age exposed on the screen, which could have led to undue changes in the management of the pregnancy and pregnancy duration. However, it was common practice among the sonographers and midwives doing the examination not to pay attention to this gestational age because the department was using other reference values than the one on the screen. On the other hand, part of the ethical commitment of the study was actually to let the mother be informed of any abnormality or deviation of importance discovered, so that it could be taken into account for the management of the pregnancy, and to refer the case to the managing clinician. However, the reported referrals were few and were found not to influence the statistics.
Pooling data is not ideal in the presence of variation among populations, and a single overall growth chart will only partially reflect the individual populations included. Figs 4 and 5 show the variation of country-specific percentiles compared with the corresponding overall percentiles of the study and provide an opportunity to assess the magnitude and clinical relevance of the observed variation. Tables 16 and 17 illustrate a similar pattern when compiling the 10th and 90th percentiles for EFW and AC from various relevant high-quality studies available for clinical use. Although no formal statistical comparison was undertaken, the results of these studies illustrate the distribution that can be found around the world. This gives an impression of a wider spread for the 90th percentile than for the 10th. A similar pattern is found within the WHO study itself: a more obvious diversity between the countries for the 90th percentile than for the 10th percentile (Fig 3). As seen from these figures, variation between countries may increase to several hundred grams towards the end of pregnancy, and may cause misclassifications when the overall percentile is used. Secondly, it seems that population variation in growth is more reflected in the 90th percentile than in the lowest percentiles. Thus, it is possible that the 10th, 5th, and 2.5th percentiles of a pooled study are more universally applicable, while the upper percentiles—90th, 95th, and 97.5th—vary more according to population characteristics and accordingly will be more in need of adjustment, i.e., customization, for use at the population level [37].
It follows that whenever the WHO growth charts, or any reference intervals, are applied to a population, their performance should be checked or tested in order to ensure appropriate use. It is possible to adjust them by changing cutoffs (e.g., from 10th to 5th percentile) to fit clinical needs better, and it is possible to customize the percentiles to country, maternal characteristics, and fetal sex to improve diagnostic performance [45]. A further refinement would be to introduce conditioning terms when using repeated ultrasound measurements for monitoring growth [46,47], i.e., narrowing the expected reference interval for an assessment by conditioning it using a previous measurement. WHO is working on these methods to make them generally available with the growth chart.
If such adjustments and refinements do not suffice to make the growth charts fit clinical needs appropriately, then it may be necessary to establish new high-quality reference intervals for a population. For example, the WHO growth charts and many others are based on populations living at altitudes < 1,500 m. However, millions of people live at higher altitudes, and their physiological adaptations include pregnancy and fetal development. It might be that specific charts will be needed for such populations.
The concept of a “standard,” whether international or national, is often used for instruments and methods to make procedures uniform and to reduce random and systematic error, rather than to set a standard for a biological parameter such as height or bodyweight for the population globally. We are inclined to the view that, while the methodology to define reference ranges or charts for fetal growth needs to be standardized, fetal growth itself is a biological parameter expected to reflect adaptive processes and to change with development, time, location, and environmental conditions. Variation in fetal growth within and between populations should therefore not be ignored.
To apply any growth chart sensibly requires insight, critical attitude, and pragmatism. We believe that the present WHO fetal growth charts can be used internationally, particularly where no local data exist. However, once they are in use, it will be prudent to test the performance of the charts in a particular setting in case adjustments, customization, or replacement with population-specific high-quality reference intervals is needed. With the currently varying degrees of resources, health, and needs around the world, health care professionals have the responsibility of fitting and refining the use of the fetal growth charts to best serve the population in their care.
Supporting Information
Zdroje
1. Department of Economic and Social Affairs of the United Nations Secretariat. The Millennium Development Goals report 2015. New York: United Nations; 2015.
2. United Nations Foundation. Every Woman Every Child. 2016 [cited 2016 July 5]. Available from: http://www.everywomaneverychild.org/.
3. World Health Organization. Global Health Observatory (GHO) data: neonatal mortality. Geneva: World Health Organization; 2016 [cited 2016 Dec 22]. Available from: http://www.who.int/gho/child_health/mortality/neonatal/en/.
4. Lawn J, Cousens S, Zupan J, Lancet Neonatal Survival Steering Team. 4 million neonatal, deaths: when? Where? Why? Lancet. 2005;365(9462):891–900. doi: 10.1016/S0140-6736(05)71048-5 15752534
5. Katz J, Lee A, Kozuki N, Lawn J, Cousens S, Blencowe H, et al. Mortality risk in preterm and small-for-gestational-age infants in low-income and middle-income countries: a pooled country analysis. Lancet. 2013;382(9890):417–25. doi: 10.1016/S0140-6736(13)60993-9 23746775
6. Sovio U, White I, Dacey A, Pasupathy D, Smith G. Screening for fetal growth restriction with universal third trimester ultrasonography in nulliparous women in the Pregnancy Outcome Prediction (POP) study: a prospective cohort study. Lancet. 2015;386(10008):2089–97. doi: 10.1016/S0140-6736(15)00131-2 26360240
7. Gluckman P, Hanson M, Cooper C, Thornburg K. Effect of in utero and early-life conditions on adult health and disease. N Engl J Med. 2008;359(1):61–73. doi: 10.1056/NEJMra0708473 18596274
8. Barker DJ. The fetal and infant origins of disease. Eur J Clin Invest. 1995;25(7):457–63. 7556362
9. Hanson M, Gluckman P. Early developmental conditioning of later health and disease: physiology or pathophysiology? Physiol Rev. 2014;94(4):1027–76. doi: 10.1152/physrev.00029.2013 25287859
10. Balbus J, Barouki R, Birnbaum L, Etzel R, Gluckman PS, Grandjean P, et al. Early-life prevention of non-communicable diseases. Lancet. 2013;381(9860):3–4. doi: 10.1016/S0140-6736(12)61609-2 23290956
11. Aboderin I, Ben-Shlomo Y, Lynch J, Yajnik C, Kuh D, Yach D. Life course perspectives on coronary heart disease, stroke and diabetes: the evidence and implications for policy and research. Geneva: World Health Organization; 2002.
12. WHO Multicentre Growth Reference Study Group. WHO Child Growth Standards based on length/height, weight and age. Acta Paediatr 2006;450(Suppl):76–85.
13. Bhandari N, Bahl R, Taneja S, de Onis M, Bhan M. Growth performance of affluent Indian children is similar to that in developed countries. Bull World Health Organ. 2002;80(3):189–95. 11984604
14. Owusu W, Lartey A, de Onis M, Onyango A, Frongillo E. Factors associated with unconstrained growth among affluent Ghanaian children. Acta Paediatr. 2004;93(8):1115–9. 15456205
15. Júlíusson P, Roelants M, Hoppenbrouwers K, Hauspie R, Bjerknes R. Growth of Belgian and Norwegian children compared to the WHO growth standards: prevalence below −2 and above +2 SD and the effect of breastfeeding. Arch Dis Child. 2011;96(10):916–21. doi: 10.1136/adc.2009.166157 19948662
16. Christensen H, Pedersen B, Pournara E, Petit I, Júlíusson P. Short stature: comparison of WHO and national growth standards/references for height. PLoS ONE. 2016;11(6):e0157277. doi: 10.1371/journal.pone.0157277 27280591
17. Natale V, Rajagopalan A. Worldwide variation in human growth and the World Health Organization growth standards: a systematic review. BMJ Open. 2014;4(1):e003735. doi: 10.1136/bmjopen-2013-003735 24401723
18. Papageorghiou A, Ohuma E, Altman D, Todros T, Cheikh Ismail L, Lambert A, et al. International standards for fetal growth based on serial ultrasound measurements: the Fetal Growth Longitudinal Study of the INTERGROWTH-21st Project. Lancet. 2014;384(9946):869–79. doi: 10.1016/S0140-6736(14)61490-2 25209488
19. Buck Louis G, Grewal J, Albert P, Sciscione A, Wing D, Grobman W, et al. Racial/ethnic standards for fetal growth: the NICHD Fetal Growth Studies. Am J Obstet Gynecol. 2015;213(4):449.e1–41.
20. Merialdi M, Widmer M, Gülmezoglu A, Abdel-Aleem H, Bega G, Benachi A, et al. WHO multicentre study for the development of growth standards from fetal life to childhood: the fetal component. BMC Pregnancy Childbirth. 2014;14 : 157. doi: 10.1186/1471-2393-14-157 24886101
21. World Medical Association. WMA declaration of Helsinki—ethical principles for medical research involving human subjects. Ferney-Voltaire (France): World Medical Association; 2016.
22. Gibson R. Principles of nutritional assessment. Oxford: Oxford University Press; 1990.
23. Robinson H, Fleming J. A critical evaluation of sonar “crown–rump length” measurements. Br J Obstet Gynaecol. 1975;82(9):702–10. 1182090
24. Hadlock F, Harrist R, Sharman R, Deter R, Park S. Estimation of fetal weight with the use of head, body, and femur measurements—a prospective study. Am J Obstet Gynecol. 1985;151(3):333–7. 3881966
25. Wei Y, Pere A, Koenker R, He X. Quantile regression methods for reference growth charts. Stat Med. 2006;25(8):1369–82. doi: 10.1002/sim.2271 16143984
26. Koenker R, Bassett G. Regression quantiles. Econometrica. 1978;46 : 33–50.
27. Koenker R. Quantile regression. Cambridge: Cambridge University Press; 2005.
28. Koenker R, Bassett G. The asymptotic distribution of the least absolute error estimator. J Am Stat Assoc. 1978;73 : 618–22.
29. Bowley AL. Elements of statistics. London: P. S. King & Son; 1901.
30. Landis S, Ananth C, Lokomba V, Hartmann K, Thorp JJ, Horton A, et al. Ultrasound-derived fetal size nomogram for a sub-Saharan African population: a longitudinal study. Ultrasound Obstet Gynecol. 2009;34(4):379–86. doi: 10.1002/uog.6357 19402076
31. Johnsen S, Rasmussen S, Wilsgaard T, Sollien R, Kiserud T. Longitudinal reference ranges for estimated fetal weight. Ultrasound Obstet Gynecol. 2006;85(3):286–97.
32. Chitty LS, Altman DG, Henderson A, Campbell S. Charts of fetal size: 3. Abdominal measurements. Br J Obstet Gynaecol. 1994;101(2):125–31. 8305386
33. Johnsen S, Wilsgaard T, Rasmussen S, Sollien R, Kiserud T. Longitudinal reference charts for growth of the fetal head, abdomen and femurs. Europ J Obstet Gynecol Reprod Biol. 2006;127(2):172–85.
34. Sunsaneevithayakul P, Boriboonhirunsarn D, Siwadune T, Titapant V. Chart of Thai fetal biometries: 4. Abdominal circumference. J Med Assoc Thai. 2000;83 : 307–14. 10808686
35. Daniel-Spiegel E, Weiner E, Yarom I, Doveh E, Friedman P, Cohen A, et al. Establishment of fetal biometric charts using quantile regression analysis. J Ultrasound Med. 2013;32(1):23–33. 23269707
36. Gardosi J, Chang A, Kalyan B, Sahota D, Symonds E. Customised antenatal growth charts. Lancet. 1992;339(8788):283–7. 1346292
37. Gardosi J, Mongelli M, Wilcox M, Chang A. An adjustable fetal weight standard. Ultrasound Obstet Gynecol. 1995;6(3):168–74. doi: 10.1046/j.1469-0705.1995.06030168.x 8521065
38. King H, Aubert R, Herman W. Global burden of diabetes, 1995–2025: prevalence, numerical estimates, and projections. Diabetes Care. 1998;21(9):1414–31.
39. Yajnik C, Fall C, Coyaji K, Hirve S, Rao S, Barker D, et al. Neonatal anthropometry: the thin-fat Indian baby. The Pune Maternal Nutrition Study. Int J Obes Relat Metab Disord. 2003;27(2):173–80. doi: 10.1038/sj.ijo.802219 12586996
40. Fall C, Yajnik C, Rao S, Coyaji KJ. The effects of maternal body composition before pregnancy on fetal growth; the Pune Maternal Nutrition Study. In: Shaughn O’Brien P, Wheeler T, Barker D, editors. Fetal programming: influences on development and disease in later life. London: Royal College of Obstetricians and Gynaecologists; 1999. pp. 231–45.
41. Yajnik C. Early life origins of insulin resistance and type 2 diabetes in India and other Asian countries. J Nutr. 2004;134(1):205–10. 14704320
42. Oken E. Secular trends in birthweight. Nestle Nutr Inst Workshop Ser. 2013;71 : 103–14. doi: 10.1159/000342576 23502144
43. Mamidi R, Rajkumar H, Radhakrishna K, Babu J. Secular trends in heights and weights in boys and girls over 3 decades in rural India. Food Nutr Bull. 2016 May 13.
44. Campbell C, Tishkoff S. African genetic diversity: implications for human demographic history, modern human origins, and complex disease mapping. Annu Rev Genomics Hum Genet. 2008;9 : 403–33. doi: 10.1146/annurev.genom.9.081307.164258 18593304
45. Carberry A, Gordon A, Bond D, Hyett J, Raynes-Greenow C, Jeffery H. Customised versus population-based growth charts as a screening tool for detecting small for gestational age infants in low-risk pregnant women. Cochrane Database Syst Rev. 2014;5:CD008549.
46. Owen P, Ogston S. Conditional centiles for the quantification of fetal growth. Ultrasound Obstet Gynecol. 1998;11(2):110–7. doi: 10.1046/j.1469-0705.1998.11020110.x 9549837
47. Kiserud T, Johnsen S. Biometric assessment. Best Pract Res Clin Obstet Gynaecol. 2009;23(6):819–31. doi: 10.1016/j.bpobgyn.2009.06.007 19632901
Štítky
Interní lékařstvíČlánek vyšel v časopise
PLOS Medicine
2017 Číslo 1
- Alternativní léčebné možnosti u hypercholesterolemie při intoleranci statinů
- Vliv kombinace nutraceutik na remodelaci levé komory srdeční u osob s metabolickým syndromem
- Nutraceutika a jejich ovlivnění mírného kardiometabolického rizika
- Princip účinku medu v léčbě chronických i infikovaných ran
- Superoxidovaný roztok a jeho využití v léčbě ran
Nejčtenější v tomto čísle
- The World Health Organization Fetal Growth Charts: A Multinational Longitudinal Study of Ultrasound Biometric Measurements and Estimated Fetal Weight
- What Is the Purpose of the Orphan Drug Act?
- Population Pharmacokinetic Properties of Piperaquine in Falciparum Malaria: An Individual Participant Data Meta-Analysis
- Using Genetic Variation to Explore the Causal Effect of Maternal Pregnancy Adiposity on Future Offspring Adiposity: A Mendelian Randomisation Study