
Genetic and Structural Basis for Selection of a Ubiquitous T Cell Receptor Deployed in Epstein-Barr Virus Infection
Despite the ∼1018 αβ T cell receptor (TCR) structures that can be randomly manufactured by the human thymus, some surface more frequently than others. The pinnacles of this distortion are public TCRs, which exhibit amino acid-identical structures across different individuals. Public TCRs are thought to result from both recombinatorial bias and antigen-driven selection, but the mechanisms that underlie inter-individual TCR sharing are still largely theoretical. To examine this phenomenon at the atomic level, we solved the co-complex structure of one of the most widespread and numerically frequent public TCRs in the human population. The archetypal AS01 public TCR recognizes an immunodominant BMLF1 peptide, derived from the ubiquitous Epstein-Barr virus, bound to HLA-A*0201. The AS01 TCR was observed to dock in a diagonal fashion, grasping the solvent exposed peptide crest with two sets of complementarity-determining region (CDR) loops, and was fastened to the peptide and HLA-A*0201 platform with residue sets found only within TCR genes biased in the public response. Computer simulations of a random V(D)J recombination process demonstrated that both TCRα and TCRβ amino acid sequences could be manufactured easily, thereby explaining the prevalence of this receptor across different individuals. Interestingly, the AS01 TCR was encoded largely by germline DNA, indicating that the TCR loci already comprise gene segments that specifically recognize this ancient pathogen. Such pattern recognition receptor-like traits within the αβ TCR system further blur the boundaries between the adaptive and innate immune systems.
Published in the journal:
. PLoS Pathog 6(11): e32767. doi:10.1371/journal.ppat.1001198
Category:
Research Article
doi:
https://doi.org/10.1371/journal.ppat.1001198
Summary
Despite the ∼1018 αβ T cell receptor (TCR) structures that can be randomly manufactured by the human thymus, some surface more frequently than others. The pinnacles of this distortion are public TCRs, which exhibit amino acid-identical structures across different individuals. Public TCRs are thought to result from both recombinatorial bias and antigen-driven selection, but the mechanisms that underlie inter-individual TCR sharing are still largely theoretical. To examine this phenomenon at the atomic level, we solved the co-complex structure of one of the most widespread and numerically frequent public TCRs in the human population. The archetypal AS01 public TCR recognizes an immunodominant BMLF1 peptide, derived from the ubiquitous Epstein-Barr virus, bound to HLA-A*0201. The AS01 TCR was observed to dock in a diagonal fashion, grasping the solvent exposed peptide crest with two sets of complementarity-determining region (CDR) loops, and was fastened to the peptide and HLA-A*0201 platform with residue sets found only within TCR genes biased in the public response. Computer simulations of a random V(D)J recombination process demonstrated that both TCRα and TCRβ amino acid sequences could be manufactured easily, thereby explaining the prevalence of this receptor across different individuals. Interestingly, the AS01 TCR was encoded largely by germline DNA, indicating that the TCR loci already comprise gene segments that specifically recognize this ancient pathogen. Such pattern recognition receptor-like traits within the αβ TCR system further blur the boundaries between the adaptive and innate immune systems.
Introduction
Epstein-Barr virus (EBV), also called human herpesvirus 4 (HHV-4), is a genetically stable agent that has slowly co-evolved with our species and its antecedents for millions of years. EBV is typically transmitted orally during childhood, propagates in B cells and epithelia, and is shed for the lifetime of the host. More than 90% of the world's population is infected with EBV. This mutual coexistence is not without heavy resource cost for the host. Large populations of CD8+ αβ T lymphocytes are deployed for the purposes of EBV surveillance and suppression. These populations peak during asymptomatic primary infection [1], acute infectious mononucleosis (AIM) [2] and old age [3]. Across the entire EBV proteome, one of the most immunogenic CD8+ T cell targets is the HLA-A*0201-restricted GLCTLVAML peptide derived from the BMLF1 protein (residues 280–288; herein referred to as GLC-A2). During primary infection, up to 11% of the total peripheral CD8+ T cell pool can be specific for GLC-A2 [4]; this response contracts to 0.5–2.2% of the peripheral CD8+ T cell pool during persistent infection [4], but can swell again to 10% in old age [3]. Given the high in vivo frequencies of this response and the ubiquity of both EBV infection and the HLA-A*0201 allele, it is unsurprising that GLC-A2 is one of the most studied HLA class-I target antigens. Interestingly, initial investigations into the clonotypic nature of the GLC-A2 response revealed that CD8+ T cells are deployed with a biased T cell receptor (TCR) repertoire [5], [6], [7], [8] that is stable over time [9].
The TCR is a clonotypic, membrane-bound receptor that binds peptide-MHC (pMHC). Genetically, TCRs are rearranged into α - and β-chains from a selection of 176 variable (V), diversity (D), joining (J), and constant (C) genes on chromosomes 7 and 14. Random recombination of these genes generates only 5–10% of the potential diversity within the TCR repertoire; exonucleolytic activity, random N nucleotide additions at the V(D)J junctions [10] and αβ chain pairing contribute the remainder. Theoretical TCR diversity in humans has been placed in the region of 1015–1020 unique structures [11], [12], [13], with direct in vivo estimates greater than 2.5×10⁷ unique structures [14]. Structurally, TCR α - and β-chains fold to expose six highly flexible complementary determining region (CDR) loops that can contact the pMHC binding face. The germline-encoded CDR1 and CDR2 loops, from the TRAV and TRBV genes, participate heavily in MHC contacts and occasionally peptide contacts. The variable CDR3 loops, which span the V(D)J joints, are key to TCR diversity and participate heavily in peptide contacts. TCRs dock with pMHC complexes in a roughly diagonal fashion, such that the CDR3α loops are placed over the peptide N-terminus and the CDR3β loops lie over the peptide C-terminus.
In spite of the universe of TCR options available to the immune system, some pMHC antigens provoke the emergence of biased and predictable repertoires (reviewed in [15], [16]). Accordingly, the CD8+ T cell response to the GLC-A2 antigen is seen to provoke type III and type IV TCR bias. Type III bias is defined by memory T cells bearing identical TCR receptor protein sequences, often encoded by redundant codons, found between individuals presenting a common pMHC antigen. Type IV bias is defined by memory T cells bearing near identical TCR receptor protein sequences, differing by only one or two residues in the CDR3 loop, found between individuals presenting a common pMHC antigen. GLC-A2-specific responses exhibit biased usage of the TRBV20-1, TRBJ1-2, TRAV5, and TRAJ31 genes and conserved CDR3 amino acid usage and length. We recently undertook a large scale ex vivo TCR sequencing analysis (754 transcripts), as well as a meta-analysis, of the GLC-A2 response and found that the most frequently shared (public) receptor comprised the above genes with the CDR3α and CDR3β core sequences CAEDNNARLMF and CSARDGTGNGYTF, respectively [17].
In order to gain insight into the structural basis underlying the emergence of this ubiquitous αβ receptor, we solved the structure of an archetypal GLC-specific TCR, derived from the CD8+ T cell clone AS01, in complex with the GLC-A2 antigen. In parallel, we performed a detailed thermodynamic dissection of the complex and identified key TCR contact hotspots via a biophysical mutagenesis scan. To investigate the genetic basis behind the dominant selection of the receptor, we performed computer simulations of a random V(D)J recombination process to assess the ease and frequency of manufacture. Herein, we describe the structural and genetic basis for the dominance of the AS01 TCR in EBV-infected humans.
Results
Overview of AS01-GLC-A2 complex
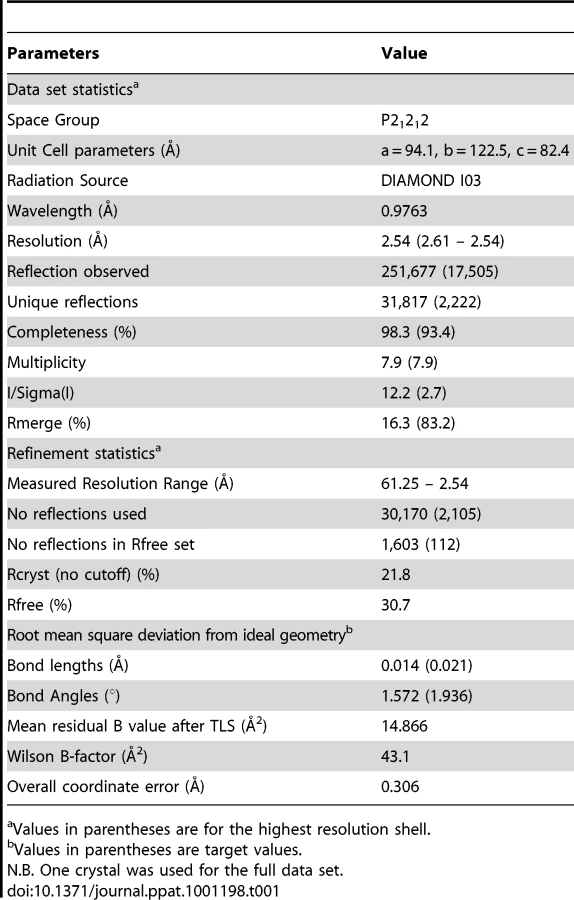
The structure of the AS01-GLC-A2 complex was determined to a resolution of 2.54 Å (Table 1). The final model had Rfree of 30.7% and Rcryst of 21.8%. The ratio, Rcryst/Rfree, falls within the accepted limits shown in the theoretically expected distribution [18]. The AS01 TCR was centrally perched on the GLC-A2 molecule over the exposed residues of the GLC peptide (Figure 1). As illustrated in Figure 2A, AS01 bound in a canonically diagonal fashion and was observed to dock at an angle of 41.7°, as calculated by the proposed TCR/pMHC crossing angle standard [19]. This crossing angle falls within the range of previous human TCR/pMHC class-I (pMHC-I) complexes (34°–80°, average 52.5°). The central residues of the GLC peptide bulged out from the MHC surface in the classical fashion. Unusually, however, Leu at residue P5, typically one of the most exposed regions of pMHC-I 9-mer peptides, was pulled down into the MHC cleft, kinking the backbone and making the adjacent residues, Thr at P4 and Val at P6, more solvent exposed (Figure 2B). The CDR1α/CDR3α loops and CDR1β/CDR3β loops were positioned on either side of the exposed peptide residues at P4 and P6, clasping each side of the peptide bulge (Figure 2C and 2D). The CDRα and CDRβ loops, as well as framework (FW) residues, shared in fastening the AS01 TCR to the MHC α-1 and α-2 helices (Figure 2E and 2F). A total of 20 contacts were made at the TCR/pMHC interface, comprising 4 peptide contacts and 16 MHC contacts (Table 2). This is the second lowest number of contacts observed across all human TCR/pMHC complexes to date [19], [20], [21], [22]. However, the total buried surface area (BSA) of the AS01-GLC-A2 complex was 2134 Å2, which falls within the normal range of previous human TCR/pMHC-I complexes (1471–2452 Å2, mean 1992 Å2) (Table 3; Figure 2A).


Structural basis underlying AS01 selection
The CD8+ T cell response to the GLC-A2 antigen exhibits Type III and Type IV bias in vivo, with identical or near identical TCRs within and between individuals [6], [7], [15], [16], [17]. The AS01-GLC-A2 structure provides insight into the selection of this public TCR. First, selection of the TRAV5 gene can be accounted for by the presence of the Thr31-Try32 residue pair at the tip of the CDR1α loop (Figure 2E). These residues fix AS01 to the MHC α-2 helix via hydrogen bonds with Thr163 and with the mobile ‘gatekeeper’ Gln155 [23]. Engagement of the MHC α-2 helix is further strengthened through FW residues within the TRAV5 gene-encoded chain. Tyr49 and Lys69 can be seen to form a hydrogen bond and salt bridge with Glu154 and Glu166, respectively (Figure 2E). In addition, Tyr32 in the CDR1α loop also assists in peptide recognition through a van der Waals interaction with Thr4 (Figure 2C). Of the 47 TRAV genes available for recombination, only the TRAV5 gene encodes a Thr-Tyr pair in the CDR1α loop and only TRAV5 encodes Tyr49 and Lys69 within the FWα region. The germline origins of these peptide contacts, as well as all TCR-peptide contacts, are shown in Figure 2G. Second, selection of TRAJ31 over 56 other TRAJ gene options can be accounted for by the presence of Arg97 and the Asn94-Asn95 pair within the CDR3α core. The two Asn residues form a structural arch that stabilizes the CDR3α loop above the first peptide backbone hump residue at P4. Arg97 acts as a “hook” to stabilize the arch in a raised manner above Thr4. The raised CDR3α lip allows Asp93 to lie precisely level with Thr4 to form a hydrogen bond (Figure 2C). Only the TRAJ31 gene encodes the Asn94, Asn95 and Arg97 pattern in the joining segment. Third, selection of TRBV20-1 over the other 53 TRBV genes can be accounted for by gene-specific interactions. Asn52 and Glu53 at the tip of the CDR2β loop engage Gln72 and Arg75 of the MHC α-1 helix, respectively, through a van der Waals interaction, a hydrogen bond and a salt bridge (Figure 2F). Glu60, in the FWβ region, forms a salt bridge with Arg65 (Figure 2F). A peptide-specific interaction is achieved via Thr32 in the CDR1β loop, which engages Met8 through a van der Waals bond (Figure 2D). Genetically, a small number of TRBV genes encode an Asn-Glu pair in the CDR2β but only TRBV20-1 encodes both the CDR2β Asn-Glu pair as well as FWβ Glu60 and CDR1β Thr32. Fourth, the importance of the contribution of the TRBD1 gene is highlighted by the contacts made through Thr101, which is TRBD1-encoded. Thr101 makes a hydrogen bond with Met8 of the peptide (Figure 2D). Finally, selection of TRBJ1-2 over the other 12 TRBJ gene options can be accounted for by the Tyr105-Thr106 pairing in the CDR3β loop terminus. Tyr105 forms a hydrogen bond with Arg98, found at the beginning of the CDR3β sequence. This internal brace stabilizes the entire loop structure. It is of particular interest that only the TRBV20-1 gene encodes Arg at this position. Thr106 also has an important internal structural function, stabilizing the β-barrel formation through a methyl interaction with Phe29 of the CDR1β. It is of additional note that only TRBV20-1 encodes Phe at this position when compared to all available 54 CDR1β loops. To conclude, only TRBJ1-2 encodes a Tyr-Thr pair within the joining gene area, underlying its genetic preference associated with TRBV20-1 in the public receptor.
Binding affinity and thermodynamics of the AS01-GLC-A2 complex
To complement information gained from the crystal complex, we dissected in detail the affinity and thermodynamics of the public AS01 TCR. To achieve this, the binding strength of the AS01-GLC-A2 complex was measured at 5, 12, 19, 25 and 37°C using surface plasmon resonance (SPR). At 25°C, the KD of the complex was 8.1 µM (Figure 3; Figure S1). This baseline affinity falls within the range of previously published human TCR/pMHC-I complexes (0.1–100 µM) and is typical of human TCR/pMHC-I complexes from viral systems (0.1–21 µM) [19], [24], [25] (Table 3). Interestingly, we observed that the affinity of the AS01-GLC-A2 complex interaction decreased with increasing temperatures; thus, KD values gradually decreased from 4.7 µM at 5°C to 16.7 µM at 37°C (Figure 3A–G). This difference was mainly due to a much faster off-rate (Koff) at higher temperatures (Koff = 1.2 sec−1 at 37°C compared to 0.15 sec−1 at 5°C) (Figure 3H). Thus, at physiological temperature (37°C), the AS01 TCR binds with weaker affinity than at the standard measurement temperature (25°C). This difference may impact the antigen sensitivity of CD8+ T cells bearing this public receptor in vivo.

The affinity of an interaction can be represented as its binding free energy, ΔG° (ΔG° = -RTlnKD). This binding energy is the sum of enthalpic (ΔH) and entropic (−TΔS) components as calculated using the Gibbs-Helmholtz equation (ΔG° = ΔH − TΔS°), either of which can be favourable (act to increase the affinity) or unfavourable (act to decrease the affinity). The binding of proteins is also accompanied by a change in the heat capacity ΔCp°. In order to calculate ΔH°, TΔS° and ΔCp°, the binding constant data were subjected to van't Hoff analysis by plotting the binding ΔG° versus temperature (K) using nonlinear regression to fit the three-parameter equation to the curve (see Materials and Methods). The AS01-GLC-A2 interaction was characterized by a binding ΔG° of −6.9 kcal/mol at 25°C (the standard for measuring TCR/pMHC parameters [26]), which is within the normal range for TCR/pMHC interactions [27]. The energy of the interaction was probably derived primarily from a net increase in the formation of new noncovalent bonds (hydrogen bonds, salt bridges and van der Waals contacts) during complex formation, evident from the favorable enthalpy (ΔH° = −8.8 kcal/mol). Notably, this TCR/pMHC interaction is entropically unfavourable (TΔS° = −1.9 kcal/mol), although this value lies at the lower end of the scale of published TCR/pMHC entropic values (−0.4 to −29 kcal/mol) [27]. The relatively small ΔCp° value of −0.4 kcal/mol·K is within the range of other TCR/pMHC complexes [27] (Figure 3G), which conforms with the normal SC value for this complex. Next, we investigated the thermodynamic properties of the AS01-GLC-A2 complex at the physiologically relevant temperature of 37°C. At this temperature, the binding free energy (ΔG° = −6.8 kcal/mol) was very similar to the binding energy observed at 25°C (ΔG° = −6.9 kcal/mol). However, at 37°C, the interaction was driven strongly by enthalpy, evident from the decrease in ΔH° to −14.1 kcal/mol (37°C) (Figure S3). This resulted in a larger entropic cost to complex formation (TΔS° = −7.3 kcal/mol). Thus, at 37°C, the interaction between the AS01 TCR and GLC-A2 is more enthalpically driven, with a greater entropic penalty, compared to 25°C.
Verification of TCR binding hot spots
The AS01-GLC-A2 structure indicated that Thr4, Val6 and Met8 of the peptide are important for TCR docking. Indeed, the AS01 TCR contacts only these residues in the peptide. To verify the importance of these contact areas, we performed an Ala mutagenesis scan across the peptide backbone and evaluated the capacity of the pMHC-I mutants to bind the AS01 TCR using SPR (Figure 4; Figure S2). As peptide positions P1, P2 and P9 are often buried and/or important for MHC binding, we focused on assessing the solvent exposed positions P3, P4, P5, P6 and P8. We did not assess P7, as this residue is Ala in the native sequence. As expected, given that no contacts were made with Cys3, mutation of P3 had a relatively small effect on TCR binding (∼5-fold reduction) (Figure 4). Conversely, mutation of Thr4 reduced AS01 TCR binding by more than 60-fold to 685.2 µM, presumably through loss of two side-chain contacts provided by the CDR1α and CDR3α loops. Interestingly, mutation at Leu5 resulted in a ∼17-fold reduction in affinity to 177 µM. While Leu5 is not a TCR contact residue, it does affect the total peptide backbone structure by providing a secondary anchor that results in a kink in the centre of the peptide backbone. This kink, made via hydrogen bonds with main chain atoms of Val152 and Leu156 of the MHC α-1 helix, pulls Leu5 into the MHC groove. In this conformation, Thr4 and Val6 form two “humps” on either side of Leu5. The mutation of Leu5 to Ala would probably result in the loss of this MHC anchoring and allow the peptide backbone to relax in the cleft. This backbone loosening would likely push Thr4 and Val6 into new conformations, resulting in the loss of original contacts. As expected, mutation of TCR contact residue Val6 resulted in a considerable reduction in affinity to 133.8 µM (∼13-fold). This affinity reduction is likely caused by the loss of two non-polar interactions between the Val6 side-chain atoms and the CDR3β loop. Finally, mutation of Met8 reduced the affinity of AS01 TCR binding to 43.9 µM. This modest effect can likely be explained by the loss of a single, side-chain-derived van der Waals bond with the CDR1β loop. The original hydrogen bond, formed by the CDR3β and the main-chain atoms of Met8, would likely remain when Met8 is mutated to Ala.

Surface complementarity (SC) preference of the AS01 TCR
The SC program, from the CCP4 suit [28], is able to index the binding potential of two molecules between 0.0 (no SC) and 1.0 (perfect SC). As well as overall SC, SC indices can be partitioned to different zones of the contact face. This can help specify where two molecules invest the bulk of their contact energies. We calculated the SC of the AS01 TCR between: (i) the whole GLC-A2 molecule; (ii) just the HLA A*0201 molecule; and, (iii) just the peptide (Table 3). We also extended this SC assessment to a full meta-analysis of all conventional human TCR/pMHC-I complexes solved to date (Table 3). Alloreactive structures were omitted from the meta-analysis. This review also included BSA and binding affinities of the complex set, as well as the number of contacts made between TCR and peptide within 3.4Å. The AS01-GLC-A2 complex exhibited a SC index of 0.640, which is average for TCR/MHC-I complexes (mean = 0.648). Interestingly, while the total pMHC-I SC appeared typical, the AS01 TCR revealed a SC preference for MHC-I (SC = 0.676) over peptide (SC = 0.577). The large majority of TCR/MHC-I complexes studied thus far reliably exhibit a higher SC index for peptide compared with MHC. In fact, only the JM22 TCR joins AS01 in this unusual, large-scale switch of region preference.
Convergent recombination potential of the AS01 TCR
Along with obvious structural features that promote AS01 selection, underlying genetic factors are likely to exist that elevate the frequency at which this receptor is manufactured. We have previously identified a process of convergent recombination that may enable some TCRs to be produced more efficiently than others [29]. Using computer simulations of a random V(D)J recombination process we have demonstrated for numerous systems [17], [30], [31] that convergent recombination leads to large differences in TCR production frequencies, even in the case of completely unbiased gene recombination. These simulations account for the various mechanisms that contribute to the production of TCR nucleotide and amino acid sequences, including TRV, TRD and TRJ gene splicing, N nucleotide additions, recurrent CDR3 motifs and codon redundancy. We have previously shown that the public TCR β-chain (TRBV20-1/CSARDGTGNGYTF/TRBJ1-2) is the most common chain used in vivo in the GLC-specific response and is the second most frequent GLC-A2-specific TRBV20-1/TRBJ1-2 chain made in silico by random gene recombination [17]. We have expanded this TCR β-chain analysis to include additional published clonotypes [6], [7] and confirm our previous results here (Figure 5C–D). In addition, we simulated the production of TCR α-chains using the TRAV5 and TRAJ31 genes to assess the relative production frequencies of GLC-A2-specific TCR α-chain sequences based on previously identified in vivo clonotypes [6], [7]. The simulation indicated that the public TCR α-chain (TRAV5/CAEDNNARLMF/TRAJ31) is the most efficiently produced TRAV5/TRAJ31 combination in the GLC-A2 response (Figure 5A–B), being generated ∼6 times more frequently in silico than the next most efficiently generated clonotype CAEIHARLMF. Aiding the ease of production, both the public TCR α - and β-chain amino acid sequences can be encoded by nucleotide sequences requiring few N nucleotide insertions The AS01 β-chain contains just 4 N nucleotide insertions, with only Asn103 being randomly encoded (Figure 5E). Furthermore, the AS01 TCR β-chain can been observed in vivo to be manufactured with just two N nucleotide additions (Figure 5F) [17]. The AS01 TCR α-chain contains just a single N nucleotide insertion, partially encoding Asp93.

Discussion
The archetypal AS01 TCR is likely to be one of the most common and numerically frequent αβ TCRs in humans. This is based on the following considerations: (i) the HLA-A*0201 allele is arguably the most common and widespread MHC-I allele in humans, with frequencies above 60% in certain regions [32]; (ii) EBV is one of the most successfully disseminated human pathogens, persistently infecting more than 90% of individuals [33]; (iii) the GLC-A2 antigen is one of the most immunodominant CD8+ T cell targets across the EBV proteome [4]; (iv) GLC-specific CD8+ T cell responses are amongst the largest observed, both in the EBV system and in comparative terms with respect to other human pathogens studied thus far [4]; and, (v) the GLC-specific response is dominated by CD8+ T cells that bear a public TRAV5/TRBV20-1 receptor [17].
Structurally, most features exhibited by the AS01 TCR are within the parameters previously seen in the TCR/pMHC-I system [19]. AS01 docks in a roughly diagonal fashion to the pMHC and is positioned centrally above the peptide. The TCR α-chain is positioned above the peptide N-terminus and the TCR β-chain is positioned above peptide C-terminus. The peptide is engaged chiefly by the CDR3 loops with additional support from the CDR1 loops. AS01 interacts with the MHC helices via residues within the CDR1 and CDR2 loops, which include bonds with universal MHC anchors Arg65 and Gln155. Gln155 is proposed to be a “gatekeeper” residue guiding MHC-I-restricted TCR recognition as it is universally contacted by all αβ TCRs studied to date and often switches conformation between bound and unbound forms [23], [34]. Interestingly, however, the AS01 TCR does not contact Arg69, which represents the third member of the classical MHC “restriction triad” [34]. Biophysically, the AS01 TCR binds GLC-A2 with a KD of 8.1 µM, which is typical for TCR interactions with viral MHC-I-restricted antigens [19], [24]. The AS01-GLC-A2 complex also has an average BSA (of 2134 Å2) that is within, if not towards the higher end, of the TCR/pMHC system. One notable structural trait of the AS01 TCR is its SC preference. The large majority of TCR/pMHC-I complexes have a peptide>MHC SC bias. This bias is inverted in the AS01-GLC-A2 complex. Again, interestingly, only the JM22 TCR, which is also public and HLA-A*02-restricted, exhibits this inverted preference. Ultimately though, this particular trait cannot be exclusively assigned to public TCRs since the RA15 and LC13 TCRs show conventional SC preference.
Thermodynamic analysis revealed that the interaction between the AS01 TCR and GLC-A2 was within the normal range of other reported TCR/pMHC interactions [27]. Importantly, the interaction was strongly enthalpically driven; thus, stabilization of the TCR/pMHC interface through the formation of noncovalent bonds is likely to be the chief factor driving complex formation. In addition, the complex exhibited unfavourable entropy, indicating that there was a net gain of order during TCR/pMHC binding. This observation indicates that the entropic energy generated by expulsion of solvent (ordered water molecules) upon complex formation is countered by the entropic energy penalty attributed to the conformational ordering of the TCR CDR loops and pMHC surface during docking. These data are in agreement with previous thermodynamic analyses of TCR/pMHC interactions, which show that the favorable enthalpic energy generated by the formation of a relatively large number of new contacts at the interface is countered by a large unfavorable entropic cost that results in a relatively weak binding affinity compared to other protein-protein interactions [27], [35], [36], [37]. Lastly, we investigated the thermodynamic properties of the AS01-GLC-A2 complex at the physiologically relevant temperature of 37°C. Notably, at 37°C, the interaction between the AS01 TCR and GLC-A2 was more strongly enthalpically driven, with a greater entropic penalty, compared to 25°C. Importantly, these differences in binding energy almost halved the affinity of AS01 TCR binding at 37°C compared to the standard measurement temperature of 25°C. Kinetic analysis revealed that the reduction in binding affinity was primarily attributed to a much faster off-rate at higher temperatures (Figure 3H). Thus, the AS01 TCR appears to bind less optimally to GLC-A2 at physiological temperatures (37°C) compared with the standard temperature used for SPR measurements in vitro (25°C).
The mutagenesis scan across the GLC peptide highlighted a number of critical zones for TCR recognition. As expected, mutation of the prominent peptide hump residues, Thr4 and Val6, resulted in 10–70 fold loss in affinity. A relatively surprising finding was the 17-fold loss in affinity following mutation of Leu5. Leu5 is not involved in TCR contacts and points down into the MHC cleft. Leu5 does, however, act as a secondary anchor for the GLC peptide, reinforcing the peptide backbone. Loss of this reinforcement would likely result in the peptide backbone ‘sinking’ into the MHC cleft, producing a less interactive interface. Recently seen in other systems [38], this observation highlights the importance of peripheral residues in TCR engagement. A note of broader interest is that every mutation along the GLC peptide resulted in a reduction of affinity (40 µM and above), whether within a TCR contact zone or not. TCRs specific for class-I-bound antigens of viral origin typically operate in the KD <10 µM range and none have been seen over 30 µM [24]. Thus, a mutation at any of these points could result in suboptimal engagement with the archetypal public TCR. This would likely result in either the public TCR being outcompeted by higher affinity options in vivo or a hole in the TCR repertoire and possibly a reduction in immunogenicity. Interestingly, there is no evidence that EBV attempts to escape from the GLC response, as seen by complete epitope conservation across all known strains and isolates (GeneBank). This is remarkable given the considerable genetic variation between EBV strains [39], [40] and within some T cell epitopes [41], [42], [43], [44]. It is certainly conceivable that EBV has at least some flexibility to mutate the GLC backbone without a significant loss of viral fitness. Hence, a question presents itself. Why does EBV not try to escape from one of the most potent T cell responses raised against it? In assessing this question, it is important to note that genetic evidence from EBV studies suggests that evolutionary pressure on T cell epitopes is directed towards their conservation rather than their inactivation [45]. This leads to speculation that epitope conservation may be advantageous to the virus. Thus, some highly immunogenic epitopes could be maintained deliberately to elicit large fleets of CD8+ T cells, perhaps to regulate viral replication, minimize pathology and maintain a peaceful coexistence with the host. Alternatively, the large T cell responses generated by these epitopes may aid the virus as bonus replicative tissue. In addition to the well established tropic tissues, B cells and epithelia, EBV has recently been found in several human tissues including T cells [46]. A related question is whether TCR affinity influences epitope variation. The affinity of the AS01 TCR, at physiological temperature, is in the lower half of the range reported for anti-viral TCRs to date [24]. Could this small decrease in relative affinity place less selection pressure on the GLC epitope? This is an interesting question. The answer is likely influenced by the intrinsic mutagenic potential of the epitope.
Genetically, the public AS01 TCR is primarily assembled from chromosome-derived DNA (Figure 5E). The TCR β-chain and TCR α-chain incorporate just 4 and 1 non-germline nucleotide/s, respectively. Only one residue in the receptor (Asn103β) is encoded wholly by non-germline DNA. Interestingly, in many individuals, Asn103β in the AS01 TCR is majority encoded by the TRBJ1-2 gene (Figure 5F) [17]. Thus every residue in the AS01 TCR can be wholly or partially encoded by germline DNA. This “germline-rich” feature of the TCR α-chain and TCR β-chain amino acid sequences of AS01 contributes towards the prediction that these are frequently produced by convergent recombination [30]. The public AS01 TCR comprises the TRBV20-1, TRBD1, TRBJ1-2, TRAV5 and TRAJ31 genes. Structural analysis revealed that each of these TR genes encode unique residue patterns that appeared specialized for the GLC-A2 ligand. Critical docking residues, found within the TCR/pMHC interface, were exclusively encoded by the TR genes listed above and were not resident in the other 168 genes available on the TCR α and β loci. Thus, this specific structural architecture required to preserve the AS01 docking mode explains the TRBV, TRBJ, TRAV, and TRAJ bias in the GLC-A2 CD8+ T cell response.
The AS01-GLC-A2 complex necessitates comparison with other published public TCR structures including the LC13 TCR [47] and the JM22 TCR [48]. The LC13 TCR is specific for the FLRGRAYGL (FLR) peptide from EBV and restricted by the HLA-B*0801 molecule. The LC13 TCR, composed of TRBV7-8/TRBJ2-7 and TRAV26-2/TRAJ52 gene products, is residue-identical between individuals (Type III bias) [49], [50], [51]. Intriguingly, the LC13 TCR is also heavily comprised of germline DNA. The TCR β-chain can be constructed wholly from germline DNA [49], [50], [51]. The TCR α-chain shows a similar degree of germline composition and only a single residue (Pro93) is encoded by DNA of non-germline origin. The TCR/pMHC complex reveals that the LC13 TCR engages its cognate ligand at a crossing angle of 42° [47], virtually identical to that of AS01. Also akin to AS01, the contact footprint was evenly split between the TCR α - and β-chains. The LC13 TCR was seen to adjust conformation during ligation, manoeuvring its CDR3 loops around two central solvent expose residues at P6 and P7. The AS01 TCR also engaged central residues of the peptide; however, it is unknown whether AS01 also undergoes conformational change upon ligation, as this would require the TCR structure in an unligated state. A structural basis underlying the selection of LC13 TCR was evident upon examination of the complex. Contact residues exclusively encoded by the constituent genes were critical for specific engagement [47], and mutation of these germline-encoded residues abrogated recognition [50]. Overall, the LC13 and AS01 TCRs exhibit close genetic and structural parallels. However, the investment of germline DNA composition alternates between the receptors. Thus, the LC13 TCR exhibits more germline composition on the β-chain compared with the α-chain. This pattern is inverted in the AS01 TCR. It is also worth noting that the HLA-B*0801 allele, to which the LC13 TCR is restricted, is arguably the most common HLA-B allele in Caucasian populations. The JM22 TCR is specific for the GILGFVFTL (GIL) peptide from the influenza virus and is restricted by the HLA-A*0201 molecule. In this response, gene bias is skewed to TRBV19 with a common Arg residue in the CDR3β loop [52], [53]. However, in contrast to the GLC - and FLR-responses, the GIL-specific repertoire is more variable and identical TCRs are not always apparent across individuals. A number of different TRBJ genes are used in the repertoire along with variation in CDR3β residue composition and CDR3β length [52], [53]. The paired TCR α-chain is also variable, with fluctuation in TRAV gene usage. In general, the GIL-specific response is an example of Type IV bias. The TCR/pMHC complex revealed that JM22 engages its cognate ligand at a crossing angle of 62° [48], which is more orthogonal compared with AS01. As suggested by the above mentioned gene bias, the contact footprint is considerably “β-centric”, with residues within the TRBV19-encoded CDR1 and CDR2 loops dominating pMHC engagement. This docking modality allowed the conserved Arg in the CDR3β loop to peg the TCR between the peptide and MHC groove. A detailed mutational analysis revealed that germline-encoded residues were critical for antigen specificity and, along with CDR3β Arg peg, it was hypothesized that the TRBV19 gene may have been evolutionary useful during recurrent influenza pandemics [54].
The germline-rich composition of the AS01 TCR draws parallels with the TCRs displayed by iNKT cells from the innate immune compartment. Here, the iNKT TCR α-chain (TRAV10/TRAJ18) can be manufactured wholly by germline DNA [55]. Structural analysis of an iNKT TCR bound to its cognate CD1d-α-GalCer ligand revealed that the receptor docks in a parallel fashion to the antigen cleft [56], a docking modality very different to the diagonal docking of AS01 and the other MHC-restricted receptors [19]. In this parallel docking mode, the CDR1α and CDR3α loops were seen to dominate the contact footprint across both CD1d and the antigen; the residues involved in these contacts were exclusively encoded by the TRAV10 and TRAJ18 genes, providing a structural basis for invariant gene bias. A further mutational study across the iNKT TCR confirmed the critical importance of these germline-encoded CDR1α and CDR3α residues for ligand recognition [57]. These studies reinforce the observation that extreme biases within TCR repertoire formation are likely shaped through highly specific structural requirements of the target ligand. The iNKT TCR differs from the AS01 TCR in that it that has an unprecedentedly small BSA (of 910Å2), likely as a result of the α-chain binding towards the terminus of the binding cleft. This binding mode pushes the β-chain towards the extreme end of the binding cleft and limits its role during engagement [56], [58], providing a structural basis for the highly diverse nature of the iNKT β-chain repertoire in vivo [55]. Conversely, the AS01 TCR α - and β-chains are both public, and the contact footprint is more evenly spread across both chains.
EBV has engaged our species and its antecedents for approximately 80 million years [59]. During this entwined co-evolution, countless immune assaults and counter-assaults would have been waged, with many genes formed and lost. Natural selection and hereditary transmission would have progressively bestowed useful genes for host defence and virus offence. It is likely that the 450 million year old combinatorial immune system [60], and more specifically the highly polymorphic TCR and MHC gene set, would have been intimately involved in this “arms race”. Thus, it is conceivable that public TCRs, such as AS01, may be very old defence structures, easily formed and found on the chromosome, that provide a naive pre-emptive defence net against almost-certain infection by primordial pathogens. Conversely, it could be argued public TCRs are simple by-products of biases in the V(D)J recombination system, according to which some receptor combinations leave the thymus more often than others. In conflict with this straightforward genetic hypothesis is the observation that some public TCRs exist with the same amino acid CDR3 sequences that are redundantly encoded by largely non-germline derived DNA [49]. This indicates that, during competitive antigen-driven selection, there is some structural advantage already encoded in the original germline sequence. That is, we appear to be born with αβ TCR fragments already lying in the chromosome that are exquisitely specific for EBV targets. Given the time scale of this conflict, it is intriguing to consider whether public TCRs have evolved to aid the host or EBV itself; perhaps they could even represent some middle ground that favours a largely peaceful coexistence? Ultimately though, the role of evolution in guiding this phenomenon is unknown and can only be conjectured. After all, these TRBV and TRAV gene segments are likely useful in defence against other pathogens. In addition, TCR variable genes appear to have an innate preference for MHC [61], so the idea of a germline receptor having both highly tuned specificity and broad cross-reactive potential is, while not strictly mutually exclusive, an interesting observation. Aside from the origins of the public receptor phenomenon, the AS01-GLC-A2 complex may provide a fascinating glimpse of an ancient immune battle, fought quietly and in the same way, possibly billions of times across the two hundred thousand years of homo sapiens history [62].
Materials and Methods
T cell clone generation and TCR isolation
The AS01 CD8+ T cell clone was generated from a healthy EBV+, HLA-A*0201+ individual as described previously [63]. Briefly, PBMC were stimulated with 1 µM GLCTLVAML peptide and cloned via limiting dilution. The AS01 TCR was identified as described previously [64]. Briefly, total RNA was extracted from 105 T cells using TRIzol reagent and a RT-PCR was performed using Superscript III (Invitrogen Life Technologies). PCR was performed using a panel of TRAV - and TRBV-specific primers and the product was cloned into the pGEM-T vector system (Promega). The TCR product was sequenced using the ABI PRISM Big Dye termination reaction kit (Applied Biosystems) and the sequences were defined according to the international ImMunoGeneTics database (IMGT) TCR gene nomenclature [65].
Generation of expression plasmids
The HLA-A*0201 (A2) α-chain and β2m sequences were generated by PCR mutagenesis (Stratagene) and PCR cloning. All sequences were confirmed by automated DNA sequencing. A disulphide-linked construct was used to produce the soluble domains (variable and constant) for both the TCR α - and β-chains [66], [67]. The soluble A2 α-chain (α-1, α-2 and α-3 domains) was tagged with a biotinylation sequence. All 4 constructs, TCRα, TCRβ, A2-tagged and β2m, were inserted into separate pGMT7 expression plasmids under the control of the T7 promoter [66].
Protein expression, refolding and purification
Competent Rosetta DE3 E.coli cells were used to express the TCRα, TCRβ, A2-tagged and β2m proteins in the form of inclusion bodies (IBs) as described previously [66]. For a 1L TCR refold, 30 mg of AS01 α-chain IBs were incubated at 37°C for 15 mins with 10 mM DTT and added to cold refold buffer (50 mM TRIS pH 8.1, 2 mM EDTA, 2.5 M urea, 6 mM cysteamine hydrochloride and 4 mM cystamine). After 15 mins, 30 mg of AS01 β-chain, incubated for 15 mins at 37°C with 10 mM DTT, was added. For a 1 L GLC-A2 refold, 30 mg of A2 α-chain was mixed with 30 mg of β2m and 4 mg of the GLCTLVAML peptide (or GLC mutants) for 15 mins at 37°C with 10 mM DTT. This mixture was then added to cold refold buffer (50 mM TRIS pH 8, 2 mM EDTA, 400 mM L-arginine, 6 mM cysteamine hydrochloride and 4 mM cystamine). Refolds were mixed at 4°C for 1 hr. Dialysis was carried out against 10 mM TRIS pH 8.1 until the conductivity of the refolds was under 2 mS/cm. The refolds were then filtered and purified. Primary purification was conducted using an ion exchange (Poros50HQTM) column and secondary purification was conducted using a gel filtration (Superdex200HRTM) column. The protein was purified using either BIAcore buffer (10 mM HEPES pH 7.4, 150 mM NaCl, 3 mM EDTA and 0.005% (v/v) Surfactant P20) or crystallization buffer (10 mM TRIS pH 8.1, 10 mM NaCl). Protein quality was analyzed by Coomassie-stained SDS-PAGE.
SPR analysis
Binding analysis was performed independently using a BIAcore 3000 and a BIAcore T100 equipped with a CM5 sensor chip as reported previously [68]. Between 200 and 400 response units (RUs) of biotinylated pMHC was immobilized to streptavidin, which was chemically linked to the chip surface. The pMHC was injected at a slow flow rate (10 µl/min) to ensure uniform distribution on the chip surface. Combined with the small amount of pMHC bound to the chip surface, this reduced the likelihood of off-rate limiting mass transfer effects. AS01 TCR was concentrated to 100 µM on the same day of SPR analysis to reduce the likelihood of TCR aggregation affecting the results. For equilibrium and kinetic analysis, ten serial dilutions were carefully prepared in triplicate for each sample and injected over the relevant sensor chips at 25°C. AS01 was injected over the chip surface using kinetic injections at a flow rate of 45 µl/min. For thermodynamic experiments, this method was repeated at the following temperatures: 12°C, 19°C, 25°C, 32°C, and 37°C. Results were analyzed using BIAevaluation 3.1, Microsoft Excel and Origin 6.1. The equilibrium binding constant (KD) values were calculated using a nonlinear curve fit (y = (P1x)/(P2 + x)). The thermodynamic parameters were calculated according to the Gibbs-Helmholtz equation (ΔG° = ΔH − TΔS°). The binding free energies, ΔG° (ΔG° = -RTlnKD) were plotted against temperature (K) using nonlinear regression to fit the three-parameter equation, (y = dH+dCp*(x-298)-x*dS-x*dCp*ln(x/298)), as reported previously [69].
Simulation of V(D)J recombination
The process of convergent recombination encompasses the production of an amino acid sequence by a variety of nucleotide sequences and the production of a nucleotide sequence by a variety of recombination mechanisms (i.e. different germline gene contributions and nucleotide additions) [17], [29], [30], [31]. It also accounts for the frequent occurrence of some V(D)J recombination events due to the involvement of fewer nucleotide additions. To quantitatively assess the collective contribution of these various elements of convergent recombination in enhancing the production frequency of some TCR amino acid clonotypes relative to others in the absence of recombination biases, we used computer simulations of a random V(D)J recombination process [30] to estimate the relative production frequencies of the observed GLC-specific TCR amino acid clonotypes. The maximum number of nucleotide deletions from the ends of the TCR genes and the maximum number of nucleotide additions considered in the simulations were chosen to allow for the production of the majority of observed TCR sequences. For the TRAV5/TRAJ31 clonotypes, the simulated VJ recombination process allowed up to 10 nucleotide deletions from the 3′ end of the TRAV5 gene, up to 16 deletions from the 5′ end of the TRAJ31 gene, and up to 16 nucleotide additions. For each simulated TCR sequence, the number of nucleotide deletions from the 3′ end of the TRAV5 gene, the number of nucleotide deletions from the 5′ end of the TRAJ31 gene, and the number of nucleotide additions were determined from uniform distributions of the numbers of nucleotide deletions and additions. The nucleotide base of each of the nucleotide additions was randomly chosen. A total of 10 million in-frame TRAV5/TRAJ31 sequences were simulated. The computer simulations were performed using Matlab 7.9.0 (The Mathworks, Natick, MA).
Crystallization, diffraction data collection and model refinement
AS01-GLC-A2 crystals were grown at 18°C by vapour diffusion via the hanging drop technique. 200 nL of 1∶1 molar ratio TCR and pMHC-I (at 10 mg/ml) was added to 200 nL of reservoir solution. Optimal crystals were obtained with 0.16 M calcium acetate hydrate, 0.08 M sodium cacodylate pH 6.0, 12.5% polyethylene glycol (PEG) 8000 and 20% glycerol. Data were collected at 100 K on beamline IO3 at the Diamond Light Source (DLS), Oxfordshire, UK. The AS01-GLC-A2 complex dataset was collected at a wavelength of 0.976Å using an ADSC Q315 CCD detector. Reflection intensities were estimated with the MOSFLM package [70] and the data were scaled, reduced and analyzed with SCALA and the CCP4 package [28]. The structure was solved with Molecular Replacement using AMORE [71] . The model sequence was adjusted with COOT [72] and the model refined with REFMAC5 [73]. Graphical representations were prepared with PYMOL [74]. Data reduction and refinement statistics are shown in Table 1. The reflection data and final model coordinates were deposited with the PDB database, assigned accession code 3O4L.
Supporting Information
Zdroje
1. ElliottSL
SuhrbierA
MilesJJ
LawrenceG
PyeSJ
2008
Phase I trial of a CD8+ T-cell peptide epitope-based vaccine for infectious mononucleosis.
J Virol
82
1448
1457
2. MacsweenKF
CrawfordDH
2003
Epstein-Barr virus-recent advances.
Lancet Infect Dis
3
131
140
3. KhanN
HislopA
GudgeonN
CobboldM
KhannaR
2004
Herpesvirus-specific CD8 T cell immunity in old age: cytomegalovirus impairs the response to a coresident EBV infection.
J Immunol
173
7481
7489
4. HislopAD
AnnelsNE
GudgeonNH
LeeseAM
RickinsonAB
2002
Epitope-specific evolution of human CD8(+) T cell responses from primary to persistent phases of Epstein-Barr virus infection.
J Exp Med
195
893
905
5. TrautmannL
LabarriereN
JotereauF
KaranikasV
GervoisN
2002
Dominant TCR V alpha usage by virus and tumor-reactive T cells with wide affinity ranges for their specific antigens.
Eur J Immunol
32
3181
3190
6. AnnelsNE
CallanMF
TanL
RickinsonAB
2000
Changing patterns of dominant TCR usage with maturation of an EBV-specific cytotoxic T cell response.
J Immunol
165
4831
4841
7. LimA
TrautmannL
PeyratMA
CouedelC
DavodeauF
2000
Frequent contribution of T cell clonotypes with public TCR features to the chronic response against a dominant EBV-derived epitope: application to direct detection of their molecular imprint on the human peripheral T cell repertoire.
J Immunol
165
2001
2011
8. PriceDA
BrenchleyJM
RuffLE
BettsMR
HillBJ
2005
Avidity for antigen shapes clonal dominance in CD8+ T cell populations specific for persistent DNA viruses.
J Exp Med
202
1349
1361
9. IancuEM
CorthesyP
BaumgaertnerP
DevevreE
VoelterV
2009
Clonotype selection and composition of human CD8 T cells specific for persistent herpes viruses varies with differentiation but is stable over time.
J Immunol
183
319
331
10. CabaniolsJP
FazilleauN
CasrougeA
KourilskyP
KanellopoulosJM
2001
Most alpha/beta T cell receptor diversity is due to terminal deoxynucleotidyl transferase.
J Exp Med
194
1385
1390
11. DavisMM
BjorkmanPJ
1988
T-cell antigen receptor genes and T-cell recognition.
Nature
334
395
402
12. LieberMR
1991
Site-specific recombination in the immune system.
Faseb J
5
2934
2944
13. ShortmanK
EgertonM
SpangrudeGJ
ScollayR
1990
The generation and fate of thymocytes.
Semin Immunol
2
3
12
14. ArstilaTP
CasrougeA
BaronV
EvenJ
KanellopoulosJ
1999
A direct estimate of the human alphabeta T cell receptor diversity.
Science
286
958
961
15. TurnerSJ
DohertyPC
McCluskeyJ
RossjohnJ
2006
Structural determinants of T-cell receptor bias in immunity.
Nat Rev Immunol
6
883
894
16. MilesJJ
BrennanRM
BurrowsSR
2009
T cell receptor bias in humans.
Current Immunology Reviews
5
10
21
17. VenturiV
ChinHY
AsherTE
LadellK
ScheinbergP
2008
TCR beta-chain sharing in human CD8+ T cell responses to cytomegalovirus and EBV.
J Immunol
181
7853
7862
18. TickleIJ
LaskowskiRA
MossDS
2000
Rfree and the rfree ratio. II. Calculation Of the expected values and variances of cross-validation statistics in macromolecular least-squares refinement.
Acta Crystallogr D Biol Crystallogr
56
442
450
19. RudolphMG
StanfieldRL
WilsonIA
2006
How TCRs bind MHCs, peptides, and coreceptors.
Annu Rev Immunol
24
419
466
20. GrasS
SaulquinX
ReiserJB
DebeaupuisE
EchasserieauK
2009
Structural bases for the affinity-driven selection of a public TCR against a dominant human cytomegalovirus epitope.
J Immunol
183
430
437
21. ColeDK
YuanF
RizkallahPJ
MilesJJ
GostickE
2009
Germ line-governed recognition of a cancer epitope by an immunodominant human T-cell receptor.
J Biol Chem
284
27281
27289
22. ArchboldJK
MacdonaldWA
GrasS
ElyLK
MilesJJ
2009
Natural micropolymorphism in human leukocyte antigens provides a basis for genetic control of antigen recognition.
J Exp Med
206
209
219
23. TynanFE
BurrowsSR
BuckleAM
ClementsCS
BorgNA
2005
T cell receptor recognition of a ‘super-bulged’ major histocompatibility complex class I-bound peptide.
Nat Immunol
6
1114
1122
24. ColeDK
PumphreyNJ
BoulterJM
SamiM
BellJI
2007
Human TCR-binding affinity is governed by MHC class restriction.
J Immunol
178
5727
5734
25. Varela-RohenaA
MolloyPE
DunnSM
LiY
SuhoskiMM
2008
Control of HIV-1 immune escape by CD8 T cells expressing enhanced T-cell receptor.
Nat Med
14
1390
1395
26. van der MerwePA
DavisSJ
2003
Molecular interactions mediating T cell antigen recognition.
Annu Rev Immunol
21
659
684
27. ArmstrongKM
InsaidooFK
BakerBM
2008
Thermodynamics of T-cell receptor-peptide/MHC interactions: progress and opportunities.
J Mol Recognit
21
275
287
28. CCP4
1994
The Collaborative Computational Project Number 4, suite programs for protein crystallography.
Acta Cryst
d50
760
763
29. VenturiV
PriceDA
DouekDC
DavenportMP
2008
The molecular basis for public T-cell responses?
Nat Rev Immunol
8
231
238
30. VenturiV
KedzierskaK
PriceDA
DohertyPC
DouekDC
2006
Sharing of T cell receptors in antigen-specific responses is driven by convergent recombination.
Proc Natl Acad Sci U S A
103
18691
18696
31. VenturiV
ChinHY
PriceDA
DouekDC
DavenportMP
2008
The role of production frequency in the sharing of simian immunodeficiency virus-specific CD8+ TCRs between macaques.
J Immunol
181
2597
2609
32. RobinsonJ
WallerMJ
ParhamP
de GrootN
BontropR
2003
IMGT/HLA and IMGT/MHC: sequence databases for the study of the major histocompatibility complex.
Nucleic Acids Res
31
311
314
33. HislopAD
TaylorGS
SauceD
RickinsonAB
2007
Cellular responses to viral infection in humans: lessons from Epstein-Barr virus.
Annu Rev Immunol
25
587
617
34. BurrowsSR
ChenZ
ArchboldJK
TynanFE
BeddoeT
Hard wiring of T cell receptor specificity for the major histocompatibility complex is underpinned by TCR adaptability.
Proc Natl Acad Sci U S A
107
10608
10613
35. WillcoxBE
GaoGF
WyerJR
LadburyJE
BellJI
1999
TCR binding to peptide-MHC stabilizes a flexible recognition interface.
Immunity
10
357
365
36. BonifaceJJ
ReichZ
LyonsDS
DavisMM
1999
Thermodynamics of T cell receptor binding to peptide-MHC: evidence for a general mechanism of molecular scanning.
Proc Natl Acad Sci U S A
96
11446
11451
37. DavisSJ
IkemizuS
EvansEJ
FuggerL
BakkerTR
2003
The nature of molecular recognition by T cells.
Nat Immunol
4
217
224
38. TheodossisA
GuillonneauC
WellandA
ElyLK
ClementsCS
Constraints within major histocompatibility complex class I restricted peptides: presentation and consequences for T-cell recognition.
Proc Natl Acad Sci U S A
107
5534
5539
39. ZengMS
LiDJ
LiuQL
SongLB
LiMZ
2005
Genomic sequence analysis of Epstein-Barr virus strain GD1 from a nasopharyngeal carcinoma patient.
J Virol
79
15323
15330
40. DolanA
AddisonC
GathererD
DavisonAJ
McGeochDJ
2006
The genome of Epstein-Barr virus type 2 strain AG876.
Virology
350
164
170
41. BellMJ
BrennanR
MilesJJ
MossDJ
BurrowsJM
2008
Widespread sequence variation in Epstein-Barr virus nuclear antigen 1 influences the antiviral T cell response.
J Infect Dis
197
1594
1597
42. DuraiswamyJ
BurrowsJM
BharadwajM
BurrowsSR
CooperL
2003
Ex vivo analysis of T-cell responses to Epstein-Barr virus-encoded oncogene latent membrane protein 1 reveals highly conserved epitope sequences in virus isolates from diverse geographic regions.
J Virol
77
7401
7410
43. MidgleyRS
BellAI
YaoQY
Croom-CarterD
HislopAD
2003
HLA-A11-restricted epitope polymorphism among Epstein-Barr virus strains in the highly HLA-A11-positive Chinese population: incidence and immunogenicity of variant epitope sequences.
J Virol
77
11507
11516
44. NagamineM
TakaharaM
KishibeK
NagatoT
IshiiH
2007
Sequence variations of Epstein-Barr virus LMP1 gene in nasal NK/T-cell lymphoma.
Virus Genes
34
47
54
45. KhannaR
SladeRW
PoulsenL
MossDJ
BurrowsSR
1997
Evolutionary dynamics of genetic variation in Epstein-Barr virus isolates of diverse geographical origins: evidence for immune pressure-independent genetic drift.
J Virol
71
8340
8346
46. Hutt-FletcherLM
2007
Epstein-Barr virus entry.
J Virol
81
7825
7832
47. Kjer-NielsenL
ClementsCS
PurcellAW
BrooksAG
WhisstockJC
2003
A structural basis for the selection of dominant alphabeta T cell receptors in antiviral immunity.
Immunity
18
53
64
48. Stewart-JonesGB
McMichaelAJ
BellJI
StuartDI
JonesEY
2003
A structural basis for immunodominant human T cell receptor recognition.
Nat Immunol
4
657
663
49. ArgaetVP
SchmidtCW
BurrowsSR
SilinsSL
KurillaMG
1994
Dominant selection of an invariant T cell antigen receptor in response to persistent infection by Epstein-Barr virus.
J Exp Med
180
2335
2340
50. BorgNA
ElyLK
BeddoeT
MacdonaldWA
ReidHH
2005
The CDR3 regions of an immunodominant T cell receptor dictate the ‘energetic landscape’ of peptide-MHC recognition.
Nat Immunol
6
171
180
51. BurrowsSR
SilinsSL
MossDJ
KhannaR
MiskoIS
1995
T cell receptor repertoire for a viral epitope in humans is diversified by tolerance to a background major histocompatibility complex antigen.
J Exp Med
182
1703
1715
52. LehnerPJ
WangEC
MossPA
WilliamsS
PlattK
1995
Human HLA-A0201-restricted cytotoxic T lymphocyte recognition of influenza A is dominated by T cells bearing the V beta 17 gene segment.
J Exp Med
181
79
91
53. MossPA
MootsRJ
RosenbergWM
Rowland-JonesSJ
BodmerHC
1991
Extensive conservation of alpha and beta chains of the human T-cell antigen receptor recognizing HLA-A2 and influenza A matrix peptide.
Proc Natl Acad Sci U S A
88
8987
8990
54. IshizukaJ
Stewart-JonesGB
van der MerweA
BellJI
McMichaelAJ
2008
The structural dynamics and energetics of an immunodominant T cell receptor are programmed by its Vbeta domain.
Immunity
28
171
182
55. LantzO
BendelacA
1994
An invariant T cell receptor alpha chain is used by a unique subset of major histocompatibility complex class I-specific CD4+ and CD4-8 - T cells in mice and humans.
J Exp Med
180
1097
1106
56. BorgNA
WunKS
Kjer-NielsenL
WilceMC
PellicciDG
2007
CD1d-lipid-antigen recognition by the semi-invariant NKT T-cell receptor.
Nature
448
44
49
57. Scott-BrowneJP
MatsudaJL
MallevaeyT
WhiteJ
BorgNA
2007
Germline-encoded recognition of diverse glycolipids by natural killer T cells.
Nat Immunol
8
1105
1113
58. PellicciDG
PatelO
Kjer-NielsenL
PangSS
SullivanLC
2009
Differential recognition of CD1d-alpha-galactosyl ceramide by the V beta 8.2 and V beta 7 semi-invariant NKT T cell receptors.
Immunity
31
47
59
59. DavisonAJ
2002
Evolution of the herpesviruses.
Vet Microbiol
86
69
88
60. RothDB
2000
From lymphocytes to sharks: V(D)J recombinase moves to the germline.
Genome Biol
1
REVIEWS1014
61. GarciaKC
AdamsJJ
FengD
ElyLK
2009
The molecular basis of TCR germline bias for MHC is surprisingly simple.
Nat Immunol
10
143
147
62. AlemsegedZ
CoppensY
GeraadsD
2002
Hominid cranium from Omo: Description and taxonomy of Omo-323-1976-896.
Am J Phys Anthropol
117
103
112
63. LaugelB
van den BergHA
GostickE
ColeDK
WooldridgeL
2007
Different T cell receptor affinity thresholds and CD8 coreceptor dependence govern cytotoxic T lymphocyte activation and tetramer binding properties.
J Biol Chem
282
23799
23810
64. PanzaraMA
GussoniE
SteinmanL
OksenbergJR
1992
Analysis of the T cell repertoire using the PCR and specific oligonucleotide primers.
Biotechniques
12
728
735
65. LefrancMP
2003
IMGT, the international ImMunoGeneTics database.
Nucleic Acids Res
31
307
310
66. GarbocziDN
GhoshP
UtzU
FanQR
BiddisonWE
1996
Structure of the complex between human T-cell receptor, viral peptide and HLA-A2.
Nature
384
134
141
67. BoulterJM
GlickM
TodorovPT
BastonE
SamiM
2003
Stable, soluble T-cell receptor molecules for crystallization and therapeutics.
Protein Eng
16
707
711
68. WyerJR
WillcoxBE
GaoGF
GerthUC
DavisSJ
1999
T cell receptor and coreceptor CD8 alphaalpha bind peptide-MHC independently and with distinct kinetics.
Immunity
10
219
225
69. ElyLK
BeddoeT
ClementsCS
MatthewsJM
PurcellAW
2006
Disparate thermodynamics governing T cell receptor-MHC-I interactions implicate extrinsic factors in guiding MHC restriction.
Proc Natl Acad Sci U S A
103
6641
6646
70. LeslieAGW
1992
Recent changes to the MOSFLM package for processing film and image plate data Joint CCP4 + ESF-EAMCB Newsletter on Protein Crystallography
26
71. TrapaniS
NavazaJ
2008
AMoRe: classical and modern.
Acta Crystallogr D Biol Crystallogr
64
11
16
72. EmsleyP
CowtanK
2004
Coot: model-building tools for molecular graphics.
Acta Crystallogr D Biol Crystallogr
60
2126
2132
73. MurshudovGN
VaginAA
DodsonEJ
1997
Refinement of macromolecular structures by the maximum-likelihood method.
Acta Crystallogr D Biol Crystallogr
53
240
255
74. DelanoWL
2002
The PyMOL Molecular Graphics System.
San Carlos, CA, USA
DeLano Scientific
75. DingYH
SmithKJ
GarbocziDN
UtzU
BiddisonWE
1998
Two human T cell receptors bind in a similar diagonal mode to the HLA-A2/Tax peptide complex using different TCR amino acids.
Immunity
8
403
411
76. ChenJL
Stewart-JonesG
BossiG
LissinNM
WooldridgeL
2005
Structural and kinetic basis for heightened immunogenicity of T cell vaccines.
J Exp Med
201
1243
1255
77. TynanFE
ReidHH
Kjer-NielsenL
MilesJJ
WilceMC
2007
A T cell receptor flattens a bulged antigenic peptide presented by a major histocompatibility complex class I molecule.
Nat Immunol
8
268
276
Štítky
Hygiena a epidemiologie Infekční lékařství LaboratořČlánek vyšel v časopise
PLOS Pathogens
2010 Číslo 11
- Farmakovigilanční studie perorálních antivirotik indikovaných v léčbě COVID-19
- Jak souvisí postcovidový syndrom s poškozením mozku?
- Měli bychom postcovidový syndrom léčit antidepresivy?
- 10 bodů k očkování proti COVID-19: stanovisko České společnosti alergologie a klinické imunologie ČLS JEP
Nejčtenější v tomto čísle
- Zn Inhibits Coronavirus and Arterivirus RNA Polymerase Activity and Zinc Ionophores Block the Replication of These Viruses in Cell Culture
- The Female Lower Genital Tract Is a Privileged Compartment with IL-10 Producing Dendritic Cells and Poor Th1 Immunity following Infection
- Crystal Structure and Size-Dependent Neutralization Properties of HK20, a Human Monoclonal Antibody Binding to the Highly Conserved Heptad Repeat 1 of gp41
- The Arabidopsis Resistance-Like Gene Is Activated by Mutations in and Contributes to Resistance to the Bacterial Effector AvrRps4