
An Iterative Genetic and Dynamical Modelling Approach Identifies Novel Features of the Gene Regulatory Network Underlying Melanocyte Development
The mechanisms generating stably differentiated cell-types from multipotent precursors are key to understanding normal development and have implications for treatment of cancer and the therapeutic use of stem cells. Pigment cells are a major derivative of neural crest stem cells and a key model cell-type for our understanding of the genetics of cell differentiation. Several factors driving melanocyte fate specification have been identified, including the transcription factor and master regulator of melanocyte development, Mitf, and Wnt signalling and the multipotency and fate specification factor, Sox10, which drive mitf expression. While these factors together drive multipotent neural crest cells to become specified melanoblasts, the mechanisms stabilising melanocyte differentiation remain unclear. Furthermore, there is controversy over whether Sox10 has an ongoing role in melanocyte differentiation. Here we use zebrafish to explore in vivo the gene regulatory network (GRN) underlying melanocyte specification and differentiation. We use an iterative process of mathematical modelling and experimental observation to explore methodically the core melanocyte GRN we have defined. We show that Sox10 is not required for ongoing differentiation and expression is downregulated in differentiating cells, in response to Mitfa and Hdac1. Unexpectedly, we find that Sox10 represses Mitf-dependent expression of melanocyte differentiation genes. Our systems biology approach allowed us to predict two novel features of the melanocyte GRN, which we then validate experimentally. Specifically, we show that maintenance of mitfa expression is Mitfa-dependent, and identify Sox9b as providing an Mitfa-independent input to melanocyte differentiation. Our data supports our previous suggestion that Sox10 only functions transiently in regulation of mitfa and cannot be responsible for long-term maintenance of mitfa expression; indeed, Sox10 is likely to slow melanocyte differentiation in the zebrafish embryo. More generally, this novel approach to understanding melanocyte differentiation provides a basis for systematic modelling of differentiation in this and other cell-types.
Published in the journal:
. PLoS Genet 7(9): e32767. doi:10.1371/journal.pgen.1002265
Category:
Research Article
doi:
https://doi.org/10.1371/journal.pgen.1002265
Summary
The mechanisms generating stably differentiated cell-types from multipotent precursors are key to understanding normal development and have implications for treatment of cancer and the therapeutic use of stem cells. Pigment cells are a major derivative of neural crest stem cells and a key model cell-type for our understanding of the genetics of cell differentiation. Several factors driving melanocyte fate specification have been identified, including the transcription factor and master regulator of melanocyte development, Mitf, and Wnt signalling and the multipotency and fate specification factor, Sox10, which drive mitf expression. While these factors together drive multipotent neural crest cells to become specified melanoblasts, the mechanisms stabilising melanocyte differentiation remain unclear. Furthermore, there is controversy over whether Sox10 has an ongoing role in melanocyte differentiation. Here we use zebrafish to explore in vivo the gene regulatory network (GRN) underlying melanocyte specification and differentiation. We use an iterative process of mathematical modelling and experimental observation to explore methodically the core melanocyte GRN we have defined. We show that Sox10 is not required for ongoing differentiation and expression is downregulated in differentiating cells, in response to Mitfa and Hdac1. Unexpectedly, we find that Sox10 represses Mitf-dependent expression of melanocyte differentiation genes. Our systems biology approach allowed us to predict two novel features of the melanocyte GRN, which we then validate experimentally. Specifically, we show that maintenance of mitfa expression is Mitfa-dependent, and identify Sox9b as providing an Mitfa-independent input to melanocyte differentiation. Our data supports our previous suggestion that Sox10 only functions transiently in regulation of mitfa and cannot be responsible for long-term maintenance of mitfa expression; indeed, Sox10 is likely to slow melanocyte differentiation in the zebrafish embryo. More generally, this novel approach to understanding melanocyte differentiation provides a basis for systematic modelling of differentiation in this and other cell-types.
Introduction
Understanding the mechanisms of generation of differentiated cell-types from multipotent precursors is a fundamental aspect of development, with profound implications for the therapeutic use of stem cells. Whilst numerous transcription factors mediating fate choice from stem cells have been characterised, we still lack a robust understanding of how these factors and their target differentiation genes interact to form the gene regulatory networks (GRNs) that result in stable differentiation. At the time of fate specification, a multipotent cell's GRN is configured so as to allow multiple fates to be chosen; after specification this GRN must shift to a new stable state to establish commitment to, and full differentiation of, a specific fate. Tour de force studies of the early development of the sea urchin embryo have become perhaps the most completely understood example [1]. These studies, amongst others, have identified two key themes of fate specification, that the adopted fate becomes stabilized by factors initiating positive feedback loops and that these then are reinforced by activation of repressors of alternative fates [2]. Increasingly it is becoming clear that mathematical modelling of these proposed networks is very informative for a rigorous understanding of their properties [3]–[5], but this remains rare, especially for vertebrate systems.
Vertebrate melanocytes (melanophores in fish, amphibians and reptiles) are critical for body pigmentation and play roles, for example, in mate recognition and protection against UV light. Numerous diseases result from failures of melanocyte specification (e.g. Waardenburg syndromes), differentiation (albinism), survival (vitiligo) or control of proliferation (melanoma) [6]. Melanocytes are genetically amongst the best characterised cell-types, with a long history of genetic analysis in mammals [7], but so far these data have not been used to generate mathematical models of melanocyte differentiation. Embryonic melanocytes are derived from the neural crest [8]–[10] and in the adult are renewed from dormant melanocyte stem cells [11]. Melanocyte specification centers on the transcriptional activation of Mitf, a bHLH-LZ transcription factor that is a master regulator of melanocyte differentiation [12], [13]. Key target genes of Mitf include those encoding the melanogenic enzymes Dopachrome tautomerase (Dct), Tyrosinase (Tyr) and Tyrosinase-related protein 1 (Tyrp1) and the melanosome structural protein Silver (Si). The Sox transcription factor Sox10 is also crucial for melanocyte development, where it contributes to melanocyte fate-specification by transcriptional activation of Mitf, consistent with the association of SOX10 with Waardenburg syndrome in humans [14]–[20].
Given that both MITF and SOX10 are frequently mutated in melanoma [21] and that MITF itself is considered to be a lineage addiction oncogene [22], understanding the melanocyte GRN is of crucial importance. However, controversy surrounds the precise role of Sox10, with in vivo data from zebrafish arguing that an ongoing role in melanocyte differentiation is not required in this organism [16], while in vitro data from mouse indicates that Sox10 may contribute to expression of melanocyte differentiation genes, Dct and Tyr [23]–[27]. We here combine experimental and mathematical modelling approaches to examine this issue in more detail in zebrafish.
We document the rapid loss of Sox10 from differentiating melanocytes in zebrafish embryos. We adapt a simple GRN model of sympathetic neuron development to the melanocyte case and assess its validity both experimentally and by mathematical modelling. This melanocyte model predicts that Sox10 represses expression of melanocyte differentiation genes, and that in this way Sox10 antagonizes Mitfa-mediated differentiation. Our analysis of gene expression patterns in zebrafish sox10 and mitfa mutants provides strong support for this, and overexpression studies in zebrafish embryos confirm the repressive action of Sox10 on Mitfa-mediated transcription. The model also predicts that the turning off of sox10 expression in differentiating melanocytes results from Mitfa-dependent repression of sox10 transcription. We provide evidence that Mitfa can regulate sox10 expression and that in vivo this effect is likely to be repressive and dependent upon Hdac1 function. We use simple mathematical modelling of this GRN, in conjunction with our previous experimental data, to establish that it is insufficient to explain stable melanocyte differentiation. We show that addition of further features, including a Sox10-independent positive feedback loop regulating mitfa, and a Sox10-independent weak activator of melanocyte differentiation gene expression, are sufficient to alter the GRN behaviour to allow stable differentiation of this cell-type and to explain our in vivo observations. Finally, we provide genetic evidence that Sox9b contributes to the second of these factors. The mathematical modelling of the melanocyte GRN proposed here provides the first such model for this important and well-characterised cell-type and provides the basis for future qualitative and quantitative refinement of our understanding of melanocyte differentiation. Our data supports the previous suggestion that Sox10 only functions transiently in mitfa expression and cannot be responsible for long-term maintenance of mitfa expression in zebrafish; indeed, Sox10 is likely to slow melanocyte differentiation in the embryo. This work has clear implications for the proposed model of sympathetic neuron differentiation, but also more broadly for our understanding of commitment to specific fates. Furthermore, these studies emphasize the importance of robust mathematical modelling of proposed GRNs to test their behaviour in a rigorous and quantitative manner.
Results
Sox10 expression is rapidly lost in differentiating melanocytes
Our previous studies have shown that sox10 mRNA expression is rapidly lost from differentiating sensory neurons [28]. We asked whether this pattern was seen for sox10 expression in differentiating melanocytes too. We used both whole-mount in situ hybridisation and immunofluorescence using a Sox10 antibody (kind gift of B. Appel) to evaluate the temporal persistence of Sox10 expression throughout a time-course (Figure 1). Melanocytes were selected at random from all dorso-ventral positions between the edge of the yolk and the end of the yolk sac extension. Expression was scored as the percentage of melanised cells showing detectable signal. The earliest signs of melanisation in trunk melanocytes in wild-type embryos are seen around 27 hpf [29]. At 30 hpf, almost all melanocytes showed detectable sox10 and Sox10 expression, but this rapidly decreased, so that by c. 50 hpf, signal was not detected in any cells. This contrasts with the continuing expression of mitfa (data not shown and see Figure S3). We note that at this stage, melanocyte differentiation and melanisation is still incomplete, and we conclude that expression of Sox10 is rapidly downregulated in differentiating melanocytes in zebrafish.

Studies in mouse have not documented the temporal changes in Sox10 expression in vivo, but in adult human melanocytes there is evidence that SOX9 expression may partially replace SOX10 and is necessary for maintenance of melanocyte differentiation [30]. Strikingly, studies of cultured differentiating human melanoblasts show that SOX10 expression is lost in differentiating melanocytes, but that SOX9 expression is upregulated [31]. Neither of the zebrafish orthologues, sox9a and sox9b, have been reported as expressed in melanocytes [32], [33], [34]. To assess directly whether a similar shift from sox10 to sox9 expression might occur in zebrafish melanocytes, we used whole-mount in situ hybridisation to assess sox9a and sox9b expression in zebrafish embryos, but found no evidence for such expression between 24 hpf and 72 hpf (Figure S1; data not shown). We conclude that in zebrafish embryos, sox10 expression is lost from differentiating melanocytes, but this is not replaced by sox9 gene expression.
A simple model for melanocyte development in zebrafish
This pattern of sox10 expression attenuation during neural crest differentiation has also been described for the sympathetic neurons in mouse (Figure 2A; [35]). These authors suggested a model whereby Sox10-mediated activation of MASH-1 and Phox2B drives sympathetic neuron specification, whilst initially feed-forward repression by Sox10 delays sympathetic neuron differentiation; subsequently negative feedback by MASH-1/Phox2B turns off Sox10 and differentiation can now proceed. In melanocyte development, Sox10 drives mitfa expression; we have shown in zebrafish that the interaction is direct and identified some of the relevant Sox10-binding sites in the mitfa promoter [16]. We asked to what extent the Kim et al. model could be generalised to another neural crest derivative. We proposed an analogous initial model of melanocyte differentiation in which Sox10 drives fate specification by activating mitfa expression, but perhaps delayed melanocyte differentiation by a feed-forward repression (Figure 2B). Based on this analogy, we made two predictions. Firstly, melanocyte differentiation genes might be derepressed in sox10 mutants, just as, in Sox10 mutant mice, Phox2A expression is seen in the absence of MASH-1/Phox2B. Secondly, that sox10 repression would be directly or indirectly dependent upon mitfa expression. Here we explore these predictions experimentally.

Residual melanin is observed in sox10 mutant zebrafish embryos
We had previously observed residual melanin in dorsal positions of 3 dpf zebrafish sox10 mutants, but had not examined this trait in detail [16]. Surprisingly, we had shown genetically that this residual melanin was independent of mitfa function; thus, it was consistent with possible derepression of melanocyte differentiation genes in sox10 mutants. We examined three series of sox10 mutant embryos, documenting the timing and appearance of these cells (Figure S2). Melanisation in these mutants is substantially delayed compared with wild-type siblings. In contrast to wild-type siblings which showed faint melanin from c. 25 hpf, we were unable to detect melanin before 36 hpf in any of 29 embryos followed (Figure S2C). As in wild-types, numbers of melanised cells increased with developmental age, and tended to form in an anterior-posterior progression (data not shown). Melanised cells were scored for their position with respect to the trunk and tail segments defined by the myotome. The numbers were very variable, with occasional embryos developing melanised cells in up to 21 segments (n = 1), whereas others never showed any (n = 2), and they were usually confined to the trunk and anterior-most tail, and never seen in the posterior-most tail (Figure S2C and data not shown). As noted before, melanin is very faint in these cells, but it undergoes a dynamic change in appearance from initially rather diffuse to later more compacted, forming a tiny but dense spot (Figure S2B). In summary, it seems that melanisation is highly residual and strongly delayed compared with wild-type siblings, consistent with low level derepression of melanogenic genes.
Melanocyte differentiation gene derepression in sox10 mutants
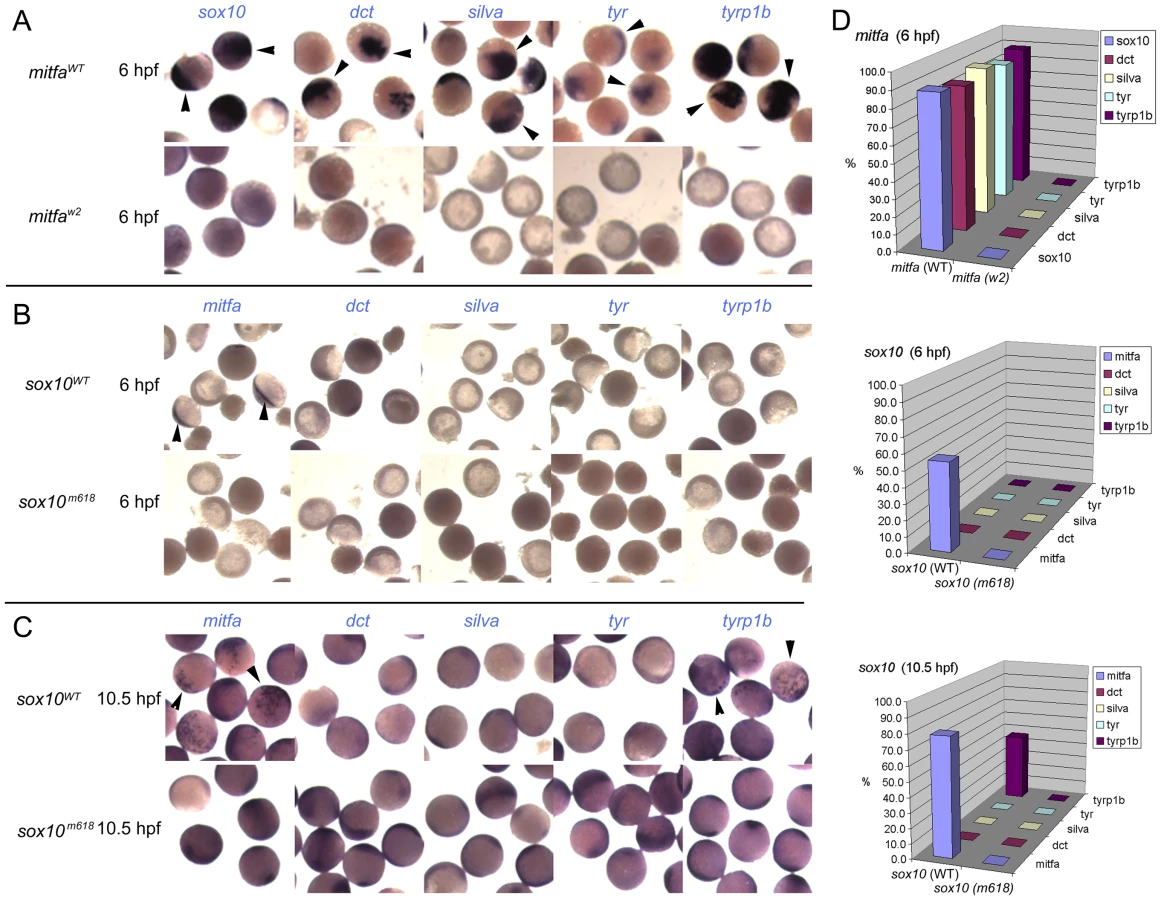
From our model, we predicted that derepression of melanogenic genes would be detected as increased expression in sox10 mutants compared with mitfa mutants, and would be independent of Mitfa function i.e. would persist in sox10; mitfa double mutants. We had previously observed residual dct expression in dorsally-located cells in sox10 mutants [36], but had not compared mitfa mutants. To assess whether dct and other key melanocyte differentiation genes were derepressed in sox10 mutants compared with mitfa mutants, we performed a series of parallel in situ hybridisation studies using four melanogenic genes, dct, tyrp1b, tyr and silva, on sox10 and mitfa mutant embryos (Figure 3). Pilot experiments showed that expression in mitfa mutants was extremely weak and was undetectable in fish older than 36 hpf, so careful comparisons were made at stages between 24 and 36 hpf (Table 1). In all cases, marker expression in wild-types was very strong, but to test for low level expression in mutants the in situs were stained longer, resulting in higher background than normal. Mutant embryos were developed in parallel with the same probe under identical conditions; expression of all markers in the pigmented retinal epithelium (PRE) was unaffected in each mutant and was used as an internal control for the procedure on each embryo. We saw a consistent pattern for all genes examined, with sox10 mutants showing slightly more elevated and more consistently-detectable expression (i.e. a higher proportion of embryos showed a signal) and a longer duration (from 24 to 48+ hpf in sox10 mutants, but from 24 to 30+ hpf in mitfa mutants) of detectable expression than mitfa mutants (Figure 3 and Table 1). The differential expression of dct, tyr and silva between the two mutants was striking; in contrast effects on tyrp1b were subtle, with very little detectable expression being seen (Figure 3), although this residual expression was more consistent and more prolonged (Table 1) in sox10 mutants.


As an independent confirmation of these data, we used quantitative real-time PCR on embryos at 30, 36 and 72 hpf (Figure S3). As expected, expression levels of mitfa, dct and tyrp1b are all much reduced in both mutants compared with wild-types. However, consistent with our in situ hybridisation data, at 30 hpf, but not at later stages, the expression levels of dct, and to a much lesser extent tyrp1b, are significantly higher in sox10 mutants compared with mitfa mutants, confirming the weak and transient derepression of melanogenic genes in the sox10 mutant embryos.
We had previously shown that residual melanin in sox10 mutants was not due to low level expression of Mitfa, since sox10;mitfa double mutants also showed residual melanisation. To assess whether the low level derepression of melanocyte differentiation genes was also independent of Mitfa, we repeated our in situ hybridisation studies on sox10;mitfa double mutants generated by crossing sox10+/t3;mitfaw2/w2 parents, so that all embryos were mitfa homozygotes, and 25% were double homozygotes. We focused on the 36 hpf stage, when mitfa mutants have consistently lost expression, but sox10 mutants show detectable levels (Table 1); thus, if derepression of melanocyte gene expression was independent of Mitfa, we expected that 25% of embryos would show ‘rescue’ of differentiation gene expression. We found detectable expression of the markers in nearly 25% of embryos (12/60, dct; 9/48, silva; 9/49, tyr; 7/45, tyrp1b) from this cross (Figure 3), and interpret these data as showing derepression in most sox10;mitfa double mutants. We conclude that melanocyte differentiation gene derepression is independent of mitfa.
Overexpression of Mitfa, but not Sox10, drives precocious expression of melanocyte differentiation genes
To test experimentally the conclusions from this loss of function analysis we performed overexpression experiments in early zebrafish embryos. Embryos were injected at 1-cell stage with 115 pg sox10 or 35 pg mitfa (initial trials showed 115 pg of mitfa to induce severe lethality) sense RNA; as controls we used 115 pg of sox10m618 or mitfaw2 RNA respectively which encode the loss of function mutant forms. Injected embryos were examined for induced gene expression by whole-mount in situ hybridisation at an early (6 hpf) or later (10.5 hpf) time-point; note that each of these times is prior to endogenous expression of any of the genes assessed. Mitfa expression might be expected to drive expression of most melanocyte differentiation genes, although data from mouse studies might suggest that Mitf alone may be insufficient for some genes, perhaps especially tyrosinase [24]. In contrast, our Sox10-mediated repression model predicts that Mitfa alone will be sufficient, but that whilst Sox10 alone would drive mitfa, Mitfa-dependent expression of other melanocyte differentiation genes (with the likely exception of tyrp1b) would be repressed by the presence of Sox10. In all cases, the negative control RNAs induced no gene expression. We observed a clear-cut distinction between the effects of Sox10 and Mitfa overexpression (Figure 4). Overexpression of wild-type mitfa mRNA resulted in strong expression of all melanocyte differentiation genes by 6 hpf. In contrast, wild-type sox10 induced mitfa, but no melanocyte differentiation genes, by 6 hpf; by 10.5 hpf, tyrp1b was also induced, whereas dct, tyr and silva were not. That this tyrp1b expression was Mitfa-dependent was shown by injecting embryos from a cross of homozygous mitfaw2 mutants with sox10; whilst mitfa transcription was induced by 6 hpf, tyrp1b expression was never seen at 10.5 hpf (data not shown). Our results were fully-consistent with our Sox10-mediated repression model with the modification that tyrp1b is insensitive to Sox10: Mitfa expression led to melanocyte differentiation gene expression by the early time-point, yet, whilst sox10 expression induced robust mitfa by the early time-point, even at the later one only tyrp1b was expressed.
Co-expression of Sox10 represses Mitfa-dependent expression of melanocyte differentiation genes
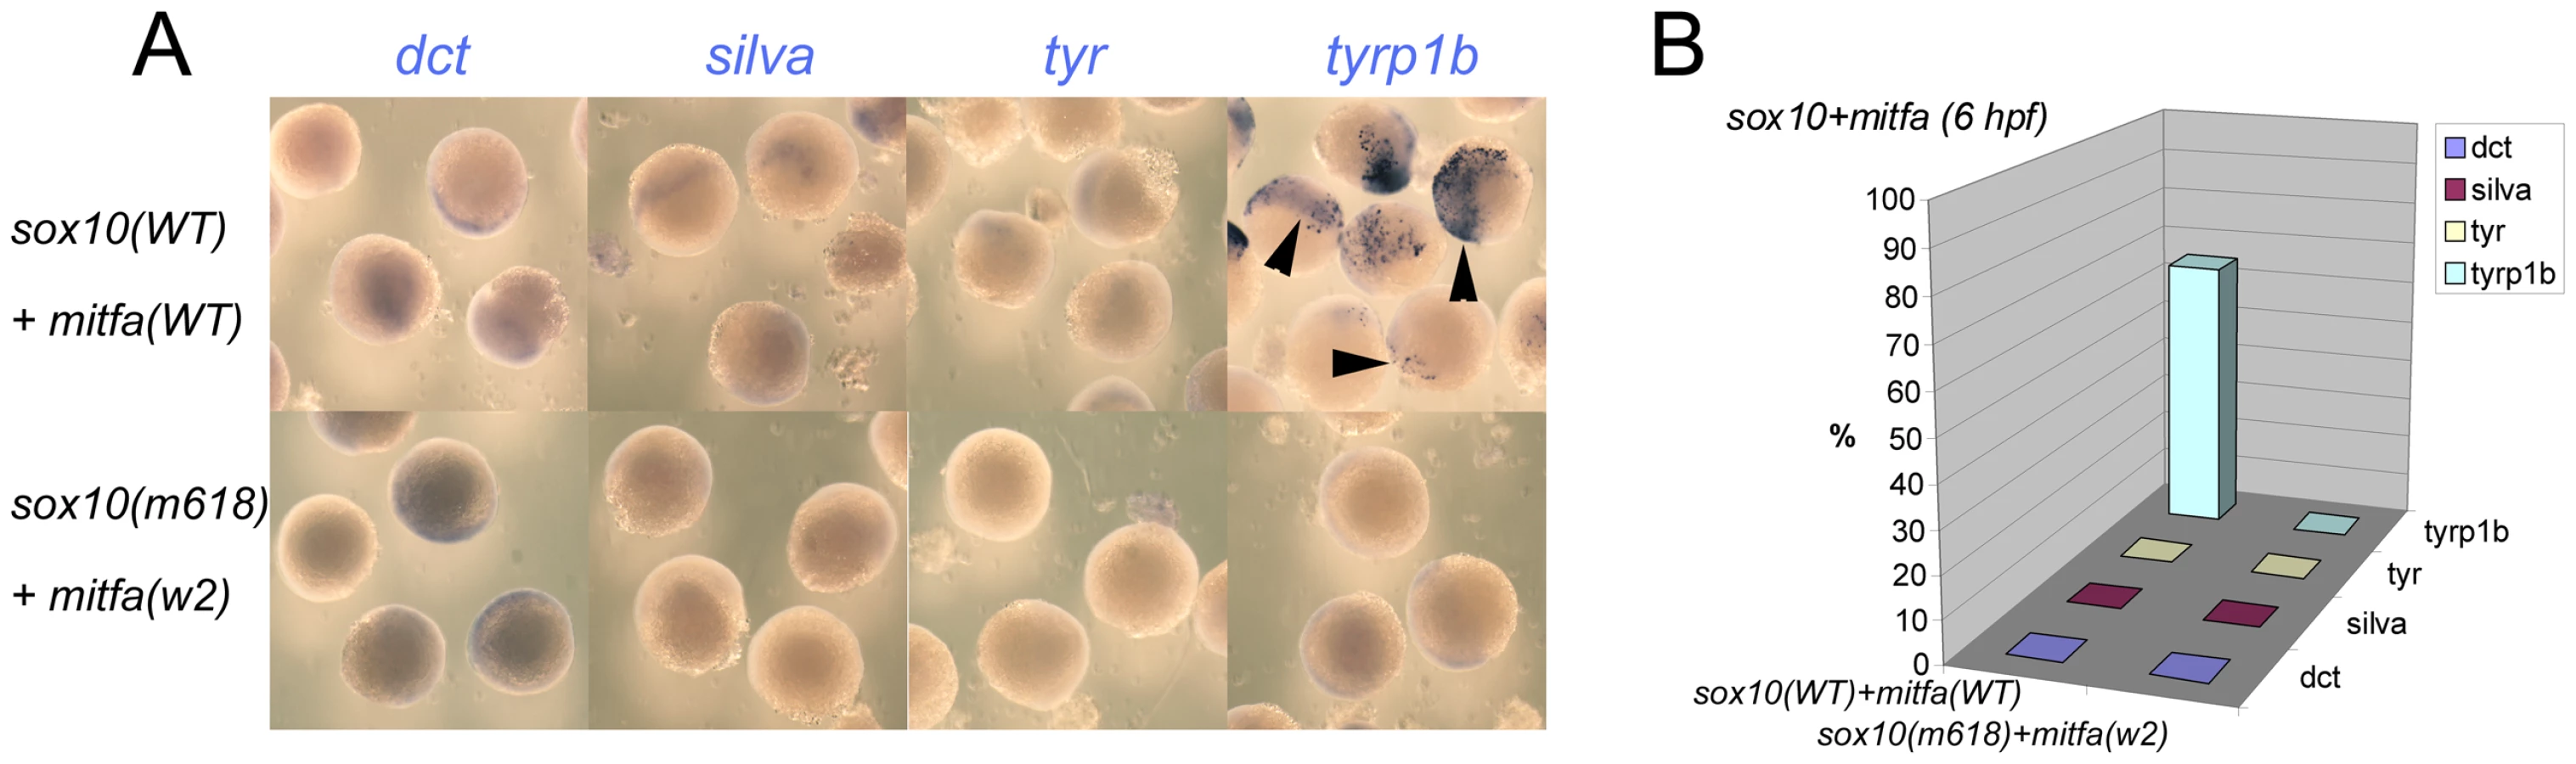
As a further test of our model, we asked whether co-injection of both mitfa and sox10 RNA would give a Sox10-like pattern of induction, but at the early time-point. Embryos were injected at 1-cell stage with 115 pg sox10 and 35 pg mitfa sense RNA; control embryos were injected with 115 pg of both sox10m618 and mitfaw2 RNA. Again the result was clear-cut; tyrp1b expression was readily detected at 6 hpf, whereas dct, silva and tyr were not (Figure 5). We conclude that Sox10 expression can repress the Mitfa-mediated expression of most of the melanocyte differentiation genes tested, but that tyrp1b expression is resistant to this effect, and that the timing of tyrp1b expression is limited by mitfa expression.
Mitfa regulates sox10 transcription
Our simple melanocyte GRN predicts that loss of Sox10 expression results, directly or indirectly, from expression of Mitfa. There are no published reports of Mitf (positively or negatively) regulating sox10 expression, but we observed strong transcriptional activation of sox10 when Mitfa was overexpressed in early zebrafish embryos (Figure 4). This result was surprising since it is in direct contradiction to the predictions of our model, although it does suggest the possibility of Mitfa-mediated sox10 regulation in vivo. To begin to assess whether this might be direct regulation of the sox10 promoter by Mitfa, we asked whether GFP was activated in the Tg(-7.2sox10:GFP) reporter line, in which a 7.2 kb fragment of the promoter proximal region of sox10 genomic DNA drives GFP expression [37]. In the presence of mitfa overexpression, we noted clear GFP expression in transgenic fish at both an early time point (6 hpf), as well as a later (10.5 hpf) one (Figure 6; Table 2), consistent with possible direct regulation.


In contrast, in the same experiment, very few (6%) embryos injected with sox10 RNA showed GFP expression at 6 hpf, whereas essentially all transgenic embryos showed GFP by 10.5 hpf, consistent with the idea that Sox10 does not directly regulate this reporter construct, but that Mitfa expression induced by Sox10 can do so. To test this suggestion that sox10 mRNA only results in expression of the Tg(-7.2sox10:GFP) transgene via production of Mitfa, we asked whether expression of the transgene fails in mitfa mutant embryos. Thus, we repeated the experiment from Figure 6 in mitfa mutant, Tg(-7.2sox10:GFP) embryos. As a positive control, we injected Tg(-7.2sox10:GFP);mitfaw2/w2 embryos with mitfa RNA; this frequently resulted in GFP expression at both 6 hpf (31/108 (29%) injected embryos) and 10.5 hpf (27/111 (24%)). In contrast, injection of sox10 mRNA in mitfa mutants did not result in GFP expression at either 6 hpf (1/112 (1%)) or 10.5 hpf (0/105 (0%)). Interestingly, these data suggest that, in contrast to dct and other differentiation genes, Mitfa-dependent expression of sox10 is not repressed by the presence of Sox10.
The 7.2 kb of sox10 regulatory sequences in the Tg(-7.2sox10:GFP) transgene contains 6 concensus M boxes, making it plausible that Mitfa binds directly to this promoter. To begin to narrow the region of the sox10 promoter likely to mediate this response to Mitfa, we repeated these experiments in the Tg(-4.9sox10:GFP) line [28] in which the 5′ three M boxes are absent. Interestingly, this transgene shows no response to injected Mitfa at 6 hpf (Figure S4).
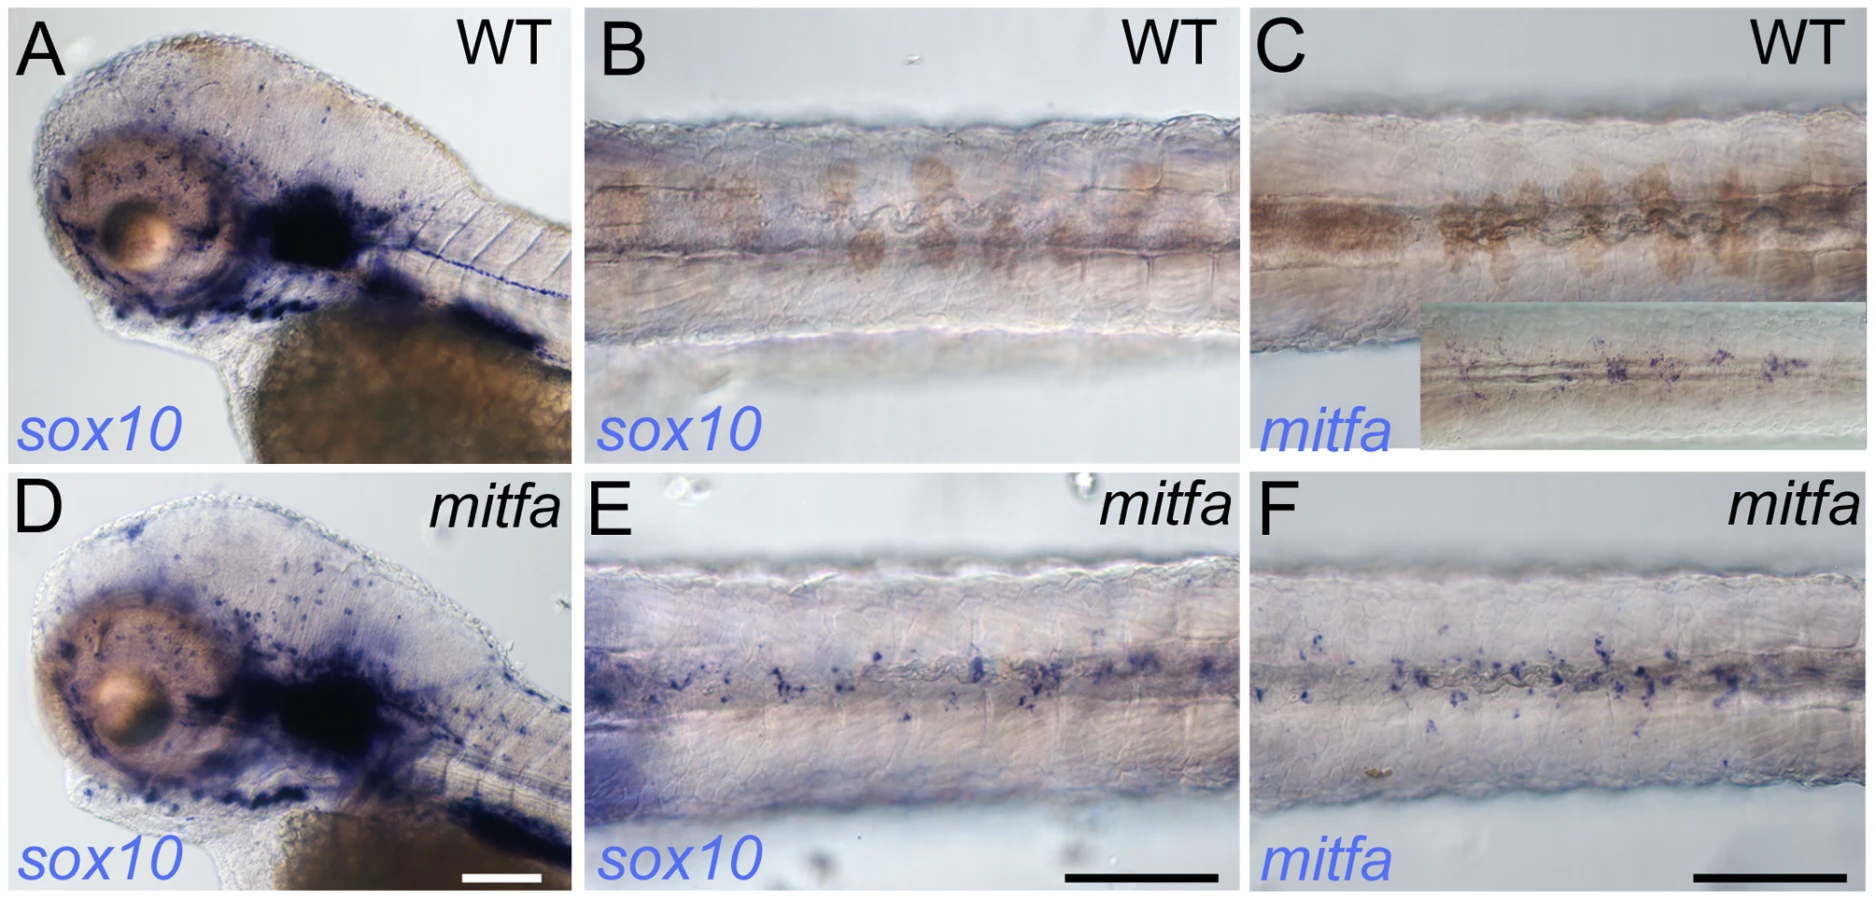
Our data suggest that Mitfa can regulate sox10 expression, but these experiments, examining the reporter in the context of zebrafish blastomeres, do not necessarily reflect the promoter's response in melanoblasts. To address more directly how sox10 expression might be regulated by Mitfa in the endogenous situation i.e. in the melanocyte lineage, we examined sox10 expression in mitfa mutants; if Mitfa is necessary for repression of sox10 we predicted that mitfa mutants should show persistent sox10 expression. We examined mitfa mutants at 72 hpf, a stage when wild-type embryos show no detectable sox10 expression in melanocytes, but show strong expression in the peripheral nervous system and ear (Figure 7A, 7B). In mitfa mutants, in addition to the peripheral nervous system expression, we see readily detectable sox10 expression in the position of the dorsal stripe (Figure 7D, 7E). Furthermore, in mitfa mutants we also see a similar pattern of mitfa expression in this same region (Figure 7F), strongly suggesting that these cells are neural crest-derived melanocyte precursors that are unable to differentiate due to the lack of functional Mitfa protein. We tentatively conclude that Mitfa can regulate the sox10 promoter, and that this interaction is likely to have a repressive function in vivo in differentiating melanocytes.
In considering whether any known factors might contribute to this loss of sox10 expression in melanocytes, we noted the persistence of sox10 expression described in colgate/hdac1 mutants [38]. Histone deacetylase1 is a component of multiple complexes that modify chromatin, resulting in selective repression of gene expression. Consistent with the predictions of our model, hdac1 mutants show both persistent sox10 expression in neural crest cells and poor melanocyte differentiation, although the connection between these phenotypes was not addressed. To assess whether persistent sox10 expression in melanocytes was associated with the delay in differentiation, we used chemical inhibition of histone deacetylase function [39] at the time of early melanocyte differentiation, asking whether this resulted in poor melanocyte differentiation and if this correlated with persistence of sox10 expression. Trichostatin A was applied in each of four time windows: 12–48 hpf, 24–48 hpf, 30–48 hpf and 36–48 hpf. Embryos treated in the 12–48 hpf window showed severe morphological defects, lacking anterior head, but also showed a dramatic reduction in melanocyte pigmentation (data not shown). Those treated from 24–48 hpf again showed severe reductions in melanocyte differentiation (Figure 8D–8F). Although these embryos were of normal morphology, they did appear to show slight retardation, having a morphology similar to approximately 36 hpf embryos. However, comparison of the degree of melanisation of an untreated 36 hpf embryo with the nominally 48 hpf Trichostatin A-treated embryos indicated a clear reduction beyond that expected from delayed development. Later treatment windows showed only weak effects on melanocyte differentiation (data not shown). Using in situ hybridisation we were further able to show that treated embryos showed substantially elevated levels of persistent sox10 expression in melanocytes (Figure 8N, 8Q). Furthermore, our model requires Hdac-mediated repression of sox10 expression to be Mitfa-dependent; hence it predicts that Trichostatin A treatment of mitfa mutants would not result in further elevation of sox10 levels above those of untreated mitfa mutant controls. An experimental test of this prediction showed that, indeed, sox10 expression in mitfa mutant embryos is not further elevated by Trichostatin A treatment (Figure S5).

Taken together, our data lead us to conclude that repression of sox10 expression in the melanocyte lineage is both Mitfa-dependent and Hdac-dependent, (most likely mediated by Hdac1 [38]), and that these mechanisms contribute to the differentiation of zebrafish melanocytes in vivo.
Mathematical modelling and refinement of the melanocyte GRN
Our experimental data was consistent with the major predictions of the simple melanocyte GRN that we had proposed. To assess the GRN more rigorously, and to develop a more quantitative understanding of the model, we turned to mathematical modelling. We constructed a simple dynamical model of the GRN based upon ordinary differential equations, where the transcript concentrations were considered as dynamic variables. Our model aimed to describe the mutual regulation of the genes involved in the GRN by simple activatory and repressive dynamics, and the response of the GRN to external activatory signals, designated Factor A. Studies of both mouse and zebrafish have identified multiple enhancers that drive sox10 gene expression in neural crest and its derivatives [37], [40], [41], [42], [43]. The factors binding those enhancers are only poorly characterised in both species, but may include Lef/Tcf (downstream of Wnt signalling), Sox9, FoxD3, Pax and AP2. Since this regulation is poorly understood, for the purposes of our modelling we combine these factors into one composite Factor A. It is currently unclear whether in a neural crest cell context these signals are merely transient, or are constantly available. However, given the highly dispersive nature of neural crest cells, we might assume external signals, like Wnt, may be rather transient. Similarly, zebrafish sox9, sox10, foxd3, pax and tfap2 are all downregulated in neural crest cells as they differentiate into melanocytes [34], [44]–[48]; this work). Nevertheless, the data from mitfa mutants in Figure 7 indicate that, at least in the vicinity of the dorsal neural tube, one or more components of Factor A remain present at 72 hpf at least. Consequently, for the purposes of our modelling studies, we assumed that Factor A was constant throughout embryonic development.
We explored the rigorous predictions of this initial melanocyte GRN (Model A, Figure 9A) by direct simulation with a widespread exploration of parameter space. Given the lack of quantitative knowledge of most parameters, we restricted ourselves to assessing under which conditions (i.e. parameter value sets) the model predicted i) the long-term maintenance of mitfa expression, ii) an initial increase of sox10, leading to its maximal expression at intermediate times, and iii) long-term loss (or downregulation, i.e. below a detection threshold) of sox10 expression, as we have observed in differentiating melanocytes. Direct numerical integration of the ODE system of Model A revealed that the model predicts that both mitfa and sox10 expression are maintained (Figure 9B). However, we found that no parameter settings allowed us to obtain an appreciable difference between sox10 maximal expression and its steady-state value (see Figure S6), as implied by requirements ii) and iii) above. Maintenance of both mitfa and sox10 arises because the sox10-inducing signals (Factor A) are maintained, and these in turn maintain Mitfa expression. Our experimental data above indicates that sox10-inducing signals do seem to persist, at least in the vicinity of the neural tube. However, we note that experimentally, maintenance of Mitfa can be uncoupled from production of Sox10. Our previous study showed that in sox10 mutant neural crest, transient expression of mitfa is sufficient to generate stable (to 5 dpf at least) melanocyte differentiation (Elworthy et al, 2003 [16]). Since this demonstrates that stable melanocyte differentiation can occur in the absence of Sox10 activity if Mitfa is provided even transiently, we rejected Model A as too simplistic. In addition, we noted that it did not incorporate the complexities of Mitfa-mediated regulation of Sox10 as revealed by our experimental studies.

Consequently, we explored the features of a revised model (Model B, Figure 9A) incorporating modifications expected to correct these deficiencies. Firstly, we introduce a Sox10-independent positive feedback loop on Mitfa (Factor Y). Secondly, we add our demonstration that Mitfa-dependent activation of Hdac contributes to the repression of Sox10.
Model B predicts that in mitfa mutant embryos, mitfa transcription should be substantially decreased, due to the absence of the positive feedback through Factor Y. In situ hybridisation shows that mitfa expression in mitfaw2 mutants is distinctly decreased at 30 and 36 hpf ([13], and data not shown), but given that this mutant results in a premature stop codon, nonsense-mediated decay might also explain the lowered mRNA levels. We thus supplemented these observations with analysis of embryos homozygous for the single amino acid substitution (I121S) allele, mitfab692 [49]. In these mutants, we again observed an unambiguous substantial reduction in the levels of mitfa transcripts in the mutant embryos (Figure 10A, 10B), thus providing support for the biological validity of Factor Y.

Mitfa itself is a clear candidate for Factor Y, and indeed in mouse Mitf functions in conjunction with Lef1 and b-catenin to regulate the Mitf promoter [50]. As an initial test whether Mitfa might regulate its own promoter, we asked whether injection of mitfa mRNA would induce transcription of the endogenous mitfa gene. We used an in situ hybridisation probe for the 3′-UTR of mitfa, since the injected mRNA lacks these sequences, as well as examining dct induction as a positive control for Mitfa activity. We saw induction of both dct and mitfa expression upon injection of RNA encoding WT mitfa (Figure 10C, 10D, 10G, 10H), whereas neither were seen after injection of RNA encoding either of the Mitfa mutants, Mitfa(b692) or Mitfa(w2) (Figure 10E, 10F; data not shown). We conclude that a Sox10-independent, Mitfa-dependent Factor Y, predicted from mathematical modelling (and perhaps Mitfa itself), is likely to play a major role in maintaining melanocyte differentiation.
Contrary to our intuition, mathematical simulation of Model B showed that this revised model still failed to generate the required downregulation of sox10 under conditions where mitfa was maintained (see Figure S7). Furthermore, it failed to predict two aspects of the phenotype in sox10 mutant embryos. We found that three further refinements to produce a third model (Model C, Figure 9A) were required for the model to reproduce the experimentally-demonstrated behaviour, as we discuss in the next section.
Further refinement of the melanocyte GRN is required to explain the wild-type and mutant phenotypes
The first modification required is a change to the way that Hdac1-mediated repression functions on sox10 expression. In Model B, we postulated that Hdac1 represses Mitfa-dependent sox10 transcription. However, we found that this was inadequate to allow repression of sox10 expression in the wild-type (Figure 9C), since constant Factor A persists (Figure S7). In this context, the identification of Hdac as a repressive factor becomes rather striking, since the effects of deacetylation might be expected to affect multiple enhancer elements. As we have noted experimentally, sox10 expression is repressed in differentiating melanocytes, so in Model C we show Hdac as repressing Factor A-dependent sox10 expression, as well as Mitfa-dependent activation of sox10 transcription (Figure 9A). This model now reproduces the wild-type observations (Figure 9D and Figure S8).
Secondly, we found that it is crucial to incorporate a threshold response within the Factor Y-mediated feedback in Model B. In the absence of such a threshold, the positive feedback of Factor Y ensures that in sox10 mutants the absence of melanocyte differentiation is only an unstable state associated with [mitfa] = 0, since even the lowest level expression of mitfa would be expected to trigger positive feedback leading to high level mitfa expression and subsequent melanocyte differentiation (Figure 9C, sox10+Mitfa). The biological observations are unambiguous – even vaguely normal looking melanocytes are exceptionally rare in sox10 mutants (RNK, pers. obs.) – suggesting that the positive feedback loop with Factor Y must exhibit threshold behaviour, so that the [mitfa] = 0 state is stabilised at low levels of Mitfa or of Y. In both sox10 and mitfa mutants expressing Mitfa under the sox10 promoter, melanocyte rescue is relatively unlikely (70% of embryos show no melanocytes, and most embryos showing rescue show <10 melanocytes per embryo [16]), but when it does occur melanocyte morphology and differentiation appear normal, consistent with the GRN being bistable. To account for this behaviour, we have incorporated a threshold response to the Factor Y feedback loop.
Thirdly, Model B failed to predict the low level derepression of melanocyte differentiation genes in sox10 or sox10;mitfa double mutants (data not shown). One solution to this problem, a Sox10-independent Factor Z driving (low level) expression of melanocyte differentiation genes, is incorporated into Model C (Figure 9A). Our efforts to model Factor Z initially assumed that it was driven by Factor A, and thus remained constant. However, under these assumptions, we were unable to reproduce the very weak and transient expression of differentiation genes observed experimentally. Instead, we made the assumption that Factor Z is activated by an unknown Factor B, and Factor B is only transiently expressed in the melanocyte lineage. Mathematical exploration of this model shows that, whilst the non-zero wild-type steady state seen before in Model B is conserved, Model C also reproduces the gene expression patterns seen in sox10, mitfa and sox10;mitfa mutants (Figure 9D). In particular, expression of dct (representing the melanocyte differentiation genes repressed by Sox10) is seen at low levels in mitfa, sox10 and sox10;mitfa mutants, but this is weakest and most transient in mitfa mutants.
Sox9b has the properties of Factor Z
This modelling is only useful in so far as it allows us to correctly predict novel features of the biology. We chose to explore candidates for Factor Z. Such genes would have no prominent role in wild-type melanocytes (i.e. loss of gene function would not have a melanisation defect), but they would need to be expressed in neural crest cells and to drive low level melanisation in sox10 mutants; in addition they would be only transiently expressed in melanocyte progenitors.
In adult human melanocytes SOX9 is likely to regulate DCT [30]. There are two zebrafish orthologues of SOX9, but neither sox9a nor sox9b nor sox9a;sox9b mutants show a loss of melanisation [34]. Unlike sox9a, sox9b is expressed in early neural crest cells, but then is downregulated ahead of sox10 in progenitors for all except craniofacial cartilage (data not shown; [34]). We used previously published sox9b morpholinos [51] to address whether morpholino-mediated knockdown of Sox9b would result in loss of residual melanin in sox10 mutants (Figure 11). The numbers of residual melanised cells in sox10 mutants at 2 days post fertilisation (dpf) was significantly reduced in embryos injected with 0.5 ng of each sox9b morpholino compared with embryos injected with sox9b mismatch morpholinos (Figure 11A–11C). We deduce that Sox9b can drive Sox10 and Mitfa-independent melanisation displayed by sox10 mutants.

We conclude that Sox9b shows the characteristics predicted for Factor Z and that it at least contributes to this role in zebrafish. Furthermore, our data provides biological validation of Factor Z, a second feature of the melanocyte GRN predicted as a result of the mathematical modelling. We also note the transient expression of sox9b in NCCs, broadly consistent with our deductions from the modelling above.
Discussion
In this study we have used a combination of genetic experimentation and mathematical modelling to build upon our initial description of melanocyte specification under the control of Sox10 [16]. We have considerably expanded and refined the GRN associated with melanocyte specification and differentiation in embryonic zebrafish (Figure 12). We have shown multiple new features, including 1) Sox10-mediated repression of many Mitfa target genes; 2) the transient nature of Sox10 expression in differentiating melanocytes, resulting from 3) Mitfa-dependent repression of Sox10, likely via 4) a mechanism involving Hdac1 complex; and 5) Sox10-independent weak activation of melanogenesis genes.

An early comparison of the core GRN of melanocytes in mouse and zebrafish had concluded that they were evolutionarily divergent [24]. That comparison focused on a basic description of the role of Sox10 in melanocyte differentiation, noting that in zebrafish there was no requirement beyond melanocyte specification (i.e. activation of mitfa), whereas it was required positively both for melanocyte specification (Mitf expression) and differentiation (Tyr expression) in mouse. The more extensive examination of the zebrafish GRN presented here both supports the suggestion of some evolutionary divergence in the role of Sox10, but also identifies a series of new features that will need to be examined in the mouse system.
The data in the Hou et al study show that Mitf is not sufficient to rescue melanisation in Sox10 mutant neural crest cells, at least in primary cultures of neural crest cells, since Sox10 function is also required to drive Tyr expression [24]. Our data validate our previous conclusion that ongoing Sox10 function is not necessary for melanocyte differentiation in zebrafish in vivo, since mitfa expression in early neural crest cells was sufficient to fully rescue melanocyte differentiation, even up to 5 dpf [16]. However, we now show that Sox10 does have a role beyond melanocyte specification (i.e. transcriptional activation of mitfa), although it appears to be purely repressive. Certainly, the effects of Sox10 on Tyr expression in mouse (synergistic activation with Mitf) and zebrafish (antagonistic repression) are in stark contrast. These data now make untenable the conclusion reached by Hou et al that the differences in the role of Sox10 might explain the differences in timing of melanisation in mammals (late) and fish (early) [24]. Further work to define in much greater detail the melanocyte GRN in each species will allow identification of the key differences between them actually controlling the distinctive timing of melanisation.
Our observations in zebrafish beg the question of whether there is Sox10-dependent repression of melanocyte genes in vivo in mouse. Such studies are hindered by issues of sensitivity of whole mount in situ hybridization and the difficulties of directly comparing gene expression levels in melanocytes of wild-type and mutant strains, but one recent paper attempts to standardise the analysis of gene expression for multiple melanocyte markers in E11.5 mouse embryos. Using their semi-quantitative scoring system, Gpnmb (but not Dct, Si, or Tyr) expression is detectable in Sox10LacZ/LacZ mutants but not in MitfMi/Mi mutants [52], providing a hint that Sox10-dependent repression of melanocyte differentiation genes may occur in mouse.
It certainly seems surprising that two homologous cell-types, with striking conserved phenotypic characteristics, might show such a substantial change in their GRN. Comparison of GRNs in an evolutionary context is still in its infancy, but already examples of substantial differences between the circuitry of homologous cell-types are known. For example, in echinoderm development, conserved gene expression in homologous domains of sea urchins and sea stars often results from divergent regulatory inputs i.e. the output is conserved, but the regulatory mechanism has diverged [53]. Conceptually, it is trivial to imagine how mutations in regions near the binding site of an activatory transcription factor might allow binding of a co-repressor at that promoter. It will be exciting to identify the molecular basis for the change in Sox10 function.
But what might be the biological function of the Feed-Forward Repression by Sox10? In the mouse sympathetic neuron, Kim et al suggest that this circuitry delays differentiation and maintains multipotency [35]. Delay of melanocyte differentiation and maintenance of progenitor multipotency is an attractive hypothesis in the zebrafish too. Recent study of an mitfa:GFP transgenic line indicates that not all neural crest cells that turn on mitfa will become melanocytes, since some will form iridophores instead (Curran et al., 2010). Thus, in zebrafish expression of mitfa does not represent commitment to the melanocyte lineage; the Feed-Forward Repression loop we have defined might contribute to that maintenance of multipotency in the early melanocyte precursor. Loss of Sox10 expression would then be necessary for commitment to a differentiated state. In this context, it is intriguing that mouse melanocytes, which retain Sox10 expression, appear to have also retained multipotency, which can be exhibited when isolated and cultured [54].
We have proposed that Sox10 functions to delay melanocyte differentiation in embryonic zebrafish. Likewise, a similar conclusion was reached for the role of Pax3 in adult mouse melanocyte stem cell differentiation. Thus Lang and colleagues demonstrated that Pax3 acted with Sox10 to drive transcription of Mitf, whilst feed-forward repression by Pax3 delayed expression of dct [55]. Pax3 morphants are not described as having a dramatic melanocyte differentiation phenotype, but the detailed timing of melanocyte differentiation was not examined [44]. Our initial investigations using Pax3 morpholinos (MN and RNK, data not shown) have failed to detect an effect on either wild-type or sox10 mutant melanogenesis, so it remains unclear whether the role for Pax3 is conserved in fish.
One key feature of the zebrafish melanocyte GRN that we have uncovered is the rapid down-regulation of sox10 during early differentiation. A major task will be to elucidate the molecular basis for this. Our study only begins to address this issue, indicating that sox10 repression in melanocytes is Mitfa-dependent, but leaves open whether sox10 is a direct target of Mitfa. Development of further tools for the zebrafish, especially good antibodies for Mitfa to allow ChIP-chip or ChIP-seq studies, will allow this important question to be addressed definitively. Our initial data provide a strong hint that the effect of Mitf, whether direct or indirect, on sox10 is highly context dependent; Mitfa activates the sox10 promoter in the context of embryonic blastomeres, whereas it represses the same promoter in the context of melanoblasts. We note that the 7.2 kb genomic DNA fragment in the Tg(-7.2sox10:GFP) reporter that responds to Mitfa contains 6 consensus M boxes, whereas 3 of these are missing in the Tg(-4.9sox10:GFP) that does not [56]. Testing whether Mitfa directly regulates sox10 in vivo via one or more of the 5′ M boxes is a priority for future work.
We hypothesize that the presence of a repressive cofactor in melanoblasts alters the effect of Mitfa on the sox10 promoter. Little is known of repressive cofactors in zebrafish melanocyte development. Zebrafish histone deacetylase1/colgate (hdac1/col) mutants showed delayed melanocyte differentiation; whilst sox10 expression in early neural crest was indistinguishable from wild-type, sox10 expression was prolonged to at least 52 hpf, although it was unclear if these phenotypes were causally linked [38]. We have shown here that chemical inhibition of Hdac function during the phase of early melanocyte differentiation results in prolonged sox10 expression in differentiating neural crest cells, and in impaired melanogenesis. This is strikingly consistent with the core GRN we have identified here, and supports the hypothesis that Mitfa-dependent repression of sox10 requires Hdac1. However hdac1 expression is both maternal and zygotic [57], so transcriptional regulation of hdac1 itself by Mitfa is unlikely to explain the repression of sox10 in differentiating melanocytes. We speculate that Mitfa may regulate recruitment to the sox10 promoter of an Hdac1 complex [58], resulting in deacetylation of this chromatin and repression of sox10 transcription.
The identification of Mitfa-dependent activation of the Hdac complex proved crucial to explain the repression of sox10 transcription. In our modelling we initially assumed that Mitfa-dependent repression affected only the regulation by Mitfa itself, switching it from an activator to a repressor. However, modelling the GRN in this way proved ineffective, because it failed to shut-down sox10 transcription, apparently due to the fact that whilst the Mitfa influence was repressed, input from Factor A persisted, and hence Factor A-dependent expression became dominant. The realization that Hdac complex mediated the Mitfa-dependent repression immediately provided a resolution to this problem, since deacetylation would be expected to repress activity of many/all enhancers of the sox10 gene, making it likely that Factor A-dependent sox10 expression, as well as Mitfa-dependent expression, would be inactivated in the wild-type situation. In contrast, in the mitfa mutant situation, Factor A remains, so that we see persistent sox10 and mitfa expression, just as observed in vivo. Satisfyingly, this was exactly the behaviour we saw when we modeled the GRN in the light of this insight. Hence, whilst the presence of Factor A seems to persist, as revealed by the mitfa mutant phenotype, our intuition that the influence of Factor A would be transient in the wild-type situation appears to be well-founded, resulting from the global shut-down of sox10 transcription mediated by Hdac complex.
We have demonstrated for the first time that in the presence of Sox10, many Mitfa-mediated transcriptional responses are repressed. At first glance, it is surprising therefore that when we over-express Mitfa in zebrafish blastomeres, melanocyte differentiation genes are expressed robustly, despite the observation that sox10 is also expressed. We propose that the explanation lies in the timing of expression of Sox10 protein. When sox10 mRNA is injected alone, Sox10 protein forms before mitfa can be transcribed. Thus, Mitfa protein is functioning in the context of substantial amounts of Sox10; in contrast, when mitfa is expressed alone, Mitfa protein is functioning before sox10 transcription and hence is working in the absence of Sox10 protein. The test of this is the coinjection of both sox10 and mitfa mRNAs; in this context both Sox10 and Mitfa proteins would be formed together and hence again Mitfa would be functioning in the context of Sox10 protein. The prediction is that melanocyte differentiation genes would be repressed; this prediction is directly borne out by our experimental test (Figure 5). We conclude that our data is, in fact, consistent in suggesting that Sox10 represses Mitfa-mediated melanocyte differentiation.
Nonetheless melanocyte differentiation in vivo occurs whilst sox10 transcripts remain detectable (Figure 1). We propose that, in part, the explanation lies in Sox10-mediated repression depending more on the ratio of Sox10:Mitfa proteins: our preliminary data exploring the effects of changed ratios of sox10:mitfa supports this [56]. In mouse sympathetic neuron differentiation, Sox10 heterozygotes show derepression of Phox2A, but normal expression of MASH1 and Phox2B, indicating that here higher levels of Sox10 are required for repression of differentiation than for specification [35]. In addition, the explanation likely lies in the complex integration of multiple factors as inputs on melanocyte differentiation gene expression. Thus, here we have identified Sox9b as an unexpected factor driving melanocyte differentiation. Given that, as we show here, sox9b expression is not detectable in differentiating melanocytes, this role must be transient, and restricted to the early phase of melanocyte development. Whilst melanisation is consistently repressed in sox10 mutants injected with sox9b morpholinos, effects on residual dct expression were more variable; whereas sox10 mutant embryos injected with the mismatch morpholino showed low level dct expression, this expression was sometimes reduced in sox9b morphant;sox10 mutant embryos, although not statistically significant overall (MN and RNK, data not shown). We suggest that at these early stages of melanocyte differentiation, dct expression reflects the integration of multiple activatory (Mitfa, Sox9b, others?) and inhibitory (Sox10, others?) inputs. Our mathematical modelling here (Figure 9D) shows that this scenario can generate a convincing reproduction of our semi-quantitative in situ observations. The challenge for the future will be in vivo quantitation of the various key parameters of the model in order to examine how precisely the model and the in vivo situation match each other.
Our mathematical modelling approach, used iteratively with experimental data, has made specific predictions about the properties of currently unidentified factors in melanocyte differentiation. Importantly, we illustrate the power of our systems biology approach by experimentally identifying Sox9b as a factor fulfilling the properties of Factor Z. Our data here on melanocytes extends the evidence for partial redundancy of Sox10 and Sox9b in neural crest development initially shown for sensory neurons [28]. Indeed, we noticed that sox9b morphants also show significantly reduced numbers of ‘escaper’ iridophores too (MN and RNK, data not shown), suggesting this partial redundancy between these closely-related transcription factors may be a general feature.
Our modelling also implied the activity of a Sox10-independent, Mitf-dependent transcriptional activator of Mitfa, Factor Y, providing a positive feedback loop to allow stable melanocyte differentiation. We demonstrate that in mitfa mutant zebrafish embryos, mitfa expression is reduced compared with wild-type siblings consistent with our suggestion of a role for Mitfa in maintaining mitfa expression. Consistent with this, we also show that overexpression of Mitfa results in rapid, precocious expression of the endogenous mitfa gene. Likewise, while Mitf expression in mouse E11.5 embryos is prominent throughout the body, in MitfMi/Mi mutants it is weakened and only detectable in the tail, the developmentally youngest region [52]. These data strongly support the suggestion from our modelling that maintenance of mitfa expression is (directly or indirectly) dependent upon Mitfa function, and that this feedback is conserved in mouse melanocytes too.
Apart from Sox10, several other transcription factors have been shown to regulate Mitf [59]. One candidate for Factor Y is CREB, acting downstream of elevated cAMP induced by Melanocyte Stimulating Hormone (MSH)/Melanocortin Receptor 1 (Mc1R) signalling [60]. MSH has a clear role in background adaptation, and Mc1R expression is maintained throughout embryonic development [61], [62]. However, current evidence for the role of Mc1R in melanisation in zebrafish based on morpholino knockdown is conflicting [63], [64]. In our attempts to reproduce these morpholino studies we saw a transient decrease in melanisation, consistent with [63], but this seemed to be in large part due to embryonic retardation, indicating that, in agreement with [64], Mc1R signalling in zebrafish is unlikely to play a major role in melanocyte melanisation (LV and RNK, data not shown). We conclude that Mc1R signalling is not likely to contribute to Factor Y, at least in the embryonic melanocytes.
Understanding the mechanisms stabilizing the differentiated melanocyte fate is likely to have particular relevance for our understanding of melanoma. Levels of the steady state activity of Mitf appear to be crucial to the melanoma phenotype, with high Mitf activity associated with differentiation and lowered levels with proliferation and melanoma [65]. Several factors identified as regulating Mitf in development, also play major roles in melanoma; for example, WNT/b-catenin dependent regulation of MITF transcription has been demonstrated by chromatin immunoprecipitation and plays a major role in the transformed phenotype by promoting both proliferation and survival of melanoma cells [66]. A mouse melanoma model generated by combining melanocyte-specific expression of both constitutively active β-catenin and activated N-ras generates frequent melanomas [67]. In the context of our work, it is interesting that melanocytes from this strain frequently become immortalised, and do not fully pigment [67].
In conclusion, our systems biology approach has identified several new and unexpected features to the core GRN underlying melanocyte specification and differentiation in vivo. We have demonstrated a role for Sox10 in antagonising Mitfa-dependent differentiation; have firstly predicted, then identified Sox9b as part of, a factor with a transient role in Mitfa-independent melanisation observed in sox10 and sox10;mitfa mutants; have predicted and then shown that mitfa expression is, directly or indirectly, Mitfa-dependent; and have provided the first indication that Mitfa might negatively regulate sox10 expression in differentiating melanocytes. Both the latter mechanisms are likely to be major factors stabilising differentiation of melanocytes in zebrafish. The stage is now set for a comprehensive analysis of the zebrafish melanocyte GRN, by incorporation into the model of other known and unknown regulatory functions combined with a network analysis of the motifs identified therein, in order to truly understand the basis for stable differentiation of this medically-important cell-type. We suggest that application of our approach to other medically-important cell-types is likely to be valuable.
Materials and Methods
Ethics statement
This study was performed with the approval of the University of Bath ethics committee and in full accordance with the Animals (Scientific Procedures) Act 1986.
Fish husbandry
Embryos were obtained from natural crosses and staged according to Kimmel et al. [68]. We used the sox10t3 allele [29], the mitfaw2 [13] allele except where stated otherwise, when we used mitfab692 [49], and the Tg(-4725sox10:GFP)ba3 and Tg(-4.9sox10:EGFP)ba2 lines [28], [37].
In situ hybridisation and antibody staining
RNA in situ hybridization was performed according to Thisse et al. [69], except probes were not hydrolysed and embryos were incubated at 68°C in hybridization steps. Probes used were sox10 [15], dct [36], mitfa [13], silva (ZIRC cb397; [70], tyrosinase [71], tyrp1b (clone number 6894514 from Geneservice, GenBank reference CB353867, subcloned as an EcoRI/XhoI fragment into Bluescript), gch [72], xdh [72] and paics (Plasmid and probe generated by T. Chipperfield and C. Nelson).
Antibody staining with anti-Sox10 (1∶10000, [73]) and Alexa Fluor 488 (1∶2000, Invitrogen, A21206) was performed largely as Ungos et al. [74].
Embryos were viewed using an Eclipse E800 (Nikon) using either DIC or fluorescence microscopy as appropriate. Embryos were scored for Sox10 and sox10 expression by scoring 20 pigmented melanocytes in each of 5 embryos at each time point.
RNA injection
One cell stage embryos were injected with RNA using standard methods as in Dutton et al. [15]. RNA was produced and recovered using the mMESSAGE mMACHINE and MEGAclear kits (Ambion) from hs>sox10 and hs>sox10m618 templates linearized with Asp718 [15] or CS2+mitfaWT and CS2+mitfaw2 linearised with Not1 [13]. sox10, sox10m618 and mitfaw2 RNA were diluted to a concentration of 25 ng/µl, mitfa RNA was diluted to 6.25 ng/µl including 0.0005% Phenol Red. Embryos were injected with 4.6 nl RNA and grown for 6 or 10.5 hours at 28.5°C. Embryos were then processed for in situ hybridisation or scored for GFP fluorescence using an MZ12 dissecting microscope (Leica).
Promoter analysis
DNA sequence was submitted to TRANSFAC public version 6.0 using the Pattern Search for Transcription Factor Binding Sites (PATCH 1.0) interface. Parameters were set to look for vertebrate transcription factor binding sites of 6 bp or more with the maximum number of mismatches being set at zero [75].
Chemical inhibition
Trichostatin A (TSA, [R-(E,E)]-7-[4-(Dimethylamino)phenyl]-N-hydroxy-4,6-dimethyl-7-oxo-2,4-heptadienamide)(Sigma-Aldrich) was kept as a 5 mM in DMSO stock solution (0.2 µm-filtered) at −20C. Batches of embryos were treated with 1 µM Trichostatin A in Petri dishes, during each of four time windows (from 12 hpf to 48 hpf, from 24 hpf to 48 hpf, from 30 hpf to 48 hpf and from 36 hpf to 48 hpf) at 28.5°C. Control embryos received equivalent doses of DMSO alone. Melanocyte phenotypes of live embryos were documented at 48 hpf under a Nikon E800 microscope; embryos were anesthetized with Tricaine (Sigma-Aldrich) and mounted on slides under coverslips in 30% methylcellulose.
Quantitative real-time PCR
RNA was extracted from samples of 40 embryos of each genotype (decapitated after anaesthesis with Tricaine) using TRIREAGENT (Sigma-Aldrich, T9424). First strand cDNA was synthesized using the Invitrogen First strand cDNA synthesis kit with Superscript III and random hexamers. Real time quantitative PCR was performed in duplicate using SYBR Green I PCR Master Mix (Roche) and a Lightcycler II machine according to the manufacturer's instructions. Primers were designed spanning an intron using Primer3 Plus software (http://www.bioinformatics.nl/cgi-bin/primer3plus/primer3plus.cgi.). The following primers were used: gapdh: forward ACCAACTGCCTGGCTCCT, reverse TACTTTGCCTACAGCCTTGG; mitfa: forward CTGGACCATGTGGCAAGTTT, reverse GAGGTTGTGGTTGTCCTTCT; dct: forward TCTTCCCACCTGTGACCAAT, reverse CTGATGTGTCCAGCTCTCCA; trp1b: forward CGACAACCTGGGATACACCT, reverse AACCAGCACCACTGCAACTA. Gene expression was normalized against zebrafish gapdh expression in wild-type embryos. Quantitative RT-PCR data were analysed using the (ΔΔCt) method [76]. Student's t-test with Bonferroni correction for multiple comparison were performed using GraphPadPrism 5.0 to test the null hypothesis that there was no significant difference in gene expression levels between mitfa and sox10 mutants. In all tests, difference was considered significant if p<0.017.
Mathematical modelling
We constructed a mathematical model for gene regulation as a one stage process: binding and unbinding of transcription factors (TFs) to DNA was assumed to regulate protein production in a single step of synthesis, without explicit modelling of intermediate mRNA levels. The model was expressed in terms of a system of ordinary differential equations (ODEs). Binding and unbinding of TFs were described as faster processes than protein synthesis and degradation. This allowed us to solve the transcript dynamics in conditions of quasi-equilibrium for the TFs. The result was a description of both activatory and repressive regulation in terms of Hill-like functions. By using appropriate combinations of Hill functions, Models A, B and C (Figure 9A) were then described mathematically. The derivation is presented in the accompanying Text S1.
Models were investigated by direct numerical integration and, in the case of Model C for the sox10 mutant, by steady-state analysis. The steady-state analysis was obtained by setting time derivatives to zero, and by solving analytically the corresponding set of algebraic equations. This gave information about the long time behaviour of this GRN, and allowed us to draw conclusions independent of the particular set of chosen parameters. The time-dependent solution was computed numerically by using a standard finite differences algorithm (Euler). Parameter values were chosen so as to reproduce the sought behavior, constrained by available experimental evidence whenever possible. For instance, knowledge about typical time scales of the relevant concentrations fixed gene expression and decay rates.
Furthermore, the robustness of our conclusions with respect to the chosen parameter values was assessed by plotting the steady state value of Mitfa, and the steady state and the maximal values of Sox10, as functions of the different activatory and repressive regulations between mitfa and sox10 in all studied models (see Figures S6, S7, S8). Here our aim was not to identify a unique parameter set that reproduced the experimental data, but rather to assess to what extent our conclusions might be broadly independent of the specifically chosen parameters. In this sense our results should be taken as qualitative, given the lack of knowledge of most parameter values, but still representative of typical dynamical behavior.
Supporting Information
Zdroje
1. DavidsonEHRastJPOliveriPRansickACalestaniC 2002 A genomic regulatory network for development. Science 295 1669 1678
2. Ben-Tabou de-LeonSDavidsonEH 2006 Deciphering the underlying mechanism of specification and differentiation: the sea urchin gene regulatory network. Sci STKE 2006 pe47
3. HuangSGuoYPMayGEnverT 2007 Bifurcation dynamics in lineage-commitment in bipotent progenitor cells. Dev Biol 305 695 713
4. WhiteRJNieQLanderADSchillingTF 2007 Complex regulation of cyp26a1 creates a robust retinoic acid gradient in the zebrafish embryo. PLoS Biol 5 e304 doi:10.1371/journal.pbio.0050304
5. GiudicelliFOzbudakEMWrightGJLewisJ 2007 Setting the tempo in development: an investigation of the zebrafish somite clock mechanism. PLoS Biol 5 e150 doi:10.1371/journal.pbio.0050150
6. NordlundJJBoissyREHearingVJKingCYOettingWS 2006 The Pigmentary System: Physiology and Pathophysiology Malden, Oxford, Victoria Blackwell Publishing Ltd
7. BennettDCLamoreuxML 2003 The color loci of mice–a genetic century. Pigment Cell Res 16 333 344
8. RaibleDWWoodAHodsdonWHenionPDWestonJA 1992 Segregation and early dispersal of neural crest cells in the embryonic zebrafish. Dev Dyn 195 29 42
9. RawlesME 1947 Origin of pigment cells from the neural crest in the mouse embryo. Physiol Zool 20 248 266
10. SchillingTFKimmelCB 1994 Segment and cell type lineage restrictions during pharyngeal arch development in the zebrafish embryo. Development 120 483 494
11. NishimuraEKJordanSAOshimaHYoshidaHOsawaM 2002 Dominant role of the niche in melanocyte stem-cell fate determination. Nature 416 854 860
12. HodgkinsonCAMooreKJNakayamaASteingrimssonECopelandNG 1993 Mutations at the mouse microphthalmia locus are associated with defects in a gene encoding a novel basic-helix-loop-helix-zipper protein. Cell 74 395 404
13. ListerJARobertsonCPLepageTJohnsonSLRaibleDW 1999 nacre encodes a zebrafish microphthalmia-related protein that regulates neural-crest-derived pigment cell fate. Development 126 3757 3767
14. BondurandNPingaultVGoerichDELemortNSockE 2000 Interaction among SOX10, PAX3 and MITF, three genes altered in Waardenburg syndrome. Hum Mol Genet 9 1907 1917
15. DuttonKAPaulinyALopesSSElworthySCarneyTJ 2001 Zebrafish colourless encodes sox10 and specifies non-ectomesenchymal neural crest fates. Development 128 4113 4125
16. ElworthySListerJACarneyTJRaibleDWKelshRN 2003 Transcriptional regulation of mitfa accounts for the sox10 requirement in zebrafish melanophore development. Development 130 2809 2818
17. LeeMGoodallJVerasteguiCBallottiRGodingCR 2000 Direct regulation of the microphthalmia promoter by Sox10 links Waardenburg-Shah syndrome (WS4)-associated hypopigmentation and deafness to WS2. J Biol Chem 275 37978 37983
18. PotterfSBFurumuraMDunnKJArnheiterHPavanWJ 2000 Transcription factor hierarchy in Waardenburg syndrome: regulation of MITF expression by SOX10 and PAX3. Hum Genet 107 1 6
19. VerasteguiCBilleKOrtonneJPBallottiR 2000 Regulation of the microphthalmia-associated transcription factor gene by the Waardenburg syndrome type 4 gene, SOX10. J Biol Chem 275 30757 30760
20. WatanabeKTakedaKYasumotoKUdonoTSaitoH 2002 Identification of a distal enhancer for the melanocyte-specific promoter of the MITF gene. Pigment Cell Res 15 201 211
21. CroninJCWunderlichJLoftusSKPrickettTDWeiX 2009 Frequent mutations in the MITF pathway in melanoma. Pigment Cell Melanoma Res 22 435 444
22. GarrawayLAWidlundHRRubinMAGetzGBergerAJ 2005 Integrative genomic analyses identify MITF as a lineage survival oncogene amplified in malignant melanoma. Nature 436 117 122
23. MurisierFGuichardSBeermannF 2007 The tyrosinase enhancer is activated by Sox10 and Mitf in mouse melanocytes. Pigment Cell Res 20 173 184
24. HouLArnheiterHPavanWJ 2006 Interspecies difference in the regulation of melanocyte development by SOX10 and MITF. Proc Natl Acad Sci U S A 103 9081 9085
25. LudwigARehbergSWegnerM 2004 Melanocyte-specific expression of dopachrome tautomerase is dependent on synergistic gene activation by the Sox10 and Mitf transcription factors. FEBS Lett 556 236 244
26. JiaoZMollaaghababaRPavanWJAntonellisAGreenED 2004 Direct interaction of Sox10 with the promoter of murine Dopachrome Tautomerase (Dct) and synergistic activation of Dct expression with Mitf. Pigment Cell Res 17 352 362
27. PotterfSBMollaaghababaRHouLSouthard-SmithEMHornyakTJ 2001 Analysis of SOX10 function in neural crest-derived melanocyte development: SOX10-dependent transcriptional control of dopachrome tautomerase. Dev Biol 237 245 257
28. CarneyTJDuttonKAGreenhillEDelfino-MachinMDufourcqP 2006 A direct role for Sox10 in specification of neural crest-derived sensory neurons. Development 133 4619 4630
29. KelshRNBrandMJiangYJHeisenbergCPLinS 1996 Zebrafish pigmentation mutations and the processes of neural crest development. Development 123 369 389
30. PasseronTValenciaJCBertolottoCHoashiTLe PapeE 2007 SOX9 is a key player in ultraviolet B-induced melanocyte differentiation and pigmentation. Proc Natl Acad Sci U S A 104 13984 13989
31. CookALSmithAGSmitDJLeonardJHSturmRA 2005 Co-expression of SOX9 and SOX10 during melanocytic differentiation in vitro. Exp Cell Res 308 222 235
32. ChiangEFPaiCIWyattMYanYLPostlethwaitJ 2001 Two sox9 genes on duplicated zebrafish chromosomes: expression of similar transcription activators in distinct sites. Dev Biol 231 149 163
33. LiMZhaoCWangYZhaoZMengA 2002 Zebrafish sox9b is an early neural crest marker. Dev Genes Evol 212 203 206
34. YanYLWilloughbyJLiuDCrumpJGWilsonC 2005 A pair of Sox: distinct and overlapping functions of zebrafish sox9 co-orthologs in craniofacial and pectoral fin development. Development 132 1069 1083
35. KimJLoLDormandEAndersonDJ 2003 SOX10 maintains multipotency and inhibits neuronal differentiation of neural crest stem cells. Neuron 38 17 31
36. KelshRNSchmidBEisenJS 2000 Genetic analysis of melanophore development in zebrafish embryos. Dev Biol 225 277 293
37. DuttonJRAntonellisACarneyTJRodriguesFSPavanWJ 2008 An evolutionarily conserved intronic region controls the spatiotemporal expression of the transcription factor Sox10. BMC Dev Biol 8 105
38. IgnatiusMSMooseHEEl-HodiriHMHenionPD 2008 colgate/hdac1 Repression of foxd3 expression is required to permit mitfa-dependent melanogenesis. Dev Biol 313 568 583
39. PlasterNSonntagCSchillingTFHammerschmidtM 2007 REREa/Atrophin-2 interacts with histone deacetylase and Fgf8 signaling to regulate multiple processes of zebrafish development. Dev Dyn 236 1891 1904
40. AntonellisAHuynhJLLee-LinSQVintonRMRenaudG 2008 Identification of neural crest and glial enhancers at the mouse Sox10 locus through transgenesis in zebrafish. PLoS Genet 4 e1000174 doi:10.1371/journal.pgen.1000174
41. WernerTHammerAWahlbuhlMBoslMRWegnerM 2007 Multiple conserved regulatory elements with overlapping functions determine Sox10 expression in mouse embryogenesis. Nucleic Acids Res 35 6526 6538
42. DealKKCantrellVAChandlerRLSaundersTLMortlockDP 2006 Distant regulatory elements in a Sox10-beta GEO BAC transgene are required for expression of Sox10 in the enteric nervous system and other neural crest-derived tissues. Dev Dyn 235 1413 1432
43. AntonellisABennettWRMenheniottTRPrasadABLee-LinSQ 2006 Deletion of long-range sequences at Sox10 compromises developmental expression in a mouse model of Waardenburg-Shah (WS4) syndrome. Hum Mol Genet 15 259 271
44. MinchinJEHughesSM 2008 Sequential actions of Pax3 and Pax7 drive xanthophore development in zebrafish neural crest. Dev Biol 317 508 522
45. OdenthalJNusslein-VolhardC 1998 fork head domain genes in zebrafish. Dev Genes Evol 208 245 258
46. KnightRDNairSNelsonSSAfsharAJavidanY 2003 lockjaw encodes a zebrafish tfap2a required for early neural crest development. Development 130 5755 5768
47. Barrallo-GimenoAHolzschuhJDrieverWKnapikEW 2004 Neural crest survival and differentiation in zebrafish depends on mont blanc/tfap2a gene function. Development 131 1463 1477
48. LiWCornellRA 2007 Redundant activities of Tfap2a and Tfap2c are required for neural crest induction and development of other non-neural ectoderm derivatives in zebrafish embryos. Dev Biol 304 338 354
49. ListerJACloseJRaibleDW 2001 Duplicate mitf genes in zebrafish: complementary expression and conservation of melanogenic potential. Dev Biol 237 333 344
50. SaitoHYasumotoKTakedaKTakahashiKFukuzakiA 2002 Melanocyte-specific microphthalmia-associated transcription factor isoform activates its own gene promoter through physical interaction with lymphoid-enhancing factor 1. J Biol Chem 277 28787 28794
51. DuttonKAbbasLSpencerJBrannonCMowbrayC 2009 A zebrafish model for Waardenburg syndrome type IV reveals diverse roles for Sox10 in the otic vesicle. Dis Model Mech 2 68 83
52. LoftusSKBaxterLLBuacKWatkins-ChowDELarsonDM 2009 Comparison of melanoblast expression patterns identifies distinct classes of genes. Pigment Cell Melanoma Res 22 611 622
53. HinmanVFYankuraKAMcCauleyBS 2009 Evolution of gene regulatory network architectures: examples of subcircuit conservation and plasticity between classes of echinoderms. Biochim Biophys Acta 1789 326 332
54. MotohashiTYamanakaKChibaKAokiHKunisadaT 2009 Unexpected Multipotency of Melanoblasts Isolated from Murine Skin. Stem Cells 27 888 897
55. LangDLuMMHuangLEnglekaKAZhangM 2005 Pax3 functions at a nodal point in melanocyte stem cell differentiation. Nature 433 884 887
56. GreenhillER 2008 Genetic regulation of neural crest cell differentiation Bath University of Bath 210
57. CunliffeVT 2004 Histone deacetylase 1 is required to repress Notch target gene expression during zebrafish neurogenesis and to maintain the production of motoneurones in response to hedgehog signalling. Development 131 2983 2995
58. CunliffeVT 2008 Eloquent silence: developmental functions of Class I histone deacetylases. Curr Opin Genet Dev 18 404 410
59. VanceKWGodingCR 2004 The transcription network regulating melanocyte development and melanoma. Pigment Cell Res 17 318 325
60. PriceERHorstmannMAWellsAGWeilbaecherKNTakemotoCM 1998 alpha-Melanocyte-stimulating hormone signaling regulates expression of microphthalmia, a gene deficient in Waardenburg syndrome. J Biol Chem 273 33042 33047
61. LoganDWBryson-RichardsonRJPaganKETaylorMSCurriePD 2003 The structure and evolution of the melanocortin and MCH receptors in fish and mammals. Genomics 81 184 191
62. LoganDWBurnSFJacksonIJ 2006 Regulation of pigmentation in zebrafish melanophores. Pigment Cell Res 19 206 213
63. GrossJBBorowskyRTabinCJ 2009 A novel role for Mc1r in the parallel evolution of depigmentation in independent populations of the cavefish Astyanax mexicanus. PLoS Genet 5 e1000326 doi:10.1371/journal.pgen.1000326
64. RichardsonJLundegaardPRReynoldsNLDorinJRPorteousDJ 2008 mc1r Pathway regulation of zebrafish melanosome dispersion. Zebrafish 5 289 295
65. CarreiraSGoodallJDenatLRodriguezMNuciforoP 2006 Mitf regulation of Dia1 controls melanoma proliferation and invasiveness. Genes Dev 20 3426 3439
66. WidlundHRHorstmannMAPriceERCuiJLessnickSL 2002 Beta-catenin-induced melanoma growth requires the downstream target Microphthalmia-associated transcription factor. J Cell Biol 158 1079 1087
67. DelmasVBeermannFMartinozziSCarreiraSAckermannJ 2007 Beta-catenin induces immortalization of melanocytes by suppressing p16INK4a expression and cooperates with N-Ras in melanoma development. Genes Dev 21 2923 2935
68. KimmelCBBallardWWKimmelSRUllmannBSchillingTF 1995 Stages of Embryonic Development of the Zebrafish. Dev Dynamics 203 253 310
69. ThisseCThisseBSchillingTFPostlethwaitJH 1993 Structure of the zebrafish snail1 gene and its expression in wild-type, spadetail and no tail mutant embryos. Development 119 1203 1215
70. ThisseBPfumioSFürthauerMBLHeyerV 2001 Expression of the zebrafish genome during embryogenesis. ZFIN online publication
71. CampELardelliM 2001 Tyrosinase gene expression in zebrafish embryos. Dev Genes Evol 211 150 153
72. ParichyDMRansomDGPawBZonLIJohnsonSL 2000 An orthologue of the kit-related gene fms is required for development of neural crest-derived xanthophores and a subpopulation of adult melanocytes in the zebrafish, Danio rerio. Development 127 3031 3044
73. ParkHCBoyceJShinJAppelB 2005 Oligodendrocyte specification in zebrafish requires notch-regulated cyclin-dependent kinase inhibitor function. J Neurosci 25 6836 6844
74. UngosJMKarlstromRORaibleDW 2003 Hedgehog signaling is directly required for the development of zebrafish dorsal root ganglia neurons. Development 130 5351 5362
75. MatysVFrickeEGeffersRGosslingEHaubrockM 2003 TRANSFAC: transcriptional regulation, from patterns to profiles. Nucleic Acids Res 31 374 378
76. LivakKJSchmittgenTD 2001 Analysis of relative gene expression data using real-time quantitative PCR and the 2(−Delta Delta C(T)) Method. Methods 25 402 408
Štítky
Genetika Reprodukční medicínaČlánek vyšel v časopise
PLOS Genetics
2011 Číslo 9
Nejčtenější v tomto čísle
- Retrotransposon-Induced Heterochromatin Spreading in the Mouse Revealed by Insertional Polymorphisms
- The Evolutionarily Conserved Longevity Determinants HCF-1 and SIR-2.1/SIRT1 Collaborate to Regulate DAF-16/FOXO
- Genome-Wide Analysis of Heteroduplex DNA in Mismatch Repair–Deficient Yeast Cells Reveals Novel Properties of Meiotic Recombination Pathways
- Association of eGFR-Related Loci Identified by GWAS with Incident CKD and ESRD