
A Genome-Wide Metabolic QTL Analysis in Europeans Implicates Two Loci Shaped by Recent Positive Selection
We have performed a metabolite quantitative trait locus (mQTL) study of the 1H nuclear magnetic resonance spectroscopy (1H NMR) metabolome in humans, building on recent targeted knowledge of genetic drivers of metabolic regulation. Urine and plasma samples were collected from two cohorts of individuals of European descent, with one cohort comprised of female twins donating samples longitudinally. Sample metabolite concentrations were quantified by 1H NMR and tested for association with genome-wide single-nucleotide polymorphisms (SNPs). Four metabolites' concentrations exhibited significant, replicable association with SNP variation (8.6×10⁻¹¹<p<2.8×10⁻²³). Three of these—trimethylamine, 3-amino-isobutyrate, and an N-acetylated compound—were measured in urine. The other—dimethylamine—was measured in plasma. Trimethylamine and dimethylamine mapped to a single genetic region (hence we report a total of three implicated genomic regions). Two of the three hit regions lie within haplotype blocks (at 2p13.1 and 10q24.2) that carry the genetic signature of strong, recent, positive selection in European populations. Genes NAT8 and PYROXD2, both with relatively uncharacterized functional roles, are good candidates for mediating the corresponding mQTL associations. The study's longitudinal twin design allowed detailed variance-components analysis of the sources of population variation in metabolite levels. The mQTLs explained 40%–64% of biological population variation in the corresponding metabolites' concentrations. These effect sizes are stronger than those reported in a recent, targeted mQTL study of metabolites in serum using the targeted-metabolomics Biocrates platform. By re-analysing our plasma samples using the Biocrates platform, we replicated the mQTL findings of the previous study and discovered a previously uncharacterized yet substantial familial component of variation in metabolite levels in addition to the heritability contribution from the corresponding mQTL effects.
Published in the journal:
. PLoS Genet 7(9): e32767. doi:10.1371/journal.pgen.1002270
Category:
Research Article
doi:
https://doi.org/10.1371/journal.pgen.1002270
Summary
We have performed a metabolite quantitative trait locus (mQTL) study of the 1H nuclear magnetic resonance spectroscopy (1H NMR) metabolome in humans, building on recent targeted knowledge of genetic drivers of metabolic regulation. Urine and plasma samples were collected from two cohorts of individuals of European descent, with one cohort comprised of female twins donating samples longitudinally. Sample metabolite concentrations were quantified by 1H NMR and tested for association with genome-wide single-nucleotide polymorphisms (SNPs). Four metabolites' concentrations exhibited significant, replicable association with SNP variation (8.6×10⁻¹¹<p<2.8×10⁻²³). Three of these—trimethylamine, 3-amino-isobutyrate, and an N-acetylated compound—were measured in urine. The other—dimethylamine—was measured in plasma. Trimethylamine and dimethylamine mapped to a single genetic region (hence we report a total of three implicated genomic regions). Two of the three hit regions lie within haplotype blocks (at 2p13.1 and 10q24.2) that carry the genetic signature of strong, recent, positive selection in European populations. Genes NAT8 and PYROXD2, both with relatively uncharacterized functional roles, are good candidates for mediating the corresponding mQTL associations. The study's longitudinal twin design allowed detailed variance-components analysis of the sources of population variation in metabolite levels. The mQTLs explained 40%–64% of biological population variation in the corresponding metabolites' concentrations. These effect sizes are stronger than those reported in a recent, targeted mQTL study of metabolites in serum using the targeted-metabolomics Biocrates platform. By re-analysing our plasma samples using the Biocrates platform, we replicated the mQTL findings of the previous study and discovered a previously uncharacterized yet substantial familial component of variation in metabolite levels in addition to the heritability contribution from the corresponding mQTL effects.
Introduction
Expression quantitative trait loci (eQTL) studies have proved a powerful aid to functional genomics, with many thousand genetic loci now highlighted that affect RNA transcription levels or splicing in human tissues [1]. eQTL studies have accelerated the characterization of biological mechanisms governing gene regulation [2]–[5], and genome-wide multi-tissue maps of known eQTLs have clarified the biological basis for a proportion of disease-associated [6]–[7] and positively selected [8] loci (e.g. http://eqtl.uchicago.edu/cgi-bin/gbrowse/eqtl/). Genetic variation at eQTLs can be incorporated into network models that help define dependence between genotypes, molecular traits, environment, and physiological states [9]–[10]. The success of eQTL studies points to the potential value in applying the eQTL paradigm to other molecular traits besides mRNA transcript levels [11]–[14]. In the current study, we associate genome-wide genetic variation with concentrations of metabolites, small molecules involved in biochemical processes in living systems, which can be measured in samples such as biofluids and tissue extracts using 1H nuclear magnetic resonance spectroscopy (1H NMR) [15]–[17], or by the Biocrates platform. (For convenience, we use the term ‘Biocrates platform’ in the current paper to refer to the targeted-metabolomic platform using flow-injection tandem mass spectrometry—FIA-MS—developed by Biocrates Life Sciences [14], [18].)
Metabolites are mechanistically further removed from the genome than are mRNAs, creating an important qualitative distinction between metabolite QTL (mQTL) and eQTL studies. The mRNA-to-gene mapping is a useful property of eQTL studies, allowing the search for a cis eQTL of each mRNA to be focused on a relatively small, gene-centred region. Moreover, most known eQTLs are cis-acting single-nucleotide polymorphisms (SNPs), lying usually within tens of kb of the genes whose expression they influence [1], [5]. Whilst metabolite concentrations are influenced indirectly by mRNA and protein expression, there is not typically a one-to-one metabolite-to-gene correspondence known, or indeed expected, a priori. An mQTL study tests variation in each metabolite for association with genome-wide genetic variation. As such a large number of tests is performed, effect sizes must be substantially larger to be reach statistical significance. Thus, as well as being potentially rarer, mQTLs are typically more difficult to detect than eQTLs of equivalent effect size.
A number of recent studies have reported mQTLs for serum metabolite concentrations in humans [14], [19]. Illig et al. [14] genotyped 1,809 individuals of Northern European ancestry at genome-wide single-nucleotide polymorphisms (SNPs), and determined concentrations of 163 metabolites in serum samples from the same individuals, using the Biocrates platform (targeted metabolomics using FIA-MS) [18]. They went on to quantify association between each SNP and a derived set of 26,569 metabolic traits (including 163 raw metabolite concentrations and all pair-wise metabolite concentration ratios). They discovered nine significant, replicable associations between metabolite concentration ratios and SNPs. We demonstrate in the current paper that their study [14] was well powered to detect mQTLs explaining approximately 3% or more of population variation in those serum metabolites targeted by Biocrates. In the current paper the effect size of an mQTL is defined to be the proportion of population variation in metabolite concentration that is explained by genetic variation at the corresponding mQTL SNP.
The primary question addressed by our study is: ‘Are there 1H NMR-detectable metabolites in urine or plasma that are strongly influenced by common single-locus genetic variation?’ To this end, we performed an mQTL-discovery study using 1H NMR to analyse plasma and urine samples from multiple cohorts (see Results and Materials and Methods). 1H NMR is an untargeted, discovery-driven approach that covers many important substances involved in major biochemical functions and key intermediary processes [16]. Our study demonstrates the existence of mQTLs of larger effect size than those reported in [14] for the untargeted set of metabolites detectable by 1H NMR, in urine as well as plasma (urine is previously unexplored for mQTLs). The current paper's secondary aim was to provide further support for the findings of [14]. We conducted replication of the findings of [14], using the Biocrates platform to assay our set of plasma samples. We replicated additional mQTLs, and characterized the familial component of biological variation in mQTL-driven metabolite levels, augmenting the mQTL-derived heritability.
Results
Cohorts and data acquisition
We collected plasma and urine samples from participants across two cohorts—MolTWIN and MolOBB—as part of the MolPAGE programme. The MolTWIN cohort comprised 142 female twins of Northern European descent, who donated samples longitudinally. The MolOBB cohort comprised 69 participants in the Oxford Biobank (OBB) [20].
For all participants across both cohorts we acquired: 1H NMR spectra on plasma and urine samples; Biocrates-platform metabolite concentration data on plasma samples; and genome-wide SNP data (see Materials and Methods).
Extraction of metabolite peaks from spectra and genome-wide scan (1H NMR)
Analysis of a biological sample by 1H NMR provides a spectrum, which is comprised of the superimposed spectral profiles of individual metabolites; a metabolite's profile is made up of peaks from each chemically distinct hydrogen atom in the corresponding molecule. The peak position of a given hydrogen on the horizontal (frequency) axis is known as a chemical shift and is quoted in parts per million (ppm, often termed a value) from that of a reference substance. The concentration of each detectable hydrogen-containing metabolite can be inferred from the area under its total specific profile, or under a specific peak if the number of protons contributing to it is known. We preprocessed spectra, and extracted a total of 526 metabolite peaks from each pair of samples, i.e. the two samples (plasma and urine) donated by a participant on a visit to the clinic. These peaks represent fewer than 526 metabolites with some redundancy (see Materials and Methods).
Using data from the MolTWIN cohort, each of the 526 metabolite peaks was tested for association with 2,541,644 autosomal SNPs (of which 2,245,627 were imputed and 296,017 were typed). In order to address both multiple testing and the kinship of twin pairs, we used a permutation-based procedure, constraining the genome-wide false-discovery probability to be less than 0.001 for each metabolite peak's genome-wide scan.
We detected, and then replicated, four metabolites driven largely by SNP variation (), across three genomic regions, explaining between 40%–64% of biological population variation in these four metabolites' concentrations. Genetic details of the hit regions are shown in Table 1. Note that there are only three hit regions for the four metabolites because two metabolites mapped to a single, shared region. One of the mQTLs is in strong linkage disequilibrium (LD, reviewed in [21]) with SNP variation associated with renal function [22]–[23]. We found that two of the three mQTL regions exhibited genetic evidence of having experienced strong, recent positive selection in European populations (further details of these findings are presented later, in dedicated sections in Results and Discussion).

Identification of metabolites (1H NMR)
We proceeded to identify as many of the mQTL-driven metabolites as possible using a combination of: the web-based human metabolome database [24], our in-house developed database, statistical total correlation analysis [25], and other literature [26]. We unambiguously identified three out of four metabolites, and partially identified the fourth. The mQTL at chromosome 10q24.2 had two associated metabolites, identified as trimethylamine in urine (TMAu), and dimethylamine in plasma (DMAp). The mQTL at 5p13.2 affects urine concentration of 3-amino-isobutyrate (a.k.a. β-amino-isobutyrate, denoted by BAIBu).
The mQTL at 2p13.1 associates with concentrations of one or more urine metabolites that we partially identified as N-acetylated compound(s): X.NH.CO.CH3, with X unknown; we denote this set of one or more metabolites as N-ACu. We were unable to annotate N-ACu unambiguously despite conducting a number of additional experiments, including: seven experiments in which we spiked candidate compounds into selected urine samples and then re-measured the 1H NMR spectra; solid phase extraction experiments on urine samples in which we attempted to separate out N-ACu and thus aid its identification; and 2-dimensional 1H-13C heteronuclear single quantum coherence NMR spectroscopy experiments on selected urine samples.
Table 2 summarizes these metabolite annotations. Figure S1 displays the three mQTL-driven urine metabolite peaks on the same scale, allowing visual assessment of their relative size.

Mixed-effects analysis of hit regions (1H NMR)
We went on to characterize more accurately each metabolite's associations with SNPs within 200 kb of the hit regions. We used a linear mixed-effects model to account for: the sharing of genes and environment across twins, the collection of multiple samples longitudinally from some subjects, and the technical replication of each biological sample (see Materials and Methods).
Under this model, we calculated p-values for the test of no association between the metabolite and each regional SNP in turn. Figure 1, Figure 2, Figures S2 and S3 display the p-values for all regional tests of association superimposed on patterns of LD and the positions of genes. The details of association of each metabolite with its most strongly associated SNP are listed in Table 3, while Table S1 contains association results for SNPs within 200 kb of hit regions. The relationship between metabolite concentration and genotype is presented graphically in Figure 3.


Variance decomposition of metabolite concentrations (1H NMR and Biocrates)
For 1H NMR mQTLs, we estimated the proportion of biological variation in the metabolite's concentration explained by the corresponding mQTL SNP, and decomposed the remaining variation into familial, individual-environmental, and longitudinally fluctuating (visit) effects (Figure 4, Table 4, and Materials and Methods). The familial component of variation modelled the combined effects of genome-wide identity-by-descent genetic sharing, and common environment (i.e. environmental influences shared by twins after their conception). The individual-visit and common-visit components of variation modelled the longitudinal fluctuations between sample-donation visits that were respectively non-shared and shared by twins in a pair (the common-visit effect was included in the model because twins visited the clinic in pairs).

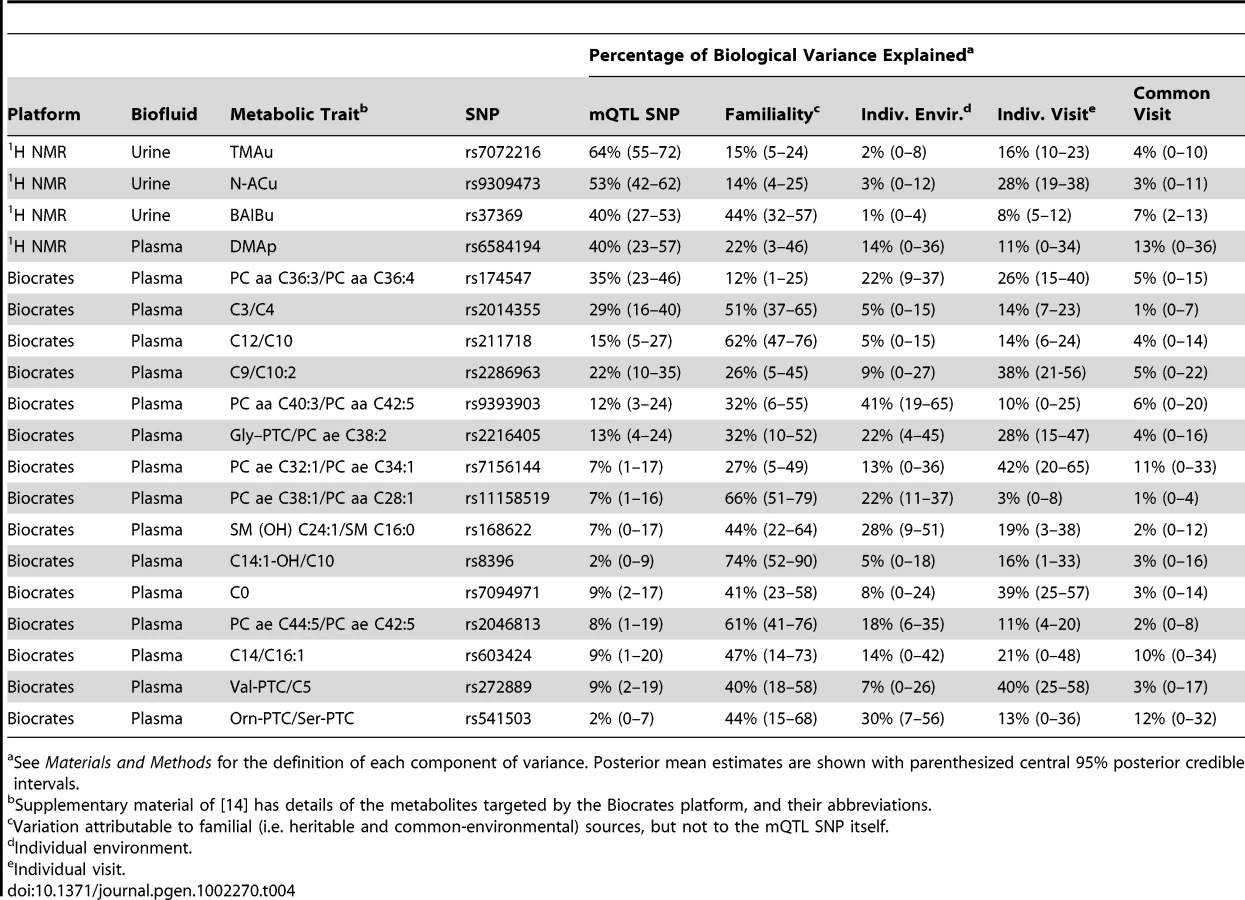
The proportions shown in Figure 4 and Table 4 are proportions of phenotypic variance after the experimental variance has been removed. It was useful to extract the experimental variance prior to comparison across platforms, as the primary focus was on the variability properties of the metabolite concentrations, not on the experimental variation associated with the measurement process. The mQTLs explained 40%–64% of biological population variation in the corresponding 1H NMR metabolite levels.
We also performed a variance decomposition of the metabolic traits, quantified on the Biocrates platform, for which mQTLs were identified in [14] (Figure 4, Table 4, and Materials and Methods). The Biocrates-platform mQTLs explained up to 35% of biological variation in the corresponding metabolic traits (smaller effect sizes than for the 1H NMR mQTLs). Our results qualitatively extended the findings of [14]: the current study's design allowed the decomposition of the component of variation in metabolite concentration that was not explained by the mQTL itself (see Discussion).
To investigate potential bias in effect-size estimates (the “winner's curse” phenomenon [27]), we compared effect-size estimates across discovery and replication studies, both for the Biocrates-platform mQTLs (Figure S4), and for the 1H NMR mQTLs (Figure S5). We found there to be a good degree of consistency in effect-size estimates between discovery and replication studies.
Quantification of study power (1H NMR and Biocrates)
Figure 5 relates the detectable effect size (the proportion of variance in concentration explained by the mQTL SNP, quantified by ) to the sample size for each study (power calculations used the GeneticsDesign R package). Our study had power to detect associations with approximately , while [14] had power to discover much smaller effects (approximately ). Better powered studies such as [14] have the potential to offer further interesting insights into the mQTL basis of the 1H NMR metabolome.

Proximity of mQTLs to known GWAS SNPs (1H NMR)
We searched within 200 kb of each metabolite's hit region for SNPs previously associated with phenotypes in GWASs [28]. SNP rs13538 is in strong LD with the N-ACu hit region at chromosome 2p13.1 ( between rs13538 and rs9309473 in the HapMap 3 individuals of Northern European ancestry, i.e. HapMap-CEU [29]). Variation at rs13538 has been shown to correlate with serum creatinine concentration and other measures of renal impairment, as well as with susceptibility to chronic kidney disease [22]–[23].
Coincidence of mQTLs with positively selected regions (1H NMR and Biocrates)
Upon surveying the literature related to genes in the region of the N-ACu mQTL, we realized that several papers had highlighted this particular region as carrying one of the strongest signatures of selection that has been discovered in the human genome (see, e.g., [8], [30]). This led us to check all known mQTLs for coincidence with positively selected regions (as identified by the genome-wide scan for such regions in [8]; see also [31] for a review of the detection and relevance of the genetic signature of natural selection).
We compared the locations of all mQTLs discussed in the current paper to the positively selected loci identified in [8]. Two of our three replicated mQTL hits were within such regions (the mQTL for N-ACu, and the mQTL that affects both TMAu and DMAp). We also examined the genomic locations of each of Illig et al.'s 13 replicated mQTLs (see dedicated section below on replication), and found none to be within positively selected regions as identified in [8].
Analysis of TMAu and DMAp mQTL (1H NMR)
SNPs significantly associated with TMAu and DMAp fall within a haplotype block of approximately 40 kb at chromosome 10q24.2, which contains the PYROXD2 gene, a probable pyridine nucleotide-disulphide oxidoreductase gene, previously named C10orf33 (see Figure 2 and Figure S2). The most strongly associated SNP, rs7072216, has alleles C/T at frequency 0.25/0.75 in Europe (HapMap-CEU [29]). Our data indicate that TMAu concentration and DMAp concentration both increase with the number of copies of the major (T) allele. TMAu displays non-additivity, with the T allele recessive, and the TT homozygote class showing a greater-than-additive increase (on logarithmic scale) on the levels of the other two genotypic classes (Figure 3). There is a non-synonymous SNP—rs2147896—in strong LD with rs7072216 (; see also Table S2A). Functional predictions (SIFT [32] and PolyPhen [33]) and the PhyloP conservation score [34]–[35] for rs2147896 did not point to a clear functional impact, or to it being significantly conserved (Table S2B). SNP rs2147896 does not lie in a known protein domain, and web-based protein structure-modelling tools [36]–[37] did not predict that the rs2147896 polymorphism would have an effect on PYROXD2's ligand binding site. However, PYROXD2 (C10orf33) eQTLs have been discovered in fibroblasts (rs2147897 [2]) and liver (rs2147901 [38]), with these eQTLs in high LD (up to and respectively) with mQTL SNPs of TMAu and DMAp (Table S3). This raised the possibility that eQTL-driven population variation in mRNA transcription at PYROXD2 mediates the mQTL of TMAu and DMAp.
In order to investigate this eQTL hypothesis further, we extracted estimates of PYROXD2 mRNA abundance from two separate gene-expression microarray data sets measured on abdominal subcutaneous adipose tissue and whole-blood samples from the MolTWIN cohort (Materials and Methods). We found that PYROXD2 was expressed in whole blood, but found no evidence of rs7072216 being an eQTL of PYROXD2 in whole blood (), a finding consistent with [2], in which PYROXD2 eQTLs were neither discovered in T cells nor in lymphoblastoid cell lines. However, we did find rs7072216 to be an eQTL of PYROXD2 in subcutaneous abdominal adipose tissue (), with gene expression decreasing in the number of copies of the T allele. We plotted the mutual dependence between rs7072216 genotype, PYROXD2 gene expression in adipose tissue, and TMAu concentration (Figure 6). TMAu concentration was strongly negatively correlated with PYROXD2 expression (Pearson's , ).

We examined these particular gene expression data (i.e. measured in fat and blood cells) because they had been acquired already on MolTWIN cohort members. In performing this analysis, we were not suggesting that variation in gene expression in fat has a direct impact on the concentration of TMAu or DMAp. However, a substantive proportion of eQTLs modulate expression in a similar way in different tissues [39]. Thus, in identifying and characterizing the mutual dependence of TMAu concentration, rs7072216 genotype, and PYROXD2 expression in a mechanistically unrelated tissue (i.e. fat), we have raised the possibility that a qualitatively similar relationship with PYROXD2 expression will be observed in the tissue that truly mediates the mQTL effect (likely to be liver or kidney).
Analysis of BAIBu mQTL (1H NMR)
The SNPs that are significantly associated with BAIBu map to chromosome 5p13.2 within AGXT2 (alanine-glyoxylate aminotransferase 2). AGXT2 is known to be expressed in human liver and kidney. An eQTL for AGXT2 was reported in liver ([38] and Table S3), but this eQTL is not in LD with the mQTL SNPs (), and so does not explain the BAIBu mQTL.
Two of the most significant mQTL SNPs for BAIBu were rs37369 (T/C at 0.09/0.91) and rs37370 (C/T at 0.08/0.92), with (HapMap-CEU [29]) between the two SNPs (Table S2A). At SNP rs37370, one of the MZ twin pairs in the study was homozygous for the minor C allele; these subjects had higher BAIBu concentration than those in the other genotypic classes. Each of rs37369 and rs37370 is a non-synonymous, missense coding mutation in AGXT2, leading to an amino acid substitution in AGXT2. At rs37369, the base change C619T leads to the valine-to-isoleucine substitution V140I. At rs37370, T506C leads to the asparagine-to-serine substitution N102S. At each SNP, the concentration of BAIBu increased in the number of copies of the minor allele. Both SNPs lie in the pyridoxal phosphate-dependent transferase major domain (IPR015424) with rs37369 in subdomain 1, and rs37370 in subdomain 2. We extracted functional predictions (SIFT [32] and PolyPhen [33]) and PhyloP conservation scores [34]–[35] for rs37369 and rs37370, but discovered no substantive evidence in favour of functional impact or of either SNP being significantly conserved (Table S2B). We used the web servers Phyre2 [36] and 3DLigandSite [37] to predict AGXT2 protein structure and to investigate whether rs37369 and rs37370 were likely to affect AGXT2's predicted ligand binding site, but neither SNP was identified in these analyses as having an impact on the binding site.
Replication of Illig et al. (Biocrates)
We analysed the 15 mQTL associations reported in Illig et al. [14] using SNP genotypes and Biocrates-platform data from the MolOBB and MolTWIN cohorts (having removed individuals overlapping with the TwinsUK cohort used in [14]). We replicated 12 of the 15 mQTLs (Table 5), with four additional mQTLs replicated beyond the nine replicated by Illig et al. themselves (so that now a total of 13 of the 15 mQTLs identified in [14] have been replicated). The same significance level was used as in the replication section of [14], specifically a level of 0.05 adjusted by the Bonferroni method to account for 15 tests being performed (i.e. an adjusted significance level of 0.0033).
![Summary of the current study's replication of Illig et al.'s <em class="ref">[14]</em> mQTL associations (Biocrates platform).](https://pl-master.mdcdn.cz/media/cache/media_object_image_large/media/image/f785e55467dfb11dfb1706132b29469d.png)
Discussion
The current paper has extended recent studies [14], [19] in investigating the genetic basis of human metabolism. We analysed plasma and urine samples using 1H NMR, whilst Illig et al. [14] analysed serum samples using the Biocrates platform (targeted metabolomics using FIA-MS) [18]. While our examination of urine metabolites did not overlap with previous work, there was some minimal overlap between the metabolites targeted in blood (plasma or serum) by Biocrates and 1H NMR [40]. The Biocrates platform focuses specifically on a pre-selected set of amino acids and lipids [14], [18]. In contrast, 1H NMR spectroscopy is untargeted, quantifying the most abundant 50–100 metabolites in a biofluid, typically those above 10 micromolar in concentration [15]. We were able to annotate 38 metabolites in our plasma 1H NMR data, of which five were also targeted by the Biocrates platform (glutamine, glycine, leucine, tyrosine and valine). So, the sets of metabolites considered by the two studies are minimally overlapping and therefore complementary.
The MolTWIN plasma and urine samples were collected longitudinally from twins, and analysed with technical replication using 1H NMR and the Biocrates platform. This study design permitted a detailed decomposition of population variance in metabolite concentration (Figure 4 and Table 4). We estimated the proportion of biological variation in metabolite concentration explained by the corresponding mQTL SNP (biological variation included all phenotypic variation apart from that which was experimentally derived). For the newly discovered 1H NMR mQTLs, this proportion varied between 40%–64%. For the 13 currently replicated mQTLs discovered by Illig et al. [14], the proportion varied between 2%–35%. This discrepancy is explained by the different study designs, and mainly by the different sample sizes (Figure 5).
The current study's twin design allowed us to quantify the proportion of biological variance in metabolite concentration that was attributable to familial factors (i.e. genetic and common-environmental effects). For Illig et al.'s replicated mQTLs, the ‘non-SNP’ familial variation (i.e. familial variation not explained by the mQTL) was considerable, explaining on average 44% (range 9%–70%) of biological variation in the corresponding metabolic trait (Figure 4 and Table 4). On average, Illig et al.'s mQTL SNPs explained 25% (range 5%–82%) of the total familial variation in the corresponding metabolic traits. So, other genetic and common-environmental factors had substantial influence in addition to (and perhaps interacting with) the effects of the mQTLs themselves.
In a separate study [41], we have characterized population variation in all common 1H NMR-detectable urine and plasma metabolites, using the MolTWIN 1H NMR data of the current study, though without incorporation of the genotype data. We decomposed biological population variation into components, including that explained by familial sources and that explained by longitudinally stable sources. On average (across 1H NMR peaks), familial sources explained 42% (IQR 32-52) of variation in plasma metabolite concentrations and 30% (IQR 17-39) of variation in urine ones. Longitudinally stable sources explained 60% (IQR 51-72) of variation in plasma metabolite concentrations and 47% (IQR 35-60) of variation in urine ones. The substantive widespread presence of familial and stable variation across the urine and plasma 1H NMR metabolomes has implications for the design and interpretation of metabolite biomarker-discovery studies [41].
Interestingly, two of the 1H NMR mQTLs (discussed in detail below) have experienced recent positive selection in European populations [8]. The fact that these mQTL SNPs experienced selection suggests that molecular and phenotypic perturbations downstream of them may be biomedically interesting [31]. Also, the identification of functional consequences of variation at these loci strengthens the existing genetic evidence for selection having acted at these loci [31]. The observed genetic signature of positive selection suggests that an allele at the locus conferred a net advantage, relative to other alleles, under some environmental pressures, yet did not confer a net advantage under other environmental pressures. Humans may still be exposed to relevant environmental heterogeneity, and so the biomedical implications of these loci may become most clear once gene-environment interactions are incorporated into disease-susceptibility models. It will be initially of interest to investigate how physiological metabolite concentrations vary between world-wide populations as a result of different mQTL allele frequencies and environmental backgrounds. Metabolic profiles have the potential to reflect the synergy of genetic and environmental influences, and can thus provide unique insights into disease susceptibility at a population level [42]–[43].
During the revision stage of the current paper, an article by Suhre et al. [44] appeared, describing a GWAS of urine metabolite concentrations targeted by the 1H NMR-based Chenomx platform. Only one of the three mQTLs identified in the current paper—that of BAIBu—was identified in [44] (see further discussion of the BAIBu mQTL in the dedicated section below). A comparison of the current study with [44] illustrates nicely some of the differences between targeted and untargeted assays. In the current study we searched for strong genetic drivers of the comprehensive set of common urine and plasma metabolites detectable by 1H NMR. In contrast, Suhre et al. investigated genetic drivers of a targeted subset of the urine 1H NMR metabolome with a substantially greater sample size than that of the current study, and thus had statistical power to detect relatively weak genetic effects. The untargeted nature of the current study allowed the detection of two strong mQTL drivers of urine metabolite concentrations—TMAu and N-ACu—that were not targeted by the Chenomx platform used in [44]. A disadvantage of our untargeted approach in this context was that peaks had to be annotated with their corresponding metabolite. In the current study we were unable to attribute N-ACu to a single metabolite, and so the N-ACu mQTL was reported as driving concentrations of one or more N-acetylated compounds (X.NH.CO.CH3, with X unknown). Also, the unambiguous annotation of BAIBu was assisted by input from Suhre et al. [44], previous to which we had annotated the peak non-uniquely as CH3.CH.Y, with Y unknown but containing CH or CH2 and an electronegative substituent.
Discussion of TMAu and DMAp mQTL (1H NMR)
Genetic variation at PYROXD2 has experienced recent positive selection in European populations [8], with the T allele of rs7072216 at frequency 0.75 in Europe (HapMap-CEU), and at 0.14 in Africa (HapMap 3 individuals from Yoruba in Ibadan, Nigeria, Africa, i.e. HapMap-YRI [29]). The haplotype that was relatively advantageous in European populations is associated with decreased expression of PYROXD2 and increased concentration of TMAu and DMAp. Further work will be necessary to clarify the mechanisms linking: DMAp and TMAu levels; PYROXD2 gene expression; and genetic variation in LD with rs7072216 (such as the non-synonymous SNP, rs2147896). The signature of selection at PYROXD2 is indirectly suggestive of biomedical relevance; we also note that the set of genes showing evidence for positive selection is enriched for genes involved in oxidoreductase activity [8].
There have been a number of studies that have examined the sources of variation in physiological concentrations of methylamines and their derivatives, e.g. [45]–[46]. The current paper sheds light on this field from a new genetic angle, and it will be useful to integrate the mQTL effects into known pathways. Gut microbiota play an important role in the formation of methylamines from dietary sources in mammals—they create TMA from choline, and convert TMA into DMA [45]–[46]. Trimethylamine N-oxide (TMAO) is formed endogenously in the liver via the N-oxygenation of TMA by the flavin-containing monooxygenase (FMO) protein family, and particularly by FMO3 [47]. Gut microbial activity has been linked to disease through physiological levels of DMA, TMA and TMAO [48]–[49].
It may prove productive to relate the TMAu mQTL finding to the rare recessive genetic disorder trimethylaminuria, in which mutations at FMO3 disrupt conversion of TMA to TMAO, resulting in high physiological levels of TMA and an accompanying fish-odour phenotype [47]. Trimethylaminuria cases exhibit relatively low values of the ratio TMAOu/(TMAOu + TMAu), where TMAOu denotes urine TMAO concentration. Subjects in the current study have values of this ratio that are within the range typical of trimethylaminuria controls (Figure S6 and [50]). It will be interesting to investigate the effect, if any, of genetic variation at the TMAu mQTL on TMA levels among trimethylaminuria cases.
Discussion of N-ACu mQTL (1H NMR)
The N-ACu mQTL lies within a large 500 kb haplotype block (Figure 1), and there are a number of genes (and eQTLs, Table S3) in LD with it. Of these genes, NAT8 is a likely candidate for mediating the association between SNP variation and N-ACu (urine concentration of N-acetylated compound(s)), since NAT8's encoded enzyme specifically catalyzes N-acetylation—NAT8's enzyme is cysteinyl-conjugate N-acetyltransferase, CCNAT [51]. We relate our N-ACu mQTL finding to other research that has shown: (i) that the region harbours SNPs associated with renal function [22]–[23], [52]; and (ii) that the region has been the site of positive selection on standing genetic variation [8], [30].
Two recent renal-function GWASs identified rs13538 as a clinically associated SNP [22]–[23], [52] with the minor G allele increasing susceptibility to renal dysfunction. Chambers et al. [22] proposed that a non-synonymous mutation in NAT8 (the A595G change at rs13538, producing a non-conservative amino acid change F143S in CCNAT) reduces acetylation efficiency, thus leading to toxin-induced kidney injury. The N-ACu mQTL SNP rs9309473 is in strong LD () with GWAS SNP rs13538 (both SNPs with alleles A/G at frequency 0.79/0.21 in HapMap-CEU [29]). We found the non-synonymous mutant allele (G) at rs13538 to be associated with increased levels of N-ACu. Thus, whilst our findings provide evidence of differential acetylation efficiency driven by genetic variation in LD with rs13538, their directionality is not consistent with the specific mode of action proposed in [22]. Furthermore, a recent functional study [51] found enzymatic activity of mutant (F143S) CCNAT to be comparable to that of the wild-type protein (and so is also inconsistent with the mode of action proposed in [22]).
Scheinfeldt et al. [30] studied the signature of selection in this region, specifically examining two complementary sets of haplotypes: the “ancestral” and “derived” haplogroups (HapA/HapD respectively, at frequency 0.26/0.74 in the HapMap-CEU European population, but at 0.89/0.11 in the HapMap-YRI African population [29]). It has been proposed that positive selection drove up the frequency of HapD (relative to HapA) in Eurasian populations about 15,000 years ago [30]. The N-ACu mQTL SNP rs9309473 is in strong LD with HapA/HapD status ( in HapMap-CEU, with alleles G/A of rs9309473 highly predictive of HapA/HapD status respectively). An increasing number of copies of HapA is associated with increased urine concentration of N-acetylated compound(s) (N-ACu), and with increased susceptibility to renal dysfunction [22]–[23].
Discussion of BAIBu mQTL (1H NMR)
The BAIBu mQTL was also identified by Suhre et al. [44], where they noted the following. Elevated levels of BAIBu had been shown through family studies to be autosomal recessive [53], but the causal locus had been previously unknown. The association of a SNP in AGXT2 with BAIBu levels is consistent with the role of AGXT2's encoded enzyme, mitochondrial aminotransferase, which is expressed primarily in the kidney and catalyzes the reaction of BAIB with pyruvate to form 2-methyl-3-oxopropanoate and alanine (EC 2.6.1.40). It had also been previously suggested that altered BAIB homeostasis might contribute to hyper-β-amino-isobutyric aciduria, a relatively common Mendelian metabolic disorder in humans [54]. Suhre et al. [44] proposed rs37369 as a likely candidate for the causative SNP driving both variation in BAIBu concentration and susceptibility to hyper-β-amino-isobutyric aciduria.
We found the non-synonymous SNP rs37369 () to be marginally more significantly associated with BAIBu concentration than the other non-synonymous SNP, rs37370 (). This mildly supports rs37369 as the causal SNP driving BAIBu levels, relative to rs37370, though the true causal genetic polymorphism may be neither of these SNPs, but instead variation in strong LD with them. We used existing tools to predict the effect of rs37369 and rs37370 polymorphism on AGXT2 function (see Results), but this analysis did not reveal any clear functional consequences of these non-synonymous polymorphisms. Further work will be necessary to characterize with certainty the causal link between genetic variation at the AGXT2 locus and BAIBu concentration.
Conclusion
In conclusion, we have designed and conducted an mQTL study of plasma and urine metabolites detectable by 1H NMR. We discovered and replicated four novel metabolite-SNP associations, with each SNP explaining 40% or more of biological variation in metabolite concentrations. The mQTLs that we discovered have interesting properties: two of the three mQTL regions have experienced recent positive selection in European populations; one mQTL is in strong LD with a SNP identified in a kidney-function GWAS. Our findings pave the way forward for investigating the potential biomedical relevance of these regions.
Materials and Methods
Ethics statement
The MolTWIN study was approved by St. Thomas' Hospital Research Ethics Committee (EC04/015 Twins UK). The MolOBB study received ethical approval from Oxfordshire REC C (08/H0606/107).
Participant recruitment—MolTWIN
The 142 participants in the current study were recruited from the UK Adult Twin registry at St. Thomas' Hospital (www.twinsUK.ac.uk): a longitudinal epidemiological study of 11,000 twins (mostly female), for which extensive clinical, anthropometric, lifestyle, and demographic information, and a wide range of biological measurements have been collected [55]. Eligible volunteers were healthy, Caucasian, post-menopausal females of Northern European descent, between 45–76 years of age. Eligible twins were sent an information sheet containing details of the study, and two consent forms. After each twin had returned a completed consent form, she was contacted by letter and phone to book her appointment. The composition of the cohort was: 51 MZ pairs, 19 DZ pairs, and two unrelated individuals.
In the MolTWIN cohort, 33 of the MZ twin pairs donated samples twice; the median inter-visit time across all such pairs was 118 days (IQR: 96-134). Both twins in a pair always visited on the same day, and each visit was scheduled at either 10 : 00 or 14 : 00 (with repeated visits of each individual not necessarily scheduled at the same time of day).
Participant recruitment—MolOBB
The 69 participants in the current study were selected from the Oxford Biobank [20] (OBB). Specific OBB cohort members were selected on the basis of case/control status for metabolic syndrome according to International Diabetes Foundation Criteria [56]. The set of subjects comprised 42 controls (17 female, 25 male), and 27 cases (12 female, 15 male).
Sample collection
Fasting blood and urine samples were collected at all clinic visits of each participant. Spot urine samples were centrifuged (16060 × g) at 4°C for 10 min before being stored at −80°C. Fresh blood was collected in a 9 mL tube through venepuncture. Samples for 1H NMR analysis were collected in heparin tubes, whilst samples for Biocrates-platform analysis were collected in EDTA tubes. Blood samples were kept on ice for 20 min prior to centrifugation (16060 × g) at 4°C for 10 min, and subsequent storage at −80°C.
Genotyping, quality control, and imputation (MolTWIN and MolOBB)
DNA was extracted from whole-blood samples using GeneCatcher (Invitrogen Life Technologies, Carlsbad, USA) according to manufacturer's protocol. Genome-wide SNP genotypes were measured on a total of 166 individuals: 70 from the MolOBB cohort, and 96 from the MolTWIN cohort (one MZ twin from each MZ pair was genotyped, whilst both members of each DZ twin pair were genotyped). The genotyping assay used was the Illumina 317K BeadChip SNP array (Illumina, San Diego, USA).
Quality control on the genotyped subjects was performed in a way similar to those described previously by the Wellcome Trust Case Control Consortium [57]. Two MolTWIN samples were removed due to sample genotyping success rate < 95% and three samples (two from MolTWIN, one from MolOBB) were removed due to non-European ancestry (note that the cohort compositions given in the Participant Recruitment sections are after quality control). SNPs were removed (i) if MAF < 1%, or (ii) if genotyping success rate <95% and MAF > 5%, or (iii) if genotyping success rate <99% and MAF < 5%. Hardy-Weinberg equilibrium (HWE) was calculated by combining all unrelateds of the MolOBB and MolTWIN data sets (i.e. one twin per twin pair) and the hypothesis of HWE was tested at a significance level of 10−4; SNPs at which HWE was rejected were omitted from the study. After quality control, the genotypes of ungenotyped MZ twins were copied from their corresponding genotyped twin. The final data set prior to imputation comprised 69 MolOBB members and 142 MolTWIN members genotyped at 296,017 autosomal SNPs.
Measured genotypes were used to impute an additional 2,245,627 SNPs using the HapMap-CEU population (release 22) as reference [29]. The imputations were performed using IMPUTE [58]. We included SNPs in our analysis only if the imputation quality score was greater than 0.4. As output for a single SNP in an individual, IMPUTE provided probabilities of the individual having each of three possible genotypes (zero, one, or two copies of the reference allele). Prior to incorporating imputed genotypes into the statistical models, we preprocessed them, estimating the true genotype by that which was allocated highest probability by IMPUTE. Including both typed and imputed SNPs, we used a total of 2,541,644 autosomal SNPs for association analysis.
Sample preparation, data acquisition, and preprocessing (MolTWIN gene-expression data)
Total RNA was extracted from adipose tissue biopsies with TRIreagent (SIGMA-ALDRICH, Gillingham, UK) and quantified using a NanoDrop. For whole-blood samples, PAXgene tubes were used, and RNA was extracted according to the manufacturer's protocol (PAXgene, QIAGEN). RNA was labelled using the MessageAmp II 96-well amplification kit (Applied Biosystems, CA, USA). Labelled RNA was hybridized onto Affymetrix HGU133 Plus2 arrays, washed, stained, and scanned for fluorescence intensity according to manufacturers protocols (Affymetrix, Inc., USA).
Data were preprocessed using the RMA method without background correction (i.e. quantile normalization followed by robust probe-set summarization) [59]. Whole-blood array data were preprocessed separately from adipose-tissue array data. Publicly available custom chip-definition files (CDFs) were downloaded (version 11) (http://brainarray.mbni.med.umich.edu/Brainarray/Database/CustomCDF/CDF_download.asp) and used to group probes into sets, each set corresponding to an Ensembl-annotated gene, resulting in 18,394 such genes represented in the array data. See [60] for a description of how these CDFs were created, along with a comparison of their properties with the CDFs produced by Affymetrix.
Expression data were extracted at the PYROXD2 gene, and used in the current paper's analysis of the mQTL for TMAu and DMAp.
Sample preparation and data acquisition (Biocrates)
EDTA plasma samples were vortexed after thawing and centrifuged at 4°C for 5 min at 10,000 x g prior to loading of 10 µL of supernatants onto the 96-well kit plate. Processing of the AbsoluteIDQ kit followed the protocol specified by the manufacturer, including the following automated steps on the Hamilton ML Star robotics platform (Hamilton Bonaduz AG, Bonaduz, Switzerland): (i) drying plasma samples under a nitrogen stream, (ii) derivatization of amino acids with 5% phenylisothiocyanate reagent (20 µL), (iii) drying of samples, (iv) extraction of metabolites and kit internal standards with mM ammonium acetate in methanol (300 µL), (v) centrifugation through filter plate (2 min, 500 x g), vi) dilution with 600 µL MS running solvent. 20 µL of the final extracts were applied to flow injection analysis mass spectrometry.
Samples were analyzed using an API 4000 triple quadrupole mass spectrometer (ABSciex) equipped with an Agilent 1200 Series HPLC and a HTC PAL auto sampler from CTC controlled by the software Analyst 1.5. The standard flow injection method comprising two 20 µL injections (one for positive and one for negative electrospray ionisation mode) was applied for all measurements. Quantification was achieved by multiple reaction monitoring detection in combination with the use of stable isotope-labelled and other internal standards [61]. Data evaluation for quantification of metabolite concentrations was performed with the MetIQ software package (integral part of the AbsoluteIDQ kit). Concentrations of all metabolites are initially calculated in µM. The method has been proven to conform to FDA-Guidelines [62], which imply proof of reproducibility within a given error range. Analytical specifications for detection limit (LOD) and evaluated quantification ranges, further LOD for semi-quantitative measurements, identities of quantitative and semi-quantitative metabolites, specificity, potential interferences, linearity, precision and accuracy, reproducibility and stability were described in Biocrates manual AS-P150. The LODs were set to three times the values of zero samples. The lower and upper limits of quantification were determined experimentally by Biocrates AG (Innsbruck, Austria). In addition, the technical variability of the Biocrates platform had been quantified previously by Illig et al. [14]. Their Supplementary Table 4 displayed the coefficient of variation, CV, for each of 163 metabolite concentrations assayed in [14], and measured under the same conditions on the same platform in the current study. The median CV across metabolites was 7.4% (IQR: 6.1%-12.4%) [14], which demonstrated a useful degree of precision for the majority of metabolites.
We performed quality-control checks, including boxplots and principal-component score plots, on the Biocrates-platform data to identify failed assays, where an assay refers to the measurement of 163 metabolite concentrations in a biological sample. Of a total of 356 assays across the MolOBB and MolTWIN cohorts, we identified two assays that exhibited anomalously low concentrations of all metabolites (relative to the levels observed in the other assays); we omitted those two assays from further analysis.
Sample preparation and data acquisition (1H NMR)
Thawed samples were centrifuged at 16060 × g for 10 min. Samples were aliquotted into two technical replicates prior to sample preparation. Plasma was diluted 1 in 4 in physiological saline prepared in 20% D2O supplemented with 0.1% (w/v) sodium azide as a bacteriostatic agent and 1.5 mM sodium formate as a chemical-shift reference (δ8.452). Urine was diluted 2 in 1 in phosphate buffer (20% D2O, pH 7.4) supplemented with 1 mM trimethylsilyl-2,2,3,3-tetradeuteropropionic acid (TSP; δ0.00) and 0.1% (w/v) sodium azide. Sample aliquots were allocated to 96-well plates (and wells thereon) in a randomized design.
Each experiment was acquired on a Bruker DRX 600 MHz spectrometer (Rheinstetten, Germany) operating at 600 MHz (for 1H) using a 5 mm TXI flow-injection probe equipped with a z-gradient coil, at 300 K, at a spectral width of 12019 Hz, with 96 transients being collected with 8 dummy scans using 64k time domain data points. For both plasma and urine samples a standard 1D spectrum [RD−90°−3 µs−90°−tm−90°−acquire] with selective irradiation of the water resonance during the relaxation delay (RD, 2 s) and during the mixing time (tm, 0.1 s) was acquired. Additionally, for the plasma samples, a spin-echo (Carr-Purcell-Meiboom-Gill) spectrum [RD−90°−(τ/2−180°−τ/2)n−acquire] with a total echo time of 608 ms (n = 304, τ = 2000 µs) and a diffusion-edited spectrum made using a bipolar pulse-pair longitudinal eddy current delay pulse sequence with spoil gradients immediately following the 90° pulses after the bipolar gradient pulse pairs were acquired. Continuous wave irradiation was applied during the relaxation delay at the frequency of the water (or HOD) resonance. Eddy current recovery time (Te) was 5 ms, and the time interval between the bipolar gradients (|) was 0.5 ms. Further details may be found in [15], [26], [63].
Data preprocessing and feature extraction (1H NMR)
Each of four data sets was passed independently through a semi-automated preprocessing pipeline: phasing, alignment, denoising, baseline correction, manual bin selection, normalization, quality control, peak extraction, and logarithmic transformation.
Spectra were phased using in-house software (NMRProc, T.M.D Ebbels and H.C. Keun, Imperial College London). All other data analysis was performed in R [64]. Spectra were zero-filled to 216 points. Urine spectra were aligned to TSP, set at δ0.00; plasma spectra were aligned to formate, set at δ8.452 (peak centres were defined by the position of the local maximum).
The spectra were denoised in the frequency domain using wavelet-based methodology (a method similar to that described in [65]). For baseline correction, we initially fitted a constant baseline to each spectrum; however, visual inspection revealed that, for a number of spectra, the fit was better on one side of the water peak than on the other; natural variations in ionic strength resulting in altered phase of the residual water resonance may contribute to such an effect. Hence, a two-piece piecewise-constant baseline was fitted to and subtracted from each spectrum; specifically, the baseline on each side of the water peak was estimated by the 5th percentile of the spectral points in the corresponding interval (a robust estimator of baseline location).
We plotted each peak; for those peaks that visually displayed consistent presence across spectra, we manually created a bin and used the bin to extract the peak's data across all spectra. The datum extracted from a bin in a spectrum was the intensity of the highest local maximum (i.e. we used peak height as a proxy for peak area), or was coded as a missing value if no local maximum was present. We chose peak height to be the estimator of concentration as, in addition to its simplicity, it had relatively good robustness properties in the context of spectral artefacts (e.g. when a peak's location varied across spectra, or when neighbouring peaks overlapped within spectra). If the width (at half height) of a peak varies substantially across spectra, then peak height may be less precise than area at quantifying concentration. Plots of peaks did not reveal substantial peak-width variation in our data sets.
Only common peaks—present in at least 80% of spectra in their corresponding data set—were included in downstream statistical analysis, and only a peak's non-missing data were included at the statistical modelling stage. A missing datum, corresponding to there being no local maximum in the peak's ppm interval, typically occurred for one of two reasons: (a) the corresponding metabolite's concentration was too low to create a local maximum, or (b) a relatively large neighbouring peak overlapped the peak of interest (i.e. the missing concentration is censored, but not necessarily low). The omission of type (a) missing values from the analysis potentially decreased statistical power to detect mQTLs driving metabolite concentration variation at levels near or below the level of detection. The omission of type (b) missing values from the analysis increased the robustness of inference (and conserved power) in the face of artefactual effects of overlapping peaks. To illustrate, in Figure S7 we plotted the seven spectra (out of 432) with missing values for DMAp, and the four spectra (out of 432) with missing values for N-ACu. (There were no missing values for TMAu and BAIBu.) At the DMAp peak, missing data were representative of relatively low concentrations, approximately within the lowest quartile of observed concentrations (so we may have lost a small amount of power through missing-data handling). For N-ACu's missing data, the relevant peak's size was obscured by signal from an overlapping peak (missing values did not necessarily correspond to near-zero concentration).
Prior to model fitting, we discarded any peaks that were annotated to exogenous metabolites (of ibuprofen or acetaminophen), to a spike-in compound (TSP in urine, formate in plasma), or to urea (the area of which is affected by water peak saturation irradiation through chemical transfer of saturated protons). Across the three plasma data sets, 104 peaks were annotated to glucose; we discarded all but one representative glucose peak in each plasma data set.
The spectra were normalized using probabilistic quotient normalization [66]. The normalization was performed using data from the retained peaks only; spectra were normalized to a reference spectrum comprising median peak heights; missing values were excluded from the calculation of medians. After quality control, urine spectra were available for 142 MolTWIN participants and 67 MolOBB participants; plasma spectra were available for 140 MolTWIN participants and 68 MolOBB participants. A logarithmic transformation was applied to make the peak height distributions more symmetric–the entire spectrum-wide set of peak heights were collectively shifted and scaled to lie between zero and 100 and then transformed .
Genome-wide association scan (MolTWIN 1H NMR data)
We tested each metabolite peak in turn for association with 2,541,644 autosomal SNPs. For this stage we averaged and transformed the peak data as follows: (i) we averaged each subject's metabolite peak data across all biological and technical replicates; (ii) for robustness, we mapped the quantiles of the resulting inter-subject distribution to the quantiles of a standard Gaussian distribution. We denote the resulting data vector by . We fitted the following additive genetic model by ordinary least-squares regression at each SNP:where indexed subject; was the number of copies of the reference allele possessed by individual ; and was the residual error term. At each SNP, we calculated the conventional t-statistic for the test of the null hypothesis . We then took the maximum absolute t-statistic observed across all SNPs tested, and this statistic, , was the test statistic used for testing the null hypothesis, : the metabolite's concentration was not associated with variation at any SNP in the genome-wide panel.
We characterized the (metabolite peak-specific) null distribution of by permutation. For each of 5,000 permutations, we randomly reassigned the measured metabolite levels of each MZ pair to a different MZ pair, and randomly reassigned the measured metabolite levels of each DZ pair to a different DZ pair, yielding for the th permutation. Such a permutation crucially preserved the existing covariance structure on induced by polygenic genetic relatedness (identity-by-descent sharing) and common-environmental effects between twins, while breaking down any existing associations between and identity-by-state variation at SNPs. For the th permutation, we calculated t-statistics as before, quantifying the additive genetic association between and the genotypes at each SNP. We then calculated the maximum absolute t-statistic across SNPs, yielding the th draw from the null distribution, .
For each metabolite, we rejected only if the observed test statistic exceeded all 5,000 draws from its null distribution, i.e. if . Such a procedure constrained (to be small) the family-wise error rate (FWER) for testing a single metabolite against genome-wide SNP variation. Specifically, (0, 0.0007) was an exact 95% confidence interval for the FWER, based on the observation that none of the 5,000 draws from the null distribution of exceeded the observed statistic [67]. We concluded that our testing procedure controlled the false-positive probability for each metabolite's entire genome-wide scan to be less than 0.001.
was rejected for six of the 526 metabolite peaks tested. These six peaks redundantly represented four metabolites, listed in Table 2. For each metabolite, we examined the subset of SNPs that reached genome-wide significance (defined as those SNPs whose t-statistics exceeded, in absolute value, the metabolite's maximum null test statistic, ; shown in Table S1). For each metabolite, the set of genome-wide significant SNPs co-localized to a single genomic region; we defined a metabolite's hit region to be the smallest contiguous region containing all genome-wide significant SNPs.
Mixed-effects analysis of hit regions (MolTWIN 1H NMR data)
Underlying the observed data at a metabolite peak (i.e. across all spectra) was a complex correlation structure, induced by the sharing of alleles, individuals, and samples by different sample aliquots. In the follow-up analysis of hit regions we explicitly modelled this covariance structure while quantifying the metabolite's association with each local SNP in turn (i.e. with each SNP within 200 kb of the hit region and with MAF > 5%).
To deal with potential deviations from the Gaussian distributional assumptions, we mapped the quantiles of the empirical data distribution at each peak to the quantiles of a standard Gaussian distribution, yielding the transformed data vector, . In contrast to the genome-wide analysis described in the previous section (based on the averaged data, ), technical and biological replicates were not averaged for this analysis (instead, variation between replicates was retained in and modelled). We fitted the following mixed-effects model: where twin pairs were indexed by , the twins within a pair were indexed by , the visits of a twin pair were indexed by , and the aliquots of a sample were indexed by . The ‘fixed effects’ in the model were , the , and . The additive effect of the SNP under consideration was modelled by , with denoting the number of copies of the reference allele possessed by twin in pair . The parameters controlled for experimental inter-plate effects, with mapping spectra to plates. The parameter controlled for sampling time-related effects, with in the equation above mapping visits to sample-collection times (in 24-hour format; times were mostly 10 or 14). The other terms in the model were ‘random effects,’ which modelled the covariance structure across observations induced by familial , individual-environmental , temporally dynamic , and non-biological effects. Similarly to [68], there was one term for each MZ pair and two such terms, and , for each DZ pair (i.e. if was an MZ pair, whilst if was a DZ pair). Each ‘random effect’ followed a zero-mean Gaussian distribution with its corresponding standard deviation from (e.g. the independently followed ).
The current paper's model induced a covariance structure on that was identical to that which is used in the standard methodology for modelling twin data (see, e.g., [68]–[70]). In the parameterization above, modelled the familial variance (i.e. the variance attributable to genetics and common environment), modelled the individual-environmental variance. Additionally, our model included variance parameters representing longitudinally unstable variation. These ( and ) were referred to as the ‘common-visit’ and ‘individual-visit’ effects respectively, because they measured the component of phenotypic variation that fluctuated between visits, and which was shared and non-shared respectively between twins; the common-visit parameterization was included in the model because twins visited the clinic in pairs. Finally, there was a parameter to model experimental variation. In the variance decompositions of the current paper (Figure 4 and Table 4), variances were expressed as proportions of the total biological variance, which was defined as , where was the phenotypic variance explained by the corresponding mQTL SNP. The biological variance did not include the experimental variance, , and was therefore appropriate for comparing the properties of molecular phenotypes across platforms when the level of experimental variation on the platforms was not of primary interest.
For each SNP within 200 kb of the hit region, we fitted the mixed-effects model both with and without the term. From these fitted models, we calculated the p-value for the test of the null hypothesis that , using as a test statistic (where denotes the likelihood ratio), and employing its asymptotic null distribution (a chi-squared density with one degree of freedom). These p-values are displayed in the text, Figure 1, Figure 2, Figures S2 and S3, and Table 3, Tables S1 and S2A.
At the most strongly associated SNP, we went on to fit the model in a Bayesian framework, quantifying the precision of parameter estimates using posterior credible intervals. For this analysis we used directly the log-transformed metabolite concentrations, denoted by (see section on Data preprocessing and feature extraction). For priors, we specified Uniform densities on the standard deviation parameters in (as discussed in [71]):where denotes the sample standard deviation of the data, . The prior on the ‘fixed effects’ vector, , was a diffuse multivariate Gaussian distribution, with mean at the least squares estimates, , and diagonal covariance matrix with entries . The results of fitting the model in a Bayesian framework are summarized in Table 4 and Figure 4.
Replication of mQTL hits (MolOBB 1H NMR data)
For each of the mQTLs discovered in the MolTWIN cohort, we re-tested the association using only data from the MolOBB cohort. Specifically, we mapped the quantiles of the metabolite's concentration data to the corresponding quantiles of a standard Gaussian distribution; we then tested for an additive association with the corresponding SNP's genotype data, including age and gender as covariates in the linear model. Resulting p-values are shown in Table 3.
Replication of Illig et al.'s mQTL hits (MolTWIN and MolOBB Biocrates data)
We used the concentration data directly as output from the Biocrates platform, and calculated metabolic traits from concentration ratios as in [14]. We removed individuals overlapping with the TwinsUK cohort used in [14], after which a total of 202 individuals were included in our Biocrates replication analysis (133 MolTWIN participants and 69 MolOBB participants). We fitted similar models to those specified in the Materials and Methods subsection ‘Mixed-effects analysis of hit regions,’ though now with fixed effects for genotype (number of copies of reference allele), plate, age, and gender. For each metabolic trait, the genotype data in the model was from the single corresponding mQTL SNP as reported in [14]. The results of the non-Bayesian analysis are shown in Table 5 and the results of the Bayesian analysis are in Table 4 and Figure 4.
Data availability
The data underlying the current paper's analyses are available for download from an FTP server (host: svilpaste.mii.lu.lv; login: Moltwin_NMR; password: Moltwin_NMR1; path: /home/George/PLoS_Genetics_mQTL_data).
Supporting Information
Zdroje
1. CheungVSpielmanR 2009 Genetics of human gene expression: mapping DNA variants that influence gene expression. Nature reviews. Genetics 10 595 604
2. DimasADeutschSStrangerBMontgomerySBorelC 2009 Common regulatory variation impacts gene expression in a cell type-dependent manner. Science 325 1246 1250
3. MontgomerySSammethMGutierrez-ArcelusMLachRIngleC 2010 Transcriptome genetics using second generation sequencing in a Caucasian population. Nature 464 773 777
4. PickrellJMarioniJPaiADegnerJEngelhardtB 2010 Understanding mechanisms underlying human gene expression variation with RNA sequencing. Nature 464 768 772
5. VeyrierasJ-BKudaravalliSKimSDermitzakisEGiladY 2008 High-resolution mapping of expression-QTLs yields insight into human gene regulation. PLoS Genet 4 e1000214 doi:10.1371/journal.pgen.1000214
6. NicaADermitzakisE 2008 Using gene expression to investigate the genetic basis of complex disorders. Hum Mol Genet 17 ddn285 134
7. CooksonWLiangLAbecasisGMoffattMLathropM 2009 Mapping complex disease traits with global gene expression. Nature reviews. Genetics 10 184 194
8. TangKThorntonKStonekingM 2007 A new approach for using genome scans to detect recent positive selection in the human genome. PLoS Biol 5 e171 doi:10.1371/journal.pbio.0050171
9. ChenYZhuJLumPYYangXPintoS 2008 Variations in DNA elucidate molecular networks that cause disease. Nature 452 429 435
10. SchadtE 2009 Molecular networks as sensors and drivers of common human diseases. Nature 461 218 223
11. GibbsRvan der BrugMHernandezDTraynorBNallsM 2010 Abundant quantitative trait loci exist for DNA methylation and gene expression in human brain. PLoS Genet 6 e1000952 doi:10.1371/journal.pgen.1000952
12. KloseJNockCHerrmannMStühlerKMarcusK 2002 Genetic analysis of the mouse brain proteome. Nat Genet 30 385 393
13. DumasM-EWilderSBihoreauM-TBartonRFearnsideJ 2007 Direct quantitative trait locus mapping of mammalian metabolic phenotypes in diabetic and normoglycemic rat models. Nat Genet 39 666 672
14. IlligTGiegerCZhaiGRomisch-MarglWWang-SattlerR 2010 A genome-wide perspective of genetic variation in human metabolism. Nat Genet 42 137 141
15. NicholsonJKO'FlynnMPSadlerPJMacleodAFJuulSM 1984 Proton-nuclear-magnetic-resonance studies of serum, plasma and urine from fasting normal and diabetic subjects. Biochem J 217 365 375
16. BeckonertOKeunHEbbelsTBundyJHolmesE 2007 Metabolic profiling, metabolomic and metabonomic procedures for NMR spectroscopy of urine, plasma, serum and tissue extracts. Nature protocols 2 2692 2703
17. NicholsonJKLindonJCHolmesE 1999 ‘Metabonomics’: understanding the metabolic responses of living systems to pathophysiological stimuli via multivariate statistical analysis of biological NMR spectroscopic data. Xenobiotica 29 1181 1189
18. Römisch-MarglWPrehnCBogumilRRöhringCSuhreK 2011 Procedure for tissue sample preparation and metabolite extraction for high-throughput targeted metabolomics. Metabolomics 1 10
19. GiegerCGeistlingerLAltmaierEHrabé de AngelisMKronenbergF 2008 Genetics Meets Metabolomics: A Genome-Wide Association Study of Metabolite Profiles in Human Serum. PLoS Genet 4 e1000282 doi:10.1371/journal.pgen.1000282
20. TanGDNevilleMJLiveraniEHumphreysSMCurrieJM 2006 The in vivo effects of the Pro12Ala PPARgamma2 polymorphism on adipose tissue NEFA metabolism: the first use of the Oxford Biobank. Diabetologia 49 158 168
21. SlatkinM 2008 Linkage disequilibrium--understanding the evolutionary past and mapping the medical future. Nature reviews. Genetics 9 477 485
22. ChambersJZhangWLordGvan der HarstPLawlorD 2010 Genetic loci influencing kidney function and chronic kidney disease. Nat Genet 42 373 375
23. KöttgenAPattaroCBögerCFuchsbergerCOldenM 2010 New loci associated with kidney function and chronic kidney disease. Nat Genet 42 376 384
24. WishartDKnoxCGuoACEisnerRYoungN 2009 HMDB: a knowledgebase for the human metabolome. Nucleic Acids Res 37 D603 610
25. CloarecODumasM-ECraigABartonRTryggJ 2005 Statistical total correlation spectroscopy: an exploratory approach for latent biomarker identification from metabolic 1H NMR data sets. Anal Chem 77 1282 1289
26. NicholsonJKFoxallPJSpraulMFarrantRDLindonJC 1995 750 MHz 1H and 1H-13C NMR spectroscopy of human blood plasma. Anal Chem 67 793 811
27. GöringHHTerwilligerJDBlangeroJ 2001 Large upward bias in estimation of locus-specific effects from genomewide scans. Am J Hum Genet 69 1357 1369
28. HindorffLSethupathyPJunkinsHRamosEMehtaJ 2009 Potential etiologic and functional implications of genome-wide association loci for human diseases and traits. Proc Natl Acad Sci U S A 106 9362 9367
29. AltshulerDGibbsRPeltonenLDermitzakisESchaffnerS 2010 Integrating common and rare genetic variation in diverse human populations. Nature 467 52 58
30. ScheinfeldtLBiswasSMadeoyJConnellyCSchadtE 2009 Population genomic analysis of ALMS1 in humans reveals a surprisingly complex evolutionary history. Mol Biol Evol 26 1357 1367
31. SabetiPCSchaffnerSFFryBLohmuellerJVarillyP 2006 Positive natural selection in the human lineage. Science 312 New York, N.Y. 1614 1620
32. KumarPHenikoffSNgP 2009 Predicting the effects of coding non-synonymous variants on protein function using the SIFT algorithm. Nature protocols 4 1073 1081
33. RamenskyVBorkPSunyaevS 2002 Human non-synonymous SNPs: server and survey. Nucleic Acids Res 30 3894 3900
34. KuhnRMKarolchikDZweigASWangTSmithKE 2009 The UCSC Genome Browser Database: update 2009. Nucleic Acids Res 37 D755 761
35. PollardKHubiszMRosenbloomKSiepelA 2010 Detection of nonneutral substitution rates on mammalian phylogenies. Genome Res 20 110 121
36. KelleyLSternbergM 2009 Protein structure prediction on the Web: a case study using the Phyre server. Nature protocols 4 363 371
37. WassMKelleyLSternbergM 2010 3DLigandSite: predicting ligand-binding sites using similar structures. Nucleic Acids Res 38
38. SchadtEMolonyCChudinEHaoKYangX 2008 Mapping the genetic architecture of gene expression in human liver. PLoS Biol 6 e107 doi:10.1371/journal.pbio.0060107
39. NicaAPartsLGlassDNisbetJBarrettA 2011 The architecture of gene regulatory variation across multiple human tissues: the MuTHER study. PLoS Genet 7 e1002003 doi:10.1371/journal.pgen.1002003
40. SuhreKMeisingerCDöringAAltmaierEBelcrediP 2010 Metabolic footprint of diabetes: a multiplatform metabolomics study in an epidemiological setting. PLoS ONE 5 e13953 doi:10.1371/journal.pone.0013953
41. NicholsonGRantalainenMMaherADLiJVMalmodinD 2011 Human metabolic profiles are stably controlled by genetic and environmental variation. Mol Syst Biol In press
42. HolmesELooRLStamlerJBictashMYapI 2008 Human metabolic phenotype diversity and its association with diet and blood pressure. Nature 453 396 400
43. HolmesEWilsonINicholsonJ 2008 Metabolic phenotyping in health and disease. Cell 134 714 717
44. SuhreKWallaschofskiHRafflerJFriedrichNHaringR 2011 A genome-wide association study of metabolic traits in human urine. Nat Genet 43 565 569
45. SmithJLWishnokJSDeenWM 1994 Metabolism and excretion of methylamines in rats. Toxicol Appl Pharmacol 125 296 308
46. ZeiselSHWishnokJSBlusztajnJK 1983 Formation of methylamines from ingested choline and lecithin. J Pharmacol Exp Ther 225 320 324
47. CashmanJCampKFakharzadehSFennesseyPHinesR 2003 Biochemical and clinical aspects of the human flavin-containing monooxygenase form 3 (FMO3) related to trimethylaminuria. Current drug metabolism 4 151 170
48. DumasM-EBartonRToyeACloarecOBlancherC 2006 Metabolic profiling reveals a contribution of gut microbiota to fatty liver phenotype in insulin-resistant mice. Proc Natl Acad Sci U S A 103 12511 12516
49. WangZKlipfellEBennettBKoethRLevisonB 2011 Gut flora metabolism of phosphatidylcholine promotes cardiovascular disease. Nature 472 57 63
50. Al-WaizMAyeshRMitchellSCIdleJRSmithRL 1987 A genetic polymorphism of the N-oxidation of trimethylamine in humans. Clin Pharmacol Ther 42 588 594
51. Veiga-da-CunhaMTytecaDStroobantVCourtoyPOpperdoesF 2010 Molecular identification of NAT8 as the enzyme that acetylates cysteine S-conjugates to mercapturic acids. J Biol Chem 285 18888 18898
52. JuhansonPKeppKOrgEVeldreGKelgoP 2008 N-acetyltransferase 8, a positional candidate for blood pressure and renal regulation: resequencing, association and in silico study. BMC medical genetics 9 25
53. HarrisH 1953 Family studies on the urinary excretion of beta-aminoisobutyric acid. Annals of eugenics 18 43 49
54. van KuilenburgAMeinsmaRBekeEAssmannBRibesA 2004 beta-Ureidopropionase deficiency: an inborn error of pyrimidine degradation associated with neurological abnormalities. Hum Mol Genet 13 2793 2801
55. SpectorTWilliamsF 2006 The UK adult twin registry (TwinsUK). Twin Res 9 899 906
56. AlbertiKGZimmetPShawJ 2006 Metabolic syndrome - a new world-wide definition. A Consensus Statement from the International Diabetes Federation. Diabetic medicine : a journal of the British Diabetic Association 23 469 480
57. 2007 Genome-wide association study of 14,000 cases of seven common diseases and 3,000 shared controls. Nature 447 661 678
58. MarchiniJHowieBMyersSMcVeanGDonnellyP 2007 A new multipoint method for genome-wide association studies by imputation of genotypes. Nat Genet 39 906 913
59. IrizarryRBolstadBCollinFCopeLHobbsB 2003 Summaries of Affymetrix GeneChip probe level data. Nucleic Acids Res 31
60. DaiMWangPBoydAKostovGAtheyB 2005 Evolving gene/transcript definitions significantly alter the interpretation of GeneChip data. Nucl. Acids Res. 33 e175 e175
61. BogumilRKoalTWeinbergerKMDS 2008 Massenspektrometrische Analyse von Blutplasma im Kitformat Laborwelt 2 17 23
62. U.S. Department of Health and Human Services FaDA, Center for Drug Evaluation and Research (CDER), Center for Veterinary Medicine (CVM) 2001 Guidance for Industry. Bioanalytical Method Validation
63. NicholsonJKBuckinghamMJSadlerPJ 1983 High resolution 1H n.m.r. studies of vertebrate blood and plasma. Biochem J 211 605 615
64. R Development Core Team 2010 R: A Language and Environment for Statistical Computing
65. JohnstoneISilvermanB 2005 Empirical Bayes selection of wavelet thresholds. Annals of Statistics 33 1700 1752
66. DieterleFRossASchlotterbeckGSennH 2006 Probabilistic quotient normalization as robust method to account for dilution of complex biological mixtures. Application in 1H NMR metabonomics. Anal Chem 78 4281 4290
67. BrownLCaiTDasguptaA 2001 Interval estimation for a binomial proportion. Statistical Science 16 101 117
68. VisscherPBenyaminBWhiteI 2004 The use of linear mixed models to estimate variance components from data on twin pairs by maximum likelihood. Twin research: the official journal of the International Society for Twin Studies 7 670 674
69. NealeMCCardonLR 1992 Methodology for genetic studies of twins and families: Dordrecht: Kluwer Academic Publishers
70. RijsdijkFShamP 2002 Analytic approaches to twin data using structural equation models. Briefings in bioinformatics 3 119 133
71. GelmanA 2006 Prior distributions for variance parameters in hierarchical models. Bayesian Analysis 1 515 533
Štítky
Genetika Reprodukční medicínaČlánek vyšel v časopise
PLOS Genetics
2011 Číslo 9
Nejčtenější v tomto čísle
- Retrotransposon-Induced Heterochromatin Spreading in the Mouse Revealed by Insertional Polymorphisms
- The Evolutionarily Conserved Longevity Determinants HCF-1 and SIR-2.1/SIRT1 Collaborate to Regulate DAF-16/FOXO
- Genome-Wide Analysis of Heteroduplex DNA in Mismatch Repair–Deficient Yeast Cells Reveals Novel Properties of Meiotic Recombination Pathways
- Association of eGFR-Related Loci Identified by GWAS with Incident CKD and ESRD