
Retrotransposon-Induced Heterochromatin Spreading in the Mouse Revealed by Insertional Polymorphisms
The “arms race” relationship between transposable elements (TEs) and their host has promoted a series of epigenetic silencing mechanisms directed against TEs. Retrotransposons, a class of TEs, are often located in repressed regions and are thought to induce heterochromatin formation and spreading. However, direct evidence for TE–induced local heterochromatin in mammals is surprisingly scarce. To examine this phenomenon, we chose two mouse embryonic stem (ES) cell lines that possess insertionally polymorphic retrotransposons (IAP, ETn/MusD, and LINE elements) at specific loci in one cell line but not the other. Employing ChIP-seq data for these cell lines, we show that IAP elements robustly induce H3K9me3 and H4K20me3 marks in flanking genomic DNA. In contrast, such heterochromatin is not induced by LINE copies and only by a minority of polymorphic ETn/MusD copies. DNA methylation is independent of the presence of IAP copies, since it is present in flanking regions of both full and empty sites. Finally, such spreading into genes appears to be rare, since the transcriptional start sites of very few genes are less than one Kb from an IAP. However, the B3galtl gene is subject to transcriptional silencing via IAP-induced heterochromatin. Hence, although rare, IAP-induced local heterochromatin spreading into nearby genes may influence expression and, in turn, host fitness.
Published in the journal:
. PLoS Genet 7(9): e32767. doi:10.1371/journal.pgen.1002301
Category:
Research Article
doi:
https://doi.org/10.1371/journal.pgen.1002301
Summary
The “arms race” relationship between transposable elements (TEs) and their host has promoted a series of epigenetic silencing mechanisms directed against TEs. Retrotransposons, a class of TEs, are often located in repressed regions and are thought to induce heterochromatin formation and spreading. However, direct evidence for TE–induced local heterochromatin in mammals is surprisingly scarce. To examine this phenomenon, we chose two mouse embryonic stem (ES) cell lines that possess insertionally polymorphic retrotransposons (IAP, ETn/MusD, and LINE elements) at specific loci in one cell line but not the other. Employing ChIP-seq data for these cell lines, we show that IAP elements robustly induce H3K9me3 and H4K20me3 marks in flanking genomic DNA. In contrast, such heterochromatin is not induced by LINE copies and only by a minority of polymorphic ETn/MusD copies. DNA methylation is independent of the presence of IAP copies, since it is present in flanking regions of both full and empty sites. Finally, such spreading into genes appears to be rare, since the transcriptional start sites of very few genes are less than one Kb from an IAP. However, the B3galtl gene is subject to transcriptional silencing via IAP-induced heterochromatin. Hence, although rare, IAP-induced local heterochromatin spreading into nearby genes may influence expression and, in turn, host fitness.
Introduction
Transposable elements (TEs) are major constituents of eukaryotic genomes and are important catalysts of evolution [1], [2]. Indeed, TEs may cause negative, neutral or positive effects upon insertion, increase genomic instability by chromosomal rearrangements [3] and act as central collaborators in genome-wide regulatory network creation and renewal [4]. TEs are able to move throughout the genome either directly (DNA transposons) or by an RNA intermediate (Retrotransposons). Autonomous copies code for the necessary machinery for host invasion while non-autonomous copies will depend upon the former.
The well-known arms-race between TEs and the host genome [5] has resulted in several regulatory pathways, including a combination of various epigenetic mechanisms i.e. DNA methylation, small RNAs and histone post-translational modifications. In plants, invertebrate species and vertebrates, DNA methylation has been described as an important epigenetic silencing mechanism. In mouse, IAPs (Intracisternal A-type Particle elements), long terminal repeats (LTR) retrotransposons (also termed endogenous retroviruses (ERVs)), are highly DNA methylated and the disruption of enzymes responsible for such methylation (DNA methyltransferases Dnmt1 and Dnmt3L) causes global derepression of IAP copies [6], [7], albeit only in particular tissues. In Arabidopsis thaliana, TEs are strictly silenced by DNA methylation, which is often guided by small RNAs [8]. In Drosophila melanogaster, rasiRNAs and piRNAs (repeat-associated small interfering RNAs and piwi-interacting RNAs respectively) are responsible for the silencing of many TE copies [9], [10]. Small RNAs may trigger local heterochromatin [11] and histone post-translational modifications are also involved in TE silencing. Indeed, the repressive histone modifications H3K9me3 and H4K20me3 are associated with ERVs in mouse ES cells [12], [13]. Moreover, knock out of a histone methyltransferase (SETDB1) [14] or the protein that recruits it (KAP-1) [15] in mouse ES cells causes reduction of H3K9me3 at ERVs and induces high expression of several ERV classes as well as genes controlled by cryptic ERV promoters [16].
TEs are therefore often observed in regions associated with repressive histone marks and hence trapped into local heterochromatin. The analysis of euchromatin/heterochromatin boundaries has shown that an increase in TE density is co-localized with heterochromatin delimitation [17]. D. melanogaster mitotic chromosome analysis and the genome sequencing projects have also shown that TEs are abundant in heterochromatic regions [18], [19]. Such phenomena might be: 1. the consequence of insertional preferences of TEs into heterochromatin; 2. positive selection of TE maintenance into heterochromatin for genomic stability [20]; or 3. an induction of heterochromatin by TE sequences. The Sleeping beauty (SB) transposase has been shown to have an affinity for heterochromatin when transfected into mouse ES cells, however SB transposons do not seem to prefer heterochromatin over euchromatin [21]. In Drosophila, HeT-A, TAHRE and TART elements are found in telomeres but never in other heterochromatic regions, such as centromeres or interspersed heterochromatin, suggesting therefore an inclination for telomere specific sequences and not heterochromatin [22]. In general, no global heterochromatic insertional preference has been described for TEs with the exception of the yeast Ty5 retrotransposon that integrates into telomeres and the silent mating loci (the only two heterochromatic regions of the yeast genome) when the targeting domain of the Integrase is phosphorylated [23]. Some studies have found that only multiple tandem copies of a transgene (or even TEs) are able to induce heterochromatin but not a single copy [24]–[26]. Repetitive sequences are hypothesized and often claimed to induce heterochromatin and local region silencing [27], [28]. However, very few reports describe induction of heterochromatin at individual loci by a specific copy of a TE (see the sexual determination in melon by heterochromatin spreading from a DNA transposon for example [29]).
While genome-wide studies on histone post-translational modifications have revealed the repressive chromatin environment of several TE types in mouse ES cells [12], [16], no study has determined if TE insertion per se can induce the spreading of a repressive chromatin environment into flanking genomic regions. To determine if, indeed, TE families can induce local heterochromatin in a natural system, we surveyed two mouse strains where insertionally polymorphic TE copies have been documented [30], [31]. For the same genomic location, in the same cell type, we can distinguish a “full site” in one strain from an “empty site” in the other. Comparisons of the profiles of repressive epigenetic marks at both classes of sites allow us to determine the capacities of TEs to induce local heterochromatin. We report robust induction of H3K9me3-H4K20me3-chromatin spreading into nearby regions for the IAP family of LTR retrotransposons. Intriguingly, induction of such chromatin by other families of active LTR retrotransposons, including ETn/MusD (Early transposons), is much more variable. We found that transcription of one gene is impacted by the spread of IAP-induced heterochromatin in ES cells, but these effects on genes are likely rare, as such insertions are likely subject to strong negative selection.
Results/Discussion
Insertionally polymorphic TE families studied
We chose three different families of TEs for this study based on the data available on insertionally polymorphic copies, namely IAPs, ETn/MusD elements and LINEs (Long interspersed nuclear elements) [30], [31]. IAPs and ETn/MusDs are active families of mouse ERVs/LTR retrotransposons [30], together accounting for 10%–12% of spontaneous mutations in inbred mice [32]–[34]. ETn/MusD are a non-autonomous/autonomous pair of ERVs respectively [35], [36], where MusD appears to be more efficiently repressed by the host compared to their non-autonomous ETn cousins [37]. LINEs are non-LTR retrotransposons, abundant in the mouse genome with many active copies, although most are 5′ truncated due to their transposition mechanisms (dead-on-arrival copies) [38]. IAPs and ETn/MusD are highly associated with H4K20me3 and H3K9me3 in ES cells [12]–[14], [37] whereas LINEs are not associated with these marks [13]. No strong insertional biases have been described for these TE families apart from AT rich regions for LINEs [38], and analysis of the distribution of all three families, including common and polymorphic copies, reveals no obvious preference for heterochromatic regions or regions near genes (Figure S1).
IAPs robustly induce heterochromatin
The use of our previous genome-wide analysis of H3K9me3 distribution in two ES cell lines (TT2 and J1) originating from different mouse backgrounds (C57Bl/6 x CBA F1 hybrid, 129S4/SvJae respectively) [16] allowed us to determine if TEs indeed induce local heterochromatin. Note that heterochromatin is herein defined according to the presence of the repressive histone post-translational modification H3K9me3 and H4K20me3. No significant differences have been observed in the overall load of TEs between B6 and 129 strains (our unpublished results). Two sets of copies were chosen: copies present in both ES cell lines (common copies) or copies present only in TT2 and absent in J1 cells (insertionally polymorphic copies of ETn/MusDs and IAPs). The inverse analysis, i.e. studying copies present in J1 and absent from TT2 was not performed since TT2 is a hybrid of CBA with B6 and our insertionally polymorphic data set does not include the CBA strain [30].
Total average density of H3K9me3 was first calculated in regions flanking specific LINE, ETn/MusD and IAP copies present in both ES cell lines (common copies) (Figure 1A). It is important to note that the location of each copy was precisely known and the copies were present in the sequenced C57BL/6 reference genome [30], hence, all ChIP-seq reads matching the TE insertions themselves were excluded, allowing us to specifically examine the chromatin state of the flanking regions. Furthermore, since the ChIP-seq H3K9me3 data was generated using native-ChIP and the sequencing of DNA fragments were predominantly of mono-nucleosome size [16] (Figure S2), we could specifically observe the chromatin status of flanking regions with minimal background from H3K9me3 enriched TE copies. H3K9me3 is absent from the flanks of LINE elements (Figure 1A), consistent with previous analyses showing that these elements are themselves generally not marked by H3K9me3 [12], [13] (Figure S3A). However, ETn/MusDs and IAPs are associated with H3K9me3 enriched flanking regions in both ES cell lines, with the latter being particularly enriched (Figure 1A). Next we analyzed genomic loci harboring ERVs in TT2 cells but not in J1 cells (insertion site polymorphic copies) and observed that the average density of H3K9me3 is higher when an ETn/MusD or IAP is present, with IAPs again being most striking (Figure 1B). This analysis suggests that insertion of these ERVs causes deposition and spreading of this histone mark into flanking genomic DNA.

To determine if such tendency was a general phenomenon and not the result of only a few very enriched regions in TT2 cells (full site), we calculated the RPKM asymmetry (reads per kilobase per million mapped reads – see Materials and Methods) between flanking regions (1 Kb) of both strains, allowing us to distinguish regions differently enriched, i.e. regions where the RPKM asymmetries is near – 1 or +1 (see Figure 1C and Materials and Methods for data normalization and asymmetry calculation). Common copies of ETn/MusDs and IAPs show very similar marking of their flanking regions by H3K9me3 in both ES cell lines, as illustrated by a high frequency of copies near 0 RPKM asymmetry (Figure 1C and Figure S4). However, for polymorphic IAP copies, there is marked skewing towards high H3K9me3 in flanking regions of full sites (TT2) compared to empty sites (J1) (Figure 1C – skewness of -1.009). Hence, nearly all IAP copies induce local H3K9me3.
ETn/MusD elements show less pronounced skewing among polymorphic copies towards more H3K9me3 flanking full sites, but do show a different pattern when compared to common copies (Figure 1C). A minority of copies do indeed induce H3K9me3 deposition while the majority of the flanking regions do not seem to differ between full and empty sites. The limited number of polymorphic copies does not appear to be responsible for such a pattern since equivalently small sets of IAP polymorphic copies chosen randomly still show higher H3K9me3 in full sites (Figure S5). ETn/MusDs are highly expressed in ES cells (Figure S3A and S3B) and the copies identified by our study as being expressed (Figure S3 – note that uniquely aligned reads are biased towards old copies and therefore our analysis is an underrepresentation of expressed copies) are devoid of H3K9me3 and therefore do not promote spreading into the flanking regions. We have also observed ETn/MusD copies devoid of detectable expression and flanking H3K9me3 marking. We are unable to determine if individual IAP and ETn/MusD elements with equivalent levels of H3K9me3 are promoting different degrees of heterochromatin spreading into their flanking regions since the mappability of uniquely aligned reads is very low for single ERV copies (Figure S3C). Since the pattern of ETn/MusD H3K9me3 RPKM asymmetry is variable between copies it is possible that intrinsic characteristics of each copy may or may not trigger H3K9me3 deposition (see Figure S6 and Text S1).
Other ERVs variably induce H3K9me3 chromatin
Since very different scenarios were observed for ETn/MusDs and IAPs, we asked if other ERVs could also induce H3K9me3 chromatin in their flanking regions. We analyzed the flanking regions of full-length elements of four ERV families known to be regulated by H3K9me3 and one family (MTD) lacking H3K9me3 [16]. Note that we do not have insertional polymorphic data for these families but the vast majority are expected to be present in both J1 and TT2 since there is little evidence for recent retrotranspositional activity as judged by ERV-induced germ line mutations [34]. Most ERVs marked and regulated by H3K9me3 [16] do spread this mark into flanking regions but again, to different degrees (Figure 2). ERVK10C and RLTR1B robustly induce H3K9me3 while RLTR45 and RLTR10 present a modest enrichment, and MTD elements, as expected, are not associated with H3K9me3 in the flanking regions. Apart from ETn/MusD, the ERV families studied show low levels of overall expression (Figure S3A). However, analysis at the level of individual copies reveals that the few copies that are expressed are devoid of H3K9me3 (Figure S3B). As the percentage of expressed ERVs within each of these ERV families (as well as LINE elements) is low in ES cells, no correlation can be drawn between their expression and the different degrees of H3K9me3 spreading into their flanking regions. The presence of high H3K9me3 enrichment within the ERV sequences themselves is observed for all ERVs with the exception of MTD (Figure S3A). However, due to the mappability limitation (Figure S3C), we are unable to determine if single ERV copies marked with H3K9me3 from different families equally promote spreading towards flanking regions. Therefore, while regulation by H3K9me3 seems correlated with deposition of this mark in the flanks, it does not correlate with the robustness or level of such deposition, which seems to be either ERV-specific and/or single copy specific. Out of all the TEs analyzed, IAPs induce the highest level of H3K9me3 enrichment in their nearby flanking sequences.

Characterization of IAP-induced H3K9me3 chromatin
To better characterize the chromatin induced by IAPs, we chose five copies in neighborhoods devoid of genes and if possible other repeats in order to observe an unbiased environment far from potential selective pressures (Figure S7). We used genomic PCR to confirm the presence of IAP copies in both alleles of the TT2 cells (C57BL/6 x CBA F1 hybrid) and their absence in J1 cells (129 origin) (Table 1). We also confirmed the presence of H3K9me3 in their flanking regions (Figure S8) and assayed for the presence of H3K4me3 (permissive modification), H3K27me3 (repressive, but observed in bivalent domains together with H3K4me3 in ES cells [39]) and H4K20me3 (repressive) (Figure 3 and Figure S9, see Figure S10 for ChIP controls). The only histone post-translational modification that spreads into genomic DNA flanking IAP copies together with H3K9me3 is H4K20me3. These post-translational modifications often target the same regions and were shown previously to be associated with IAPs and LTR retrotransposons in general [12]–[14]. All other marks analyzed are absent from both the empty and full sites. It is important to note that Histone 3 is equally present in both sites, eliminating the possibility that full sites have more nucleosomes and hence are more enriched in histone modifications than empty sites (Figure 3). Polycomb group proteins (PcG) mediate the methylation of Histone 3 at lysine 27 [40]. Knock out of both PcG complexes induces loss of DNA methylation and upregulation of IAP copies [41]. Nevertheless no specific association of H3K27me3 with IAP was observed in our study which may be a consequence of our choice of copies being far from genes. Alternatively, induction of IAP expression in PcG depleted cells may be the result of indirect effects.


As described above, silencing of TEs is often associated with DNA methylation. It is important to note that 70–80% of all CpGs in the mouse genome are methylated, half in repeats [42]. CpG Islands seem to be the primary exception, as they generally remain unmethylated [43], [44]. This fact increases the probability that TEs insert into DNA methylated regions. Bisulfite sequencing of the five flanking regions of both full sites and empty sites show methylation regardless of the presence of an IAP copy (Figure 4A and Figure S11). A significant increase in DNA methylation compared to the empty site was observed on only one side of two copies (Figure S11). To obtain a global view of DNA methylation status, we performed a genome wide DNA methylation analysis (MeDIP-seq) in TT2 and J1 cells. No significant difference was observed between full and empty sites, in agreement with our bisulfite data (Figure 4B).

The presence of IAP copies is therefore not necessary for DNA methylation of the flanking regions analyzed. Also, together with many other reports [6], [45], [46] we show that IAP copies are indeed methylated (Figure 4A and Figure S11 – red circles).
Spreading of H3K9me3 associated with IAP insertion
Spreading of heterochromatin was first described in Drosophila melanogaster as a phenomenon called “position effect variegation” (PEV) where a transgene may be silenced if near heterochromatin (for a review see [47]). However, there are few documented examples of spreading of heterochromatin into flanking sequences and genes from TEs. In one case, two mouse B1 sequences were described as playing a crucial role in the establishment of a specific DNA methylation signal which appeared to be spreading towards flanking sequences but not reaching the nearby gene Aprt [48]. In mouse ES cells, 78% of sites comprising both H3K9me3 and H4K20me3 are near a satellite repeat or an IAP/ETn copy (maximum distance of 2Kb) [12]. In plants, S1 retrotransposons may lead to DNA methylation spreading into flanking sequences [49]. Finally, the most interesting and well-documented case of spreading of DNA methylation was also observed in plants, in which a DNA transposon is responsible for the spreading of DNA methylation into the CmWIP1 promoter leading to sexual determination in the melon [29].
Despite such few documented examples, spreading of repressive chromatin is nevertheless often cited as a potential consequence of TE presence [50], [51]. From the insertionally polymorphic families that we analyzed, IAPs would likely be the only family of TEs capable of robustly spreading heterochromatin since they are able to consistently induce its formation in their proximal neighborhood. We measured the extent of IAP induced spreading of the H3K9me3 mark into flanking sequences by examining non-overlapping windows of 2.5 kb from the insertion sites of polymorphic copies (Figure 5A and 5B). Only the first one kb surrounding IAP copies is markedly affected by the IAP insertion. Even though the following 1.5 kb is still biased towards higher H3K9me3 associated with the IAP, the skewing is not as obvious as in the first one kb. However, it is important to note that some IAP copies are able to induce spreading of the H3K9me3 mark for almost 5 kb (Figure 5, Figure 1B and Figures S12 and S13). The analysis of other ERV families, discussed above, shows a similar degree of spreading for ERVK10C but spreading from members of the other ERV families appears more limited in extent (Figure 2). Therefore, only the closest regions seem to be robustly marked by H3K9me3 as a result of a nearby ERV and as observed above.

Disruptive spreading into genes is rare
Given that H3K9me3 and H4K20me3, both of which have been shown to act as repressive marks, frequently extend at least one kb into genomic regions flanking IAP elements, we next determined whether such spreading could have a consequence on expression of neighboring host genes. We filtered the IAP polymorphic database for copies near transcription start sites (TSS – maximum distance of 5 kb) where H3K9me3 was detected at the IAP copy but also at the associated gene promoter. We required the gene promoter/TSS near the empty site not to be enriched in H3K9me3. Using RNA-seq data for both ES cell lines [16], we asked if the presence of a heterochromatic IAP copy might influence gene expression by comparing levels of RNA-seq reads in both lines. We found only one gene that matched these criteria. It is important to note, however, that IAPs near the TSS of genes are rare and therefore the number of IAP copies capable of disrupting gene expression is much lower than the total number of IAP copies analyzed. Indeed, from our dataset of polymorphic IAP copies [30], we found only four genes that harbor an upstream IAP copy less than 1 kb away (102 copies less than 5 kb away), and that differ in presence between strains C57BL/6 (TT2 cells) and 129 (J1 cells). Of these 102 cases, only one gene, B3galtl, a beta 1,3-galactosyltransferase-like gene, is differentially expressed in these two ES cell lines and this gene appears to be affected by heterochromatin spreading according to the criteria outlined above (see Figure S14 for genome browser view of this region).
The B3galtl gene has a solitary antisense IAP LTR just 368bp upstream of the TSS in J1 ES cells (129 origin) but not in either allele of TT2 cells (C57BL/6 x CBA F1 hybrid) (Table 1). We studied chromatin post-translational modifications in the full site and empty site and in the CpG island promoter in both ES cell lines. At the full site only, we observe the appearance of more repressive marks, namely H3K9me3 and H4K20me3, associated with the presence of the IAP copy (Figure 6A and Figure S14). Furthermore, this gene has a CpG island promoter that is likely normally unmethylated, so we predict that spreading of DNA methylation into the CpG Island might accompany the repressive histone marks and have an important impact. The empty site (TT2) has no DNA methylation in the upstream region nor in the CpG Island (Figure 6A). There is significant H3K4me3 enrichment in the CpG Island in TT2 cells, as expected since this gene is expressed in these cells. On the contrary, the full site analysis (J1) shows that the IAP element itself is methylated in nearly all molecules sequenced. Strikingly, in a subset of these molecules, methylation spreads into the CpG Island. Since we are comparing two cell lines of different mouse strains, we wanted to ensure that the differences observed were indeed caused by the IAP and not by a different genetic background. Therefore we studied DNA methylation in B6/129 hybrid ES cells so both alleles are in the same background. Again, DNA was methylated in the CpG Island only in the full site (Figure S15). In both bisulfite analyses, the IAP copy was heavily methylated, however the spacer region between the IAP and the gene's CpG island can be methylated or unmethylated. Since the spacer region harbors different methylation patterns, we hypothesize that this region functions as a buffer that generally limits DNA methylation spreading from the IAP. Nevertheless, it appears that if the spacer region becomes methylated then the adjoining CpG Island will also be fully methylated.

Since we observe spreading of repressive marks into the CpG island of B3Galtl, we wondered if any expression differences could be observed between both strains as suggested by the RNA-seq data. Indeed, the presence of the IAP insertion is associated with a decrease in the RNA expression of B3galtl (Figure 6B). Allelic quantification in the hybrid cell line also shows a decrease in expression of the 129 allele (Figure 6B) suggesting that spreading of heterochromatin from the IAP copy is impeding expression from this allele. Nevertheless, no detectable difference in protein expression was observed between the cell lines (Figure 6C and Figure S16). Taken together, these observations reveal that an IAP element insertion near a gene can indeed induce local heterochromatin (DNA methylation, H3K9me3 and H4K20me3) and modify gene transcription. The lack of a significant difference in protein abundance suggests that posttranscriptional mechanisms compensate for the lower RNA levels in J1.
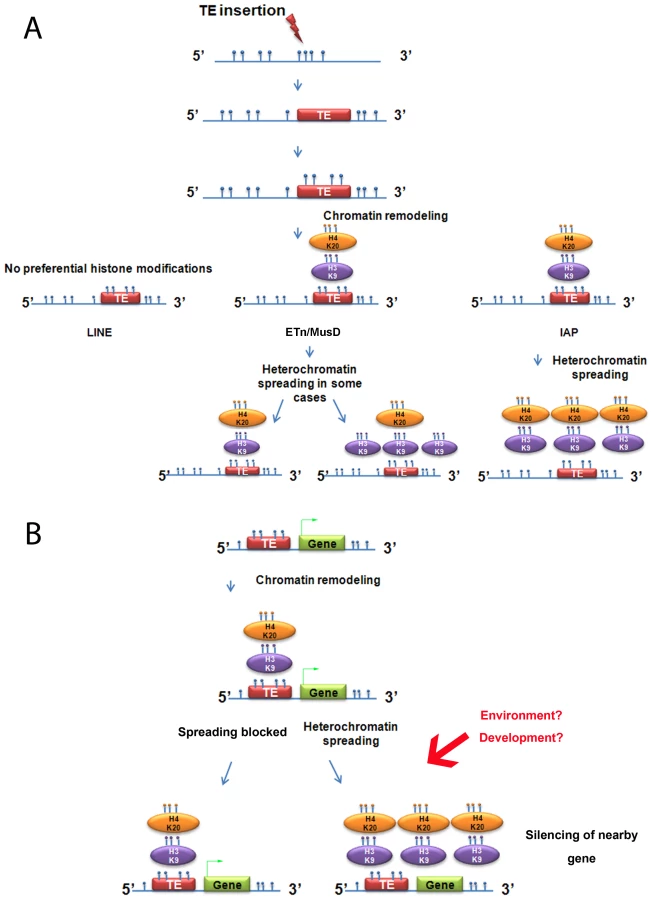
Concluding remarks
The strength of our model system to study induction of chromatin marks is the exploitation of natural insertional polymorphisms of TEs, which has advantages over an artificial system of introduced vectors that may not mimic natural loci. Using these polymorphic TEs, we demonstrate that, out of three abundant families of repeats in mouse, only IAPs consistently promote spreading of H3K9me3-H4K20me3-chromatin, robustly in the first 1 kb (Figure 7A). Indeed, the strong association of such chromatin and IAP copies allowed us to find new copies in the 129 mouse genome, but lacking in the sequenced B6 genome, by examining H3K9me3 regions differently enriched between both cell lines (Text S2). In contrast, LINE copies are not enriched in H3K9me3 and ETn/MusD are able to induce H3K9me3 chromatin only in some cases. The mechanisms and the nature of the IAP-induced heterochromatin are most likely responsible for the differences observed between IAPs, ETn/MusDs and LINEs as explained above. Indeed, the mechanisms regulating ERVs or LINEs are different in ES cells. IAPs and ETn/MusD are upregulated in mutants associated with H3K9me3 heterochromatin formation (ESET/Setdb1 [14]), the TRIM28/KAP1 pathway [15], and PcG complexes [41]) while LINEs are only modestly upregulated in such mutants [15] and mainly upregulated in DNA methylation mutants [7], [52]. DNA methylation influence on IAP copies in ES cells remains poorly understood as mutants of DNA methylation pathways (DNMT total KO) do not induce transcriptional upregulation of IAP copies while treatment with 5-azacytidine induces IAP over expression [15], [53]. Such a discrepancy could be explained by a recent report that the H3K9me3 genome-wide pattern in human cells is dramatically disturbed after treatment with 5-azacytidine [54]. As we observed, insertion sites for IAP copies are methylated at empty sites, suggesting that DNA methylation is not dependent on the presence of the IAP. Since the mouse genome is thought to be broadly methylated, one might extrapolate the results obtained for IAP empty sites to all TE empty sites. Henceforth, the global impact on the host genome of L1 copies probably involves other mechanisms than spreading of DNA methylation.
The analysis of other ERVs annotated in the sequenced genome shows that spreading of H3K9me3 towards flanking sequences is associated with regulation of the ERV family by this mark. However, the degree of deposition of this mark and also the spreading distance of such repressive chromatin seems to be unique for each of the families analyzed. There are two possible explanations for this observation. First, the degree of spreading of a TE family could be dependent on the number of copies that are actually targeted by H3K9me3, with copies marked with equivalent levels of H3K9me3 promoting equivalent spreading of heterochromatin. Alternatively, the degree of spreading of a TE family may be dependent on specific characteristics of each family, such that copies with equivalent H3K9me3 marking, if belonging to different families, would differently spread heterochromatin towards flanking regions. Our data cannot distinguish between these possibilities.
The mechanisms responsible for heterochromatin initiation in ERV copies in ES cells were recently studied. Small RNAs have been reported to act as central players in the formation and spreading of heterochromatin in several other species such as fission yeast and fruit flies, however in mammals such a role for small RNAs remains uncertain. It has been shown that DICER related pathways are not responsible for IAP repression [53]. Dicer-independent small RNAs, such as piRNAs, have only been described in the male germline of mouse [55]. Nevertheless, the influence of such small RNAs on the spreading of chromatin induced by IAPs and other ERVs should not be ruled out. Furthermore, we and others have shown that KAP1/Trim28 recruitment of SETDB1 is necessary for H3K9me3 silencing of ERVs in mouse ES cells [14], [15]. KAP1 along with KRAB-zinc finger proteins are able to induce spreading of repressive chromatin within 10 kb from the heterochromatin initiation site in humans [56] and such a mechanism might therefore be responsible for IAP induced-heterochromatin spreading in mouse.
Transposable elements have different life cycles and are expressed in different tissues and stages of development. It is well known that ETns are highly expressed in early development and then silenced [57]. Transgenic introduced IAPs are transcribed nearly exclusively in the male germ line [46] but expression of endogenous copies can be detected in thymocytes and other tissues [58]. Moreover, IAPs may become active in somatic tissues of old mice by demethylation of their sequences [45]. Mouse L1s have different expression patterns and even produce protein in testis for instance [59]. Therefore the time and place where the spreading of heterochromatin from these different families occurs may be different. Further analysis of other cell types, developmental stages and also other mouse strains would be of interest to compare to the results described here. Furthermore, epigenetic regulation of TEs may be influenced by environmental factors as already observed for several TEs [60]–[62]. Therefore, the induction and spreading of heterochromatin from a TE may be labile to environment and should be further studied in stressed conditions and during development. TEs may therefore provide cryptic sites for heterochromatin formation and also spreading.
We show that IAP induced repressive chromatin can affect the CpG island promoter of a neighboring mouse gene in cis, and in turn reduce expression of the genic mRNA. The paucity of examples of such a phenomenon is likely due to the fact that insertions of ERVs which attract and spread repressive chromatin and which occur very close to gene transcriptional start sites are strongly selected against unless such spreading is blocked (Figure 7B). Intriguingly, there are numerous situations where ERV LTRs are actually co-opted as constitutive, tissue-specific or developmental-specific promoters or enhancers for genes [63]–[65], indicating that the relationship between ERVs and genes is complex and multi-faceted. Even if the impact of ERV-induced heterochromatin is rare, it may participate in malleability of the host genome as epigenetic regulation of IAP copies and other TEs may be tissue or developmental-stage specific but also susceptible to environmental changes [66] (Figure 7B). The impact of TEs in genome evolution and speciation is being increasingly appreciated [2] and our report suggests that some TEs may have an indirect impact on host adaptive potential by spreading of epigenetic marks. As described for the sexual determination of melon [29], IAPs and other ERVs may have played a role in the genome evolution of Mus musculus through fine-tuning of genes by ERV-induced-heterochromatin. Indeed, since new insertions of IAPs continue to bombard the mouse genome, this fine-tuning of gene expression is likely ongoing and may contribute to phenotypic differences between strains.
Materials and Methods
Biological material
J1 and TT2 ES cells were passaged every 48–72 hours in DMEM supplemented with 15% FBS (HyClone), 20 mM HEPES, 0.1 mM nonessential amino acids, 0.1 mM 2-mercaptoethanol, 100 units/ml penicillin, 0.05 mM streptomycin, leukemia inhibitory factor (LIF) and 2mM glutamine on gelatinized plates.
Transposable element copies
Common and polymorphic copies of ETn/MusD and IAP were obtained from our previous analysis of different strains of mouse [30]. In our analysis, ETn and IAP subtypes are grouped as a major family. Coordinates for regions containing LINE copies were obtained from [16] and include only the L1MdA subfamily. All coordinates depicted in figures and bioinformatics analyses refer to the sequenced mouse genome, July 2007 (NCBI37/mm9).
ChIP-seq and MeDIP-seq
Methods and details on H3K9me3 ChIP-seq can be found in Karimi et al. [16]. For the layout of the experiments please see Figure S2.
MeDIP-seq libraries were constructed as described in Harris et al. [67], from 1 µg of genomic DNA using an anti-5-Methylcytidine monoclonal antibody obtained from Eurogentec (cat# BI-MECY-0100, lot#080808) and sequenced on an Illumina Genome Analyzeriix following the manufacturer's recommended protocol (Illumina Inc., Hayward, CA). The resulting sequence reads were aligned using BWA v0.5.7 [68] using default parameters to the mouse reference genome (mm9). Uniquely placed sequence reads with a mapping quality of > = 10 were passed to FindPeaks v4.1 [69] for segmentation and wig [70] track generation with -dist_type = 0 [200], -duplicatefilter and no thresholding. After filtering, 23,293,703 and 23,672,774 reads remained for the TT2 and J1 libraries respectively. Custom Java program was used to calculate RPKM values for genomic regions of interest. RPKM was calculated using normalized genome coverage.
Bioinformatics analyses
To compare total average density of H3K9me3 between two cell lines we used only full-length elements including flanking LTRs. For example out of 7,666 IAPE elements annotated in UCSC (mm9), only 1,318 (945 common and 373 polymorphic) satisfied the length selection criteria (total length > = 4000 bp) and were used in the analysis. Using the strand information, for every copy we identified the 5′ and 3′ 5 kb flanking regions and calculated coverage profiles in these regions for BWA aligned H3K9me3 reads directionally extended by 150 bp. To calculate total average density we agglomerated 5′ profiles and 3′ profiles for all elements for a given family and normalized them by 1) total number of copies in the family and 2) relative number of aligned reads in the library between TT2 and J1 cell lines. Reads were filtered by the BWA alignment quality (QC> = 7). If there were more than one sequenced read aligned to the same location, it was considered only once. Reads mapped to multiple locations were ignored.
In order to compare H3K9me3 or MeDIP coverage in specific regions between the two ES cell lines, a normalization factor has to be taken into account. We calculated the Reads per Kilobase per million mapped reads (denoted RPKM [71]) in all regions of interest for ChIP-seq samples. The following formula was used to calculate RPKM for these regions:
where n is a fractional number of reads aligned to the region, L is the length of the region in Kb, and N is the total number of aligned reads for a given sample, in millions.
For pair-wise H3K9me3 comparisons, we calculated the RPKM asymmetry across samples:
where RPKMTT2 and RPKMJ1 are RPKMs in the region of interest of TT2 and J1 samples respectively, and is a very small number to avoid dividing by zero. The asymmetry calculation gives us a number comprised between -1 (enriched only in J1) and +1 (enriched only in TT2) allowing us to directly compare H3K9me3 enrichment in specific regions between both cell lines. For further details on the ChIP-seq and RNA-seq data analysis refer to [16].
The skewness is a measure of the asymmetry of a distribution. If the skewness is equal to 0 the distribution is symmetric. When the skewness is negative, the left tail of the distribution is longer. When applied to our dataset it means that if the peak of frequency is >0 and the skewness is negative than the TT2 cells are more enriched than J1 at the loci analyzed. The skewness and other statistical tests (Kruskal-Wallis and Dunn comparison tests) were calculated using GraphPad Prism version 5.00 for Windows, GraphPad Software, San Diego California USA.
To plot heat maps of H3K9me3, we used the same coverage profiles as described above. Color indicates coverage at every base in the flank of individual copies. Rows corresponding to individual IAP elements were sorted according to the total coverage of H3K9me3 in the 5′ flank of the copies present in TT2 in the descending order. Same ordering of elements was preserved in the heat map showing H3K9me3 in J1.
To evaluate a mappability of a given genomic region we averaged genomic mappability (CRG Alignability) profiles that we downloaded in a form of bedGraph from the UCSC browser (http://genome.ucsc.edu [72]) and converted into a wig file. The value of mappability for every base in the genome for a given read length (50 bp in our case) gives a fraction of reads covering a given base and aligned uniquely to this genomic position even when up to two mismatches are allowed and ranges from 0 to 1.
Chromatin immunoprecipitation and quantitative PCR
Two biological replicates of 107 TT2 and J1 cells were used for Native ChIP. Cells were homogenized in a douncing buffer (10 mM Tris-HCl pH 7.5, 4 mM MgCl2, 1 mM CaCl2 and protease inhibitors) and disrupted using a p1000 tip and a syringe. Micrococcal nuclease digestion (150 U/ml) was performed for 7 min at 37°C and stopped with 10 mM EDTA. Correct digestion of the chromatin was verified by gel electrophoresis. Further lysis of the digested chromatin was done by incubating it 1 hour on ice with 1 ml of hypotonic lysis buffer (0.2 mM EDTA pH 8, 0.1 mM benzamidine, 0.1 mM PMSF, 1.5 mM DTT and protease inhibitors) and vortexing every 10 min. The digested chromatin was centrifuged at 3000g for 5 min and the supernatant was pre-cleared at 4°C for 2 hours in a rotating wheel with 100 µl of 50% solution of pre-blocked Protein A beads. Pre-cleared chromatin was aliquoted into 7 fractions (6 IP and 1 Input) and all IP fraction volumes were brought to 325 µl using IP Buffer (10 mM Tris-HCl, 1% Triton, 0.1% Deoxycholate, 0.1% SDS, 90 mM NaCl, 2 mM EDTA and protease inhibitors). We used antibodies recognizing total Histone H3 (Sigma, H9289), and histone modifications as H3K4me3 (Millipore, 17–614), H3K27me3 (Millipore, 07–449), H3K9me3 (Millipore, 07–442), H4K20me3 (Millipore, 17–671) and also IgG (12–370) as a negative control. After 1 hour at 4°C in a rotating wheel we added 20 µl of 50% solution of pre-blocked Protein A beads and rotated at 4°C overnight. Washes were held the next day by adding 400 µl of washing buffer to the beads (20 mM Tris-HCl pH 8, 0.1% SDS, 1% Triton X-100, 2 mM EDTA, 150 mM NaCl and protease inhibitors), rotating the samples for 3 min at 4°C and spinning at 4000 rpm. The amount of NaCl was increased in the second wash step (500 mM NaCl) and performed as described above. The INPUT and IP fractions were eluted with 100 µl of 100 mM NaHCO3 - 1% SDS. RNase treatment was performed for 2 hours at 68°C with gentle vortexing. The IP samples were spun at 4000 rpm for 2 min and the supernatant recovered (twice). All samples were purified with the Qiaquick PCR purification kit (Qiagen) and quantified by using the PicoGreen system from Invitrogen. 0.05 ng/µl of ChIP material was analyzed in technical duplicates through quantitative PCR (Fast SYBR Green Master Mix from Applied Biosystems) by comparing the amplification of Input DNA relative to immunoprecipitated DNA (IP) using the formula “Efficiency of primers∧(CtInput – CtIP)” where the efficiency is calculated through serial dilutions of Input DNA (primers efficiency were all comprised between 1.9 and 2.1). ChIP enrichment for each specific antibody was tested with control regions for each antibody used for both ES cells (Figure S10). For H4K20me3, primers located more than one nucleosome away (150 bp) were tested to confirm spreading of this mark (Figure S9). All primers are listed in Table S1.
Bisulfite conversion
Bisulfite conversion, PCR, cloning and sequencing were carried out as described previously [73]. All the sequences included in the analyses either displayed unique methylation patterns or unique C to T non-conversion errors (remaining C's not belonging to a CpG dinucleotide) after bisulfite treatment of the genomic DNA. This avoids considering several PCR-amplified sequences resulting from the same template molecule (provided by a single cell). All sequences had a conversion rate >95%. Sequences were analyzed with the Quma free online software [74].
Expression analysis
Total RNA was extracted (two biological replicates for each ES cell line) with the All Prep DNA/RNA mini kit from Qiagen. RNA was treated with the Turbo DNA-free kit from Ambion in order to remove DNA. One µg of total RNA extracts was reverse transcribed with SuperScript II reverse transcriptase system (Invitrogen). We synthesized two different cDNAs (65°C for 5 min, 25°C for 5 min, 50°C for 60 min and 70°C for 15 min): a control reaction with no reverse transcriptase to test DNA contamination, and a pool of total cDNA synthesized with random primers. The cDNA samples were diluted 10 fold, and PCR was carried out using Fast SYBR Green Master Mix (Applied Biosystems) using specific primers for each gene analyzed. Primers were chosen surrounding introns in order to amplify 100-250 bp fragments of cDNA. Quantitative PCR cycling conditions were 20 s at 95°C (1 cycle), and then 3 s at 95°C, followed by 30 s at 60°C (45cycles). Reactions were done in duplicate, and standard curves were calculated from serial dilutions of cDNA. The quantity of the transcripts was estimated relative to the expression of tubulin, actin and TBP (TATA binding protein); chosen as the most stable genes out of 6 reference genes tested using the GeNorm method [75]; with the equation “Absolute quantity = “Efficiency of primers∧(-Ct)”. Primers efficiency were equivalent and chosen between 1.9 and 2. All primers are listed in Table S1.
For determining allele-specific expression, RNA extraction and cDNA synthesis was carried as described above. Allelic expression was determined with the PeakPicker software [76] based on chromatogram analysis of cDNA and genomic PCR fragments.
Western blot
Western blot was done with biological triplicates. Cells were washed in PBS and solubilised in RIPA buffer (150 mM NaCl, Triton-X 1%, 50 mM Tris-HCl pH8, 0.1% SDS and 50 mM sodium deoxycholate) for 20 min at 4°C. For performing Western blot analysis, total cell extracts (40 µg/lane) were size-fractionated by NuPAGE 4-12% Bis-Tris Gel (Invitrogen) and transferred to polyvinylidene difluoride membranes. The membranes were blocked for one hour and then incubated with first antibodies against B3GALTL (Santa Cruz sc-67610) and ACTIN (Sigma A2066) overnight. After washing, blots were incubated with the secondary antibodies for one hour (1 : 8000 Peroxidase rabbit anti-goat (Sigma A5420) and 1∶10000 goat anti-rabbit (Sigma A0545), and specifically bound antibodies were detected with the ECL (Thermo Scientific). The films were then scanned and the quantification of B3GALTL protein was performed using Adobe Photoshop (San Jose, CA) with three biological replicates as previously described [77]. For each lane, the B3GALTL level was normalized to that of ACTIN (Figure S16).
Supporting Information
Zdroje
1. BiemontCVieiraC 2006 Genetics: junk DNA as an evolutionary force. Nature 443 521 524
2. RebolloRHorardBHubertBVieiraC 2010 Jumping genes and epigenetics: Towards new species. Gene 454 1 7
3. HedgesDJDeiningerPL 2007 Inviting instability: Transposable elements, double-strand breaks, and the maintenance of genome integrity. Mutat Res 616 46 59
4. FeschotteC 2008 Transposable elements and the evolution of regulatory networks. Nat Rev Genet 9 397 405
5. JordanIKMatyuninaLVMcDonaldJF 1999 Evidence for the recent horizontal transfer of long terminal repeat retrotransposon. Proc Natl Acad Sci U S A 96 12621 12625
6. WalshCPChailletJRBestorTH 1998 Transcription of IAP endogenous retroviruses is constrained by cytosine methylation. Nat Genet 20 116 117
7. Bourc'hisDBestorTH 2004 Meiotic catastrophe and retrotransposon reactivation in male germ cells lacking Dnmt3L. Nature 431 96 99
8. TanurdzicMVaughnMWJiangHLeeTJSlotkinRK 2008 Epigenomic consequences of immortalized plant cell suspension culture. PLoS Biol 6 e302 doi:10.1371/journal.pbio.0060302
9. KlenovMSLavrovSAStolyarenkoADRyazanskySSAravinAA 2007 Repeat-associated siRNAs cause chromatin silencing of retrotransposons in the Drosophila melanogaster germline. Nucleic Acids Res 35 5430 5438
10. MaloneCDBrenneckeJDusMStarkAMcCombieWR 2009 Specialized piRNA pathways act in germline and somatic tissues of the Drosophila ovary. Cell 137 522 535
11. FagegaltierDBougeALBerryBPoisotESismeiroO 2009 The endogenous siRNA pathway is involved in heterochromatin formation in Drosophila. Proc Natl Acad Sci U S A 106 21258 21263
12. MikkelsenTSKuMJaffeDBIssacBLiebermanE 2007 Genome-wide maps of chromatin state in pluripotent and lineage-committed cells. Nature 448 553 560
13. MartensJHO'SullivanRJBraunschweigUOpravilSRadolfM 2005 The profile of repeat-associated histone lysine methylation states in the mouse epigenome. EMBO J 24 800 812
14. MatsuiTLeungDMiyashitaHMaksakovaIAMiyachiH 2010 Proviral silencing in embryonic stem cells requires the histone methyltransferase ESET. Nature 464 927 931
15. RoweHMJakobssonJMesnardDRougemontJReynardS 2010 KAP1 controls endogenous retroviruses in embryonic stem cells. Nature 463 237 240
16. KarimiMMGoyalPMaksakovaIABilenkyMLeungD 2011 DNA methylation and SETDB1/H3K9me3 regulate predominantly distinct sets of genes, retroelements and chimaeric transcripts in mouse ES cells. Cell Stem Cell 8 676 687
17. YasuharaJCWakimotoBT 2008 Molecular landscape of modified histones in Drosophila heterochromatic genes and euchromatin-heterochromatin transition zones. PLoS Genet 4 e16 doi:10.1371/journal.pgen.0040016
18. PimpinelliSBerlocoMFantiLDimitriPBonaccorsiS 1995 Transposable elements are stable structural components of Drosophila melanogaster heterochromatin. Proc Natl Acad Sci U S A 92 3804 3808
19. HoskinsRASmithCDCarlsonJWCarvalhoABHalpernA 2002 Heterochromatic sequences in a Drosophila whole-genome shotgun assembly. Genome Biol 3 RESEARCH0085
20. BiemontC 2009 Are transposable elements simply silenced or are they under house arrest? Trends Genet 25 333 334
21. IkedaRKokubuCYusaKKengVWHorieK 2007 Sleeping beauty transposase has an affinity for heterochromatin conformation. Mol Cell Biol 27 1665 1676
22. GeorgeJADeBaryshePGTraverseKLCelnikerSEPardueML 2006 Genomic organization of the Drosophila telomere retrotransposable elements. Genome Res 16 1231 1240
23. DaiJXieWBradyTLGaoJVoytasDF 2007 Phosphorylation regulates integration of the yeast Ty5 retrotransposon into heterochromatin. Mol Cell 27 289 299
24. DorerDRHenikoffS 1994 Expansions of transgene repeats cause heterochromatin formation and gene silencing in Drosophila. Cell 77 993 1002
25. GarrickDFieringSMartinDIWhitelawE 1998 Repeat-induced gene silencing in mammals. Nat Genet 18 56 59
26. ConteCCalcoVDessetSLeblancPDastugueB 2000 Impact of multiple insertions of two retroelements, ZAM and Idefix at an euchromatic locus. Genetica 109 53 59
27. WangZWillardHFMukherjeeSFureyTS 2006 Evidence of influence of genomic DNA sequence on human X chromosome inactivation. PLoS Comput Biol 2 e113 doi:10.1371/journal.pcbi.0020113
28. SchneidermanJIGoldsteinSAhmadK 2010 Perturbation analysis of heterochromatin-mediated gene silencing and somatic inheritance. PLoS Genet 6 e1001095 doi:10.1371/journal.pgen.1001095
29. MartinATroadecCBoualemARajabMFernandezR 2009 A transposon-induced epigenetic change leads to sex determination in melon. Nature 461 1135 1138
30. ZhangYMaksakovaIAGagnierLvan de LagemaatLNMagerDL 2008 Genome-wide assessments reveal extremely high levels of polymorphism of two active families of mouse endogenous retroviral elements. PLoS Genet 4 e1000007 doi:10.1371/journal.pgen.1000007
31. AkagiKStephensRMLiJEvdokimovEKuehnMR 2010 MouseIndelDB: a database integrating genomic indel polymorphisms that distinguish mouse strains. Nucleic Acids Res 38 D600 606
32. WaterstonRHLindblad-TohKBirneyERogersJAbrilJF 2002 Initial sequencing and comparative analysis of the mouse genome. Nature 420 520 562
33. KazazianHHJr 1998 Mobile elements and disease. Curr Opin Genet Dev 8 343 350
34. MaksakovaIARomanishMTGagnierLDunnCAvan de LagemaatLN 2006 Retroviral elements and their hosts: insertional mutagenesis in the mouse germ line. PLoS Genet 2 e2 doi:10.1371/journal.pgen.0020002
35. MagerDLFreemanJD 2000 Novel mouse type D endogenous proviruses and ETn elements share long terminal repeat and internal sequences. J Virol 74 7221 7229
36. RibetDDewannieuxMHeidmannT 2004 An active murine transposon family pair: retrotransposition of “master” MusD copies and ETn trans-mobilization. Genome Res 14 2261 2267
37. MaksakovaIAZhangYMagerDL 2009 Preferential epigenetic suppression of the autonomous MusD over the nonautonomous ETn mouse retrotransposons. Mol Cell Biol 29 2456 2468
38. OstertagEMKazazianHHJr 2001 Biology of mammalian L1 retrotransposons. Annu Rev Genet 35 501 538
39. BernsteinBEMikkelsenTSXieXKamalMHuebertDJ 2006 A bivalent chromatin structure marks key developmental genes in embryonic stem cells. Cell 125 315 326
40. CaoRWangLWangHXiaLErdjument-BromageH 2002 Role of histone H3 lysine 27 methylation in Polycomb-group silencing. Science 298 1039 1043
41. LeebMPasiniDNovatchkovaMJaritzMHelinK 2010 Polycomb complexes act redundantly to repress genomic repeats and genes. Genes Dev 24 265 276
42. EdwardsJRO'DonnellAHRollinsRAPeckhamHELeeC 2010 Chromatin and sequence features that define the fine and gross structure of genomic methylation patterns. Genome Res 20 972 980
43. AntequeraFBirdA 1993 Number of CpG islands and genes in human and mouse. Proc Natl Acad Sci U S A 90 11995 11999
44. AntequeraF 2003 Structure, function and evolution of CpG island promoters. Cell Mol Life Sci 60 1647 1658
45. BarbotWDupressoirALazarVHeidmannT 2002 Epigenetic regulation of an IAP retrotransposon in the aging mouse: progressive demethylation and de-silencing of the element by its repetitive induction. Nucleic Acids Res 30 2365 2373
46. DupressoirAHeidmannT 1996 Germ line-specific expression of intracisternal A-particle retrotransposons in transgenic mice. Mol Cell Biol 16 4495 4503
47. GirtonJRJohansenKM 2008 Chromatin structure and the regulation of gene expression: the lessons of PEV in Drosophila. Adv Genet 61 1 43
48. YatesPABurmanRWMummaneniPKrusselSTurkerMS 1999 Tandem B1 elements located in a mouse methylation center provide a target for de novo DNA methylation. J Biol Chem 274 36357 36361
49. ArnaudPGoubelyCPelissierTDeragonJM 2000 SINE retroposons can be used in vivo as nucleation centers for de novo methylation. Mol Cell Biol 20 3434 3441
50. GoodierJLKazazianHHJr 2008 Retrotransposons revisited: the restraint and rehabilitation of parasites. Cell 135 23 35
51. SlotkinRKMartienssenR 2007 Transposable elements and the epigenetic regulation of the genome. Nat Rev Genet 8 272 285
52. KatoYKanedaMHataKKumakiKHisanoM 2007 Role of the Dnmt3 family in de novo methylation of imprinted and repetitive sequences during male germ cell development in the mouse. Hum Mol Genet 16 2272 2280
53. HutnickLKHuangXLooTCMaZFanG 2010 Repression of retrotransposal elements in mouse embryonic stem cells is primarily mediated by a DNA methylation-independent mechanism. J Biol Chem 285 21082 21091
54. KomashkoVMFarnhamPJ 2010 5-azacytidine treatment reorganizes genomic histone modification patterns. Epigenetics 5
55. AravinAGaidatzisDPfefferSLagos-QuintanaMLandgrafP 2006 A novel class of small RNAs bind to MILI protein in mouse testes. Nature 442 203 207
56. GronerACMeylanSCiuffiAZanggerNAmbrosiniG 2010 KRAB-zinc finger proteins and KAP1 can mediate long-range transcriptional repression through heterochromatin spreading. PLoS Genet 6 e1000869 doi:10.1371/journal.pgen.1000869
57. BruletPKaghadMXuYSCroissantOJacobF 1983 Early differential tissue expression of transposon-like repetitive DNA sequences of the mouse. Proc Natl Acad Sci U S A 80 5641 5645
58. DupressoirAPuechAHeidmannT 1995 IAP retrotransposons in the mouse liver as reporters of ageing. Biochim Biophys Acta 1264 397 402
59. BranciforteDMartinSL 1994 Developmental and cell type specificity of LINE-1 expression in mouse testis: implications for transposition. Mol Cell Biol 14 2584 2592
60. WaterlandRAJirtleRL 2004 Early nutrition, epigenetic changes at transposons and imprinted genes, and enhanced susceptibility to adult chronic diseases. Nutrition 20 63 68
61. WaterlandRAJirtleRL 2003 Transposable elements: targets for early nutritional effects on epigenetic gene regulation. Mol Cell Biol 23 5293 5300
62. DramardXHeidmannTJensenS 2007 Natural epigenetic protection against the I-factor, a Drosophila LINE retrotransposon, by remnants of ancestral invasions. PLoS One 2 e304 doi:10.1371/journal.pone.0000304
63. CohenCJLockWMMagerDL 2009 Endogenous retroviral LTRs as promoters for human genes: a critical assessment. Gene 448 105 114
64. KunarsoGChiaNYJeyakaniJHwangCLuX 2010 Transposable elements have rewired the core regulatory network of human embryonic stem cells. Nat Genet 42 631 634
65. MacfarlanTSGiffordWDAgarwalSDriscollSLettieriK 2011 Endogenous retroviruses and neighboring genes are coordinately repressed by LSD1/KDM1A. Genes Dev 25 594 607
66. DolinoyDC 2008 The agouti mouse model: an epigenetic biosensor for nutritional and environmental alterations on the fetal epigenome. Nutr Rev 66 Suppl 1 S7 11
67. HarrisRAWangTCoarfaCNagarajanRPHongC 2010 Comparison of sequencing-based methods to profile DNA methylation and identification of monoallelic epigenetic modifications. Nat Biotechnol 28 1097 1105
68. LiHDurbinR 2010 Fast and accurate long-read alignment with Burrows-Wheeler transform. Bioinformatics 26 589 595
69. FejesAPRobertsonGBilenkyMVarholRBainbridgeM 2008 FindPeaks 3.1: a tool for identifying areas of enrichment from massively parallel short-read sequencing technology. Bioinformatics 24 1729 1730
70. KentWJZweigASBarberGHinrichsASKarolchikD 2010 BigWig and BigBed: enabling browsing of large distributed datasets. Bioinformatics 26 2204 2207
71. MortazaviAWilliamsBAMcCueKSchaefferLWoldB 2008 Mapping and quantifying mammalian transcriptomes by RNA-Seq. Nat Methods 5 621 628
72. RheadBKarolchikDKuhnRMHinrichsASZweigAS 2010 The UCSC Genome Browser database: update 2010. Nucleic Acids Res 38 D613 619
73. ReissDZhangYMagerDL 2007 Widely variable endogenous retroviral methylation levels in human placenta. Nucleic Acids Res 35 4743 4754
74. KumakiYOdaMOkanoM 2008 QUMA: quantification tool for methylation analysis. Nucleic Acids Res 36 W170 175
75. VandesompeleJDe PreterKPattynFPoppeBVan RoyN 2002 Accurate normalization of real-time quantitative RT-PCR data by geometric averaging of multiple internal control genes. Genome Biol 3 RESEARCH0034
76. GeBGurdSGaudinTDoreCLepageP 2005 Survey of allelic expression using EST mining. Genome Res 15 1584 1591
77. MillerRKQadotaHStarkTJMercerKBWorthamTS 2009 CSN-5, a component of the COP9 signalosome complex, regulates the levels of UNC-96 and UNC-98, two components of M-lines in Caenorhabditis elegans muscle. Mol Biol Cell 20 3608 3616
78. TatusovaTAMaddenTL 1999 BLAST 2 Sequences, a new tool for comparing protein and nucleotide sequences. FEMS Microbiol Lett 174 247 250
79. BaustCGagnierLBaillieGJHarrisMJJuriloffDM 2003 Structure and expression of mobile ETnII retroelements and their coding-competent MusD relatives in the mouse. J Virol 77 11448 11458
80. ReissDZhangYRouhiAReuterMMagerDL 2010 Variable DNA methylation of transposable elements: the case study of mouse Early Transposons. Epigenetics 5 68 79
81. JurkaJ 2000 Repbase update: a database and an electronic journal of repetitive elements. Trends Genet 16 418 420
82. NingZCoxAJMullikinJC 2001 SSAHA: a fast search method for large DNA databases. Genome Res 11 1725 1729
Štítky
Genetika Reprodukční medicínaČlánek vyšel v časopise
PLOS Genetics
2011 Číslo 9
Nejčtenější v tomto čísle
- Retrotransposon-Induced Heterochromatin Spreading in the Mouse Revealed by Insertional Polymorphisms
- The Evolutionarily Conserved Longevity Determinants HCF-1 and SIR-2.1/SIRT1 Collaborate to Regulate DAF-16/FOXO
- Genome-Wide Analysis of Heteroduplex DNA in Mismatch Repair–Deficient Yeast Cells Reveals Novel Properties of Meiotic Recombination Pathways
- Association of eGFR-Related Loci Identified by GWAS with Incident CKD and ESRD