
Study of FoxA Pioneer Factor at Silent Genes Reveals Rfx-Repressed Enhancer at and a Potential Indicator of Esophageal Adenocarcinoma Development
Understanding how silent genes can be competent for activation provides insight into development as well as cellular reprogramming and pathogenesis. We performed genomic location analysis of the pioneer transcription factor FoxA in the adult mouse liver and found that about one-third of the FoxA bound sites are near silent genes, including genes without detectable RNA polymerase II. Virtually all of the FoxA-bound silent sites are within conserved sequences, suggesting possible function. Such sites are enriched in motifs for transcriptional repressors, including for Rfx1 and type II nuclear hormone receptors. We found one such target site at a cryptic “shadow” enhancer 7 kilobases (kb) downstream of the Cdx2 gene, where Rfx1 restricts transcriptional activation by FoxA. The Cdx2 shadow enhancer exhibits a subset of regulatory properties of the upstream Cdx2 promoter region. While Cdx2 is ectopically induced in the early metaplastic condition of Barrett's esophagus, its expression is not necessarily present in progressive Barrett's with dysplasia or adenocarcinoma. By contrast, we find that Rfx1 expression in the esophageal epithelium becomes gradually extinguished during progression to cancer, i.e, expression of Rfx1 decreased markedly in dysplasia and adenocarcinoma. We propose that this decreased expression of Rfx1 could be an indicator of progression from Barrett's esophagus to adenocarcinoma and that similar analyses of other transcription factors bound to silent genes can reveal unanticipated regulatory insights into oncogenic progression and cellular reprogramming.
Published in the journal:
. PLoS Genet 7(9): e32767. doi:10.1371/journal.pgen.1002277
Category:
Research Article
doi:
https://doi.org/10.1371/journal.pgen.1002277
Summary
Understanding how silent genes can be competent for activation provides insight into development as well as cellular reprogramming and pathogenesis. We performed genomic location analysis of the pioneer transcription factor FoxA in the adult mouse liver and found that about one-third of the FoxA bound sites are near silent genes, including genes without detectable RNA polymerase II. Virtually all of the FoxA-bound silent sites are within conserved sequences, suggesting possible function. Such sites are enriched in motifs for transcriptional repressors, including for Rfx1 and type II nuclear hormone receptors. We found one such target site at a cryptic “shadow” enhancer 7 kilobases (kb) downstream of the Cdx2 gene, where Rfx1 restricts transcriptional activation by FoxA. The Cdx2 shadow enhancer exhibits a subset of regulatory properties of the upstream Cdx2 promoter region. While Cdx2 is ectopically induced in the early metaplastic condition of Barrett's esophagus, its expression is not necessarily present in progressive Barrett's with dysplasia or adenocarcinoma. By contrast, we find that Rfx1 expression in the esophageal epithelium becomes gradually extinguished during progression to cancer, i.e, expression of Rfx1 decreased markedly in dysplasia and adenocarcinoma. We propose that this decreased expression of Rfx1 could be an indicator of progression from Barrett's esophagus to adenocarcinoma and that similar analyses of other transcription factors bound to silent genes can reveal unanticipated regulatory insights into oncogenic progression and cellular reprogramming.
Introduction
The development of a multicellular organism requires the formation of functionally distinct cell types through the differential activation of gene expression. Such gene expression programs are enabled by transcription factors that endow the progenitors with the competence to differentiate under the influence of inductive signals [1]–[6]. During pathogenesis, effectors that damage cells can lead to aberrant induction of gene expression, but in these cases less is known about the transcription factor networks that govern the competence for such changes. In this paper, we describe a means to reveal transcription factor networks that underlie the ability of endoderm-derived tissues to undergo metaplasia, or cell type conversion, during pathogenesis [7].
FoxA transcription factors help establish developmental competence for the endoderm-derived tissues [6], [8]. In the mouse there are three non-allelic FoxA genes, each containing a highly conserved winged-helix forkhead DNA-binding domain [9]. FoxA2 is the earliest to be expressed and is required for endoderm development [10]–[12], while FoxA1 and FoxA2 are redundantly required for liver development [13]. We previously found that a FoxA target site is engaged at the alb1 gene enhancer in undifferentiated mouse endoderm cells where alb1 is transcriptionally silent, and occupancy correlates with the potential of the cells to be activated in response to developmental signals [14]–[16]. FoxA factors were further shown to occupy their sites on nucleosomes in compacted chromatin in vitro and open a local domain for other factors to bind [17]. This led to the concept of FoxA as a pioneer factor, endowing competence for silent genes to be activated [6]. The pioneer model extends to acute hormone regulation in adult cells, where prior FoxA engagement in chromatin enables estrogen receptor and androgen receptor binding to chromatin and subsequent gene activation [18]–[20].
Another context for silent gene activation is typified by metaplastic transitions, where a cell changes from one type to another. These transitions often occur in response to chronic cellular injury, resulting in pathology. Cdx2 is a homeodomain transcription factor expressed in the developing gut, where it mediates the differentiation of intestinal epithelial cells [21]–[23]. In the adult, Cdx2 expression is normally restricted to the mid - and hindgut regions; loss of Cdx2 in the gut leads to expression of an esophageal program [23]. Indeed, chronic esophageal damage from reflux of gastro-duodenal contents can result in the aberrant expression of Cdx2 in the esophageal foregut epithelium and, together with other molecular changes, promotes metaplasia of the cells to an intestinal phenotype (Barrett's Esophagus) and subsequent adenocarcinoma [24]–[26]. A fundamental question in such circumstances is whether pioneer or competence factors might engage silent genes in normal cells, such as at Cdx2 in endodermal cells of non-intestinal lineages, thereby potentiating the genes' aberrant activation. If such is the case, there may be regulatory mechanisms that normally restrain such activation. Understanding such networks would provide insight into the basis for diverse pathologies.
To better understand how regulatory factors might endow transcriptional competence for silent genes, as well as how other factors might restrain such competence, we analyzed FoxA2 occupancy in the adult mouse liver, where FoxA factors can occupy silent genes [27], [28]. Using our genomic data, we analyzed transcription factor binding motifs adjacent to FoxA2-bound sites at genes that are silent, separately from motifs at FoxA2-bound sites at genes that are active. We identified binding motifs for the repressors Rfx1 and type II nuclear hormone receptors at the silent FoxA2 gene targets and confirmed protein binding and subsequent repression of adjacent FoxA2 sites at a novel and otherwise silent, Cdx2 enhancer element in non-intestinal cells. We further investigated the status of Rfx1 in human esophageal epithelium and in different precursor lesions leading to adenocarcinoma. We conclude that FoxA can occupy silent genes whose activation is restricted by locally binding repressors and suggest that perturbation of such networks can help explain cellular changes leading to invasive cancer. Our approach revealed that Rfx1 expression decreases gradually during cellular progression to esophageal adenocarcinoma, indicating that mechanistic and clinically useful insights can emerge from studies of transcription factors bound to silent genes.
Results
FoxA2 genomic location analysis
To identify FoxA2 occupied sites at active and inactive genes relevant to endoderm-derived tissue in the adult liver, we designed a high-density tiling microarray covering 210 genes related to endoderm, liver, pancreas, lung, gut, signaling, and cancer (Table S1 and Figure S1A). Each tiled locus included the coding region and its flanking 30 kb upstream and 10 kb downstream sequence, tiled at a density of one 50-nucleotide probe every 24 bp. For regions containing multiple genes of interest, we included larger intergenic regions, such that the final coverage of each of the selected loci ranged from 45–350 kb (Figure S1B). In aggregate, the “endoderm array” covered 14 Mb or 0.5% of the mouse genome. The arrays were masked for repeat sequences.
Next, we isolated chromatin from adult mouse livers which were perfused with formaldehyde in situ [29] and sheared to 50–300 bp (Figure S1C). ChIP-qPCR assays with a FoxA2 antibody, comparing liver (FoxA2+) and kidney (FoxA2-) confirmed the antibody specificity (Figure S1D). We pooled the DNA recovered from triplicate immunoprecipitations, amplified the material by ligation-mediated PCR (Figure S1E), and then labeled the DNA and hybridized it to the endoderm array. We performed three competitive hybridizations: FoxA2 ChIP vs. IgG ChIP, FoxA2 ChIP v.s input DNA, and IgG ChIP vs. input DNA. The resulting hybridization signals were analyzed to locate significant sites of FoxA occupancy using a sliding-window based approach similar to MAT [30] and yielded a set of 193 FoxA2 bound sites on the array (p<0.0001; Figure S2A, S2B, red arrows, and Table S2). We tested 33 sites spanning the range of significant scores (putative FoxA2 positive sites) and 35 sites with insignificant scores (putative FoxA2 negative sites) by locus-specific ChIP-qPCR from independent mouse livers. We observed a high concordance between positive regions from ChIP-chip and FoxA2 occupancy from locus-specific ChIP (Figure S2D, S2E) demonstrating the quality of our bound FoxA2 site assignments (specificity = 90%, sensitivity = 81%). Further de novo motif analysis of FoxA2 occupied sites revealed an extended in vivo derived FoxA consensus sequence that closely matches the TRANSFAC FoxA motif (Figure S2F). In addition, the sequences near the ChIP-chip defined FoxA2 sites showed a much higher degree of local sequence conservation among vertebrates, compared to distal flanking sequences and random loci without ChIP signals (Figure S2G), suggesting that the ChIP-chip defined regions represent elements under strong purifying selection, with possible function. Finally, we compared our peak assignments to those seen in two subsequent whole genome studies [28], [31]. Of their peaks that were covered by our endoderm array, 86% and 90% overlapped with our hybridization probes that gave us at least a 2-fold enrichment of FoxA2 signal over input. Taken together, we generated a high quality set of FoxA2 target sites in adult liver for further analysis.
FoxA occupancy at silent targets
We quantitatively assessed the relationship between FoxA occupancy and gene activity using Taqman-low-density arrays on 86 of our ChIP-chip positive FoxA target genes, spanning the range of FoxA binding, with liver RNA. Using this information, we partitioned genes that were below one ten-thousandth of alb1 (albumin) expression as weak or silent. By this classification system, 56 genes were highly expressed and 30 genes were weak or silent, demonstrating that FoxA2 clearly occupies transcriptionally silent loci (Figure S3A). Notably, we observed little correlation between the level of gene activity and extent of FoxA occupancy, as measured by ChIP-qPCR of individual genes (Figure 1A). However, FoxA2 binding within 5 kb of the transcriptional start is more frequently associated with active genes under our classification system, whereas more distal elements were equally associated with active or inactive genes (Figure S2B). Taken together, FoxA binds to silent genes in the adult liver, often through distal regulatory elements, as has been observed in other cell types [19].

As an independent metric of gene activity, we performed ChIP against the initiating form of Pol II (ser5-P) and assessed factor occupancy at a set of FoxA target genes covering a broad range of gene expression levels. At each gene we queried for Pol II occupancy at the FoxA target site and at the gene promoter. These sites were ranked by occupancy of active Pol II and tested for occupancy of both FoxA1 and FoxA2 (Figure 1B). We found that there was little correlation between the distribution of Pol II occupancy and the distribution of FoxA occupancy (correlation = 0.1); whereas there was good concordance between gene activity measured by Pol II occupancy and RNA expression (correlation = 0.8). Indeed FoxA was strongly bound to genes that are silent by mRNA expression (Figure 1A) and the absence of pol II (Figure 1B), such as at the Cdx2 gene. We also found that FoxA1 and FoxA2 have a remarkably similar occupancy distribution (Figure 1B), suggesting that the factors share a large set of in vivo binding sites. We conclude that FoxA1 and FoxA2 can redundantly occupy a large set of target sites at both active and silent genes in the liver.
Transcription factors co-associated with FoxA at silent genes
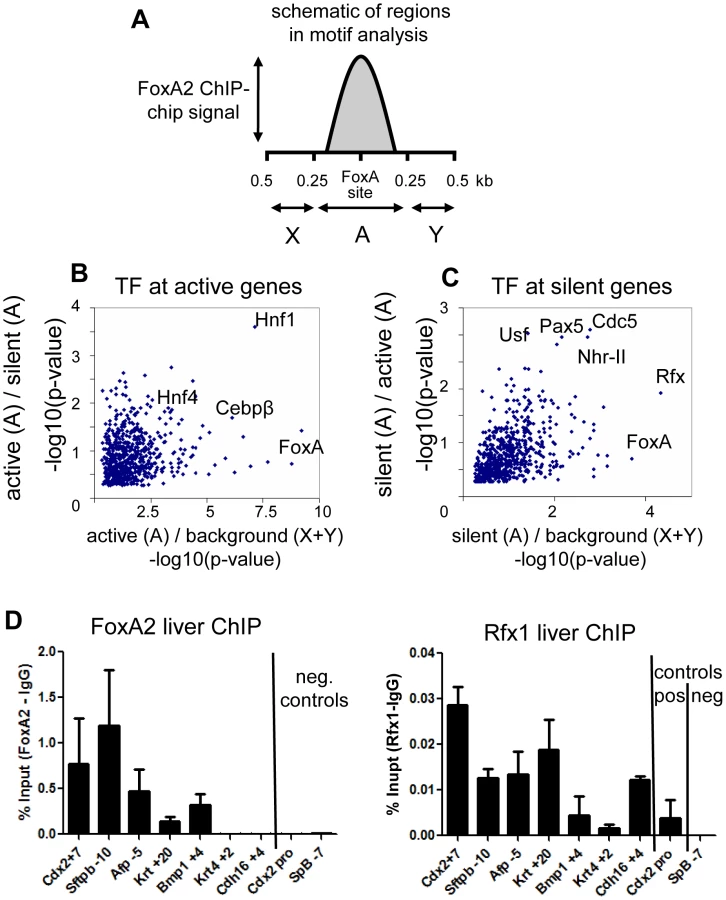
To understand how factors co-bound at silent genes could modulate FoxA activity, we performed motif analysis to identify transcription factors which segregate with FoxA at active versus silent genes. This was facilitated by the resolution our tiling analysis, which allowed the direct identification of FoxA binding sites (Figure S2F). We screened 673 TRANSFAC/JASPAR vertebrate motifs of known transcription factors at FoxA targets in two dimensions (see Materials and Methods). In the first dimension, we identified motifs enriched near FoxA bound sites compared to adjacent unoccupied sequences (Figure 2A–2C). In the second dimension, we identified motifs enriched near active FoxA sites compared to silent FoxA sites (Figure 2B), or vice versa (Figure 2C). At active genes there was an enrichment of transcription factor motifs known to be important for liver-specific gene expression, including HNF4a, C/EBP, and HNF1 (Figure 2B) [32], [33]. In contrast, the transcription factor motifs enriched at silent genes included those for Rfx (motif M00975), type II nuclear hormone receptors (motif M00964), USF (motif M00217), PAX5 (motif M00143), and CDC5 (motif M00478) (Figure 2C). The Rfx factors are a family of transcriptional repressors conserved from yeast to mammals, with seven members in mammals [34], [35]. Rfx1 is expressed in most cells, including in the liver, and has been identified as the Rfx family member most functionally related to the yeast repressor Crt1 [35]. We tested a subset of sites identified by bioinformatics analysis and used ChIP-qPCR to confirm co-occupancy of FoxA2 and Rfx1 at 5 of 7 sites tested (Figure 2D), compared to a negative site control. This suggested a model where the intrinsically positive action of FoxA at silent genes could be counterbalanced by a repressive action of Rfx1.
Novel enhancer at the Cdx2 locus
To investigate the regulatory interactions between FoxA and Rfx at silent genes, we focused on Cdx2 as a candidate gene. Cdx2 is transcriptionally silent in the liver both based on its lack of mRNA expression and lack of Pol II occupancy at its promoter (see Figure 1A and 1B). Cdx2 is ectopically expressed in various pathologic conditions, including Barrett's esophagus and biliary cancer [24]–[26], so understanding its regulation is clinically relevant. Our ChIP-chip analysis revealed a strong peak of FoxA2 at a previously uncharacterized element 7 kb downstream of the Cdx2 transcription start site (TSS) (Figure 3A; see 'FoxA/Input" track; bracketed region). This new element contains a 156 bp sequence which exhibits greater than 78% sequence conservation from mammals to birds and extends to about 500 bp overall (Figure 3B and data not shown). Within this conserved region there is an 83 bp sequence containing two FoxA sites, an Rfx site, and a direct repeat consensus (DR1) for type II NHRs [36]–[39].

Previous work showed that the Cdx2 promoter and upstream regulatory sequences are sufficient to drive expression in colon cells [40]–[42], so we sought to similarly assess the in vivo function of the FoxA-bound conserved element 7 kb downstream of Cdx2. Endogenous Cdx2 is initially expressed in the caudal region of the embryo both in the distal gut tube and in the unsegmented parasomitic mesoderm, and by day 12.5 of embryonic development, Cdx2 expression is largely restricted to the developing gut tube [21], [22], [41]. We made stable transgenic mice containing a nuclear β-galactosidase reporter driven by a 500 bp fragment spanning the Cdx2 +7 kb element (LacZ-wt) or the Cdx2 +7 kb element with both FoxA sites mutated (LacZ-ΔFoxA). When tested in E12.5 embryos, the LacZ-wt reporter line exhibited punctate nuclear LacZ staining beginning in the colon and extending caudally to the stomach, where scattered cells were positive (Figure 3C). We did not observe LacZ staining in the gut tube anterior to the stomach, nor was staining visible in the liver or the lung, mimicking the endogenous Cdx2 pattern. However, the transgene did express LacZ in other embryonic tissues, perhaps due to position effects (data not shown). In contrast, two independent LacZ-ΔFoxA lines containing the same transgenic sequences, except for clustered point mutations of the FoxA sites, failed to express LacZ in the gut (Figure 3D) but retained non-specific expression (data not shown). These results demonstrated that the Cdx2 +7 kb element is a weak tissue-specific enhancer that is dependent upon FoxA binding sites for activity in developing embryos.
Rfx sites restricting Cdx2 +7 kb enhancer function
We next sought to determine the role of the Rfx sites in the regulation of the Cdx2 +7 kb element. Upon scanning endogenous Cdx2 expression levels in cell lines, we found that HepG2 liver carcinoma cells [43] express very low Cdx2 levels compared to the Caco2 colon cancer line or mouse colon; though the gene was expressed about 10-fold above the negative background seen in liver (Figure 4A). Still, ChIP of the conserved +7 kb element (Figure 3B) in HepG2 cells showed strong FoxA and Rfx1 binding, as seen in mouse liver (Figure 2D), compared to a negative control site (Figure 4B).

We then created a series of luciferase reporter constructs with a wild type copy of the 500 bp+7 kb element, as well as variant elements with clustered mutations of the FoxA or Rfx sites, inserted downstream of the reporter (Figure 4C). In three independent HepG2 transfection experiments, each quantified in duplicate, the wild-type Cdx2 +7 kb enhancer elicited a ten-fold greater activity than the control plasmid in HepG2 cells (Figure 4C, “wt Cdx2 +7 kb”). Mutation of the FoxA sites resulted in loss of enhancer activity (Figure 4B, “FoxA mut”), consistent with our results in transgenic mice. Strikingly, mutation of the Rfx site resulted in an increase in reporter activity, compared to the wild type element, demonstrating that factors that bind the site repress the Cdx2 enhancer (Figure 4B, “Rfx1 mut”). Simultaneous mutation of both the Rfx and FoxA sites resulted in a loss of enhancer activity, indicating that FoxA binding is necessary for the cryptic activity when the Rfx1 site is lost. Using Cdx2 as a representative, we suggest that FoxA is able to functionally engage a silent or very poorly expressed gene and that its potential stimulatory effect on gene activity can be attenuated by Rfx1-mediated repression.
Progressive Rfx1 loss in esophageal adenocarcinoma
Inappropriate activation of Cdx2 is one of the initiating events in the progression of normal esophageal mucosa to the development of Barrett's esophagus [24]–[26], where esophageal cells form columnar cells that morphologically resemble those of the intestinal epithelium. Patients with Barrett's esophagus are at increased risk to develop dysplastic Barrett's esophagus and then esophageal adenocarcinoma [44]. Since we found that Rfx1 is a negative regulator of the Cdx2 +7 element, we wanted to determine if Rfx1 levels change during the progression from normal human esophageal mucosa to the development of esophageal adenocarcinoma. Accordingly, we performed immunohistochemistry on tissue microarrays containing anonymized patient-derived samples from the normal glandular mucosa at the gastro-esophageal junction (n = 5), Barrett's esophagus (n = 11), dysplastic Barrett's (n = 6), and invasive esophageal adenocarcinoma (n = 20) (Figure 5A–5H). The dysplastic Barrett's samples were from patients who had already developed esophageal adenocarcinoma. We confirmed antibody specificity by staining adjacent sections with Rfx1 antibody alone or in the presence of blocking epitope peptide, and observed a loss of positive nuclear staining in the presence of blocking peptide in both the epithelial and stromal cells (Figure S4). In addition, we stained contiguous serial sections for Cdx2.

In the normal glandular epithelium of the gastro-esophageal junction, we found that Rfx1 is expressed in the nuclei of the epithelial cells lining the esophageal lumen (luminal epithelium; not shown) and the deeper secretory portions of the glandular epithelium (Figure 5A, "E", arrows). We also observed Rfx1 positive nuclei in the surrounding stromal cells (Figure 5A, “S”, arrowhead). In nearby sections, Cdx2 expression was either very sparse or undetectable (Figure 5B). We conclude that Rfx1 is expressed in normal gastroesophageal junction-glandular tissue, whereas Cdx2 expression is marginal or non-existent. In Barrett's esophagus, comparing expression from 11 samples (Table 1), there was a qualitative but not statistically significant decrease in the percentage of Rfx1 positive nuclei in comparison to normal samples (p≤0.12) (Figure 5C, 5I; “E”, arrows). Cdx2 was activated in many of the Barrett's samples (Figure 5D, 5I). However, as noted previously [24]–[26], in Barrett's esophagus with dysplasia and in esophageal adenocarcinoma, the percent of Cdx2 positive cells declined in most samples, but was persistent in others (Figure 5F, 5H, 5I).

By contrast, in samples of Barrett's esophagus with dysplasia, we found a more marked, statistically significant decrease in the percentage of Rfx1 positive nuclei in epithelial cells (p ≤0.0001) (Figure 5E, 5I, arrows; Table 1), whereas the stromal cells retained Rfx1 expression. The percentage of Rfx1 positive nuclei in adenocarcinoma also decreased relative to normal esophageal tissue, with virtually no staining of the epithelial cells in 18 of 20 samples (p≤0.0001) (Figure 5G, 5I; Table 1) and sporadic staining of the stroma. To confirm these data, we performed Western blot analysis on a nuclear lysate from the H520 human cancer cell line (positive control) and on cell lysates from six anonymized, esophageal adenocarcinoma samples. The blots were also probed to GAPDH to confirm protein loading. As seen in Figure S5, only the positive control cell line exhibited Rfx1 expression, suggesting consistent down-regulation of Rfx1 in the tumor samples. Thus, we conclude that Rfx1 expression in the esophageal epithelium is very frequently lost during the progression to esophageal adenocarcinoma, and its loss appears to be a more reliable marker of cancer progression than the up-regulation and then down-regulation of Cdx2 (Figure 5I).
To assess the functional consequences of Rfx1 loss in nontransformed esophageal epithelial cells, we performed siRNA knockdown of Rfx1 in a mouse esophageal keratinocyte (MEK) cell line [45]. The MEK line is derived from the basal cell layer of the squamous epithelium lining the esophagus, proximal to the gastro-esophageal junction [45]. The basal cells of squamous epithelia characteristically express high levels of Sox2 and cytokeratin CK14 [46]. siRNA experiments in these and other cells led to, at best, a 50% reduction in Rfx1 gene expression levels (Figure 6A). The inability to obtain better knock-down seems likely due to Rfx1 autoregulation (repression) of its own promoter [35]. Thus, as the factor's mRNA is knocked down, its gene's transcription would go up. Under our best Rfx1 knock-down conditions, we did not observe induction of Cdx2 expression (data not shown), indicating that the 50% loss of Rfx1 is insufficient for Cdx2 activation. Notably, though, upon Rfx1 knock-down we observed a 50% decrease in the CK14 and Sox2 mRNA levels (Figure 6). These findings demonstrate that Rfx1 helps maintain the expression of genes, presumably indirectly, that contribute to MEK cell differentiation. Taken together with our observation that there is a marked decrease of Rfx1 expression in the epithelium of Barrett's esophagus with dysplasia, our findings suggest that Rfx1 helps control the maintenance of the squamous epithelial cell identity in the esophagus and hence antagonizes dysplasia.

Role of Type II Nuclear Hormone Receptor motif at the +7 kb Cdx2 enhancer
The autoregulation of Rfx1 (35) and inefficiency of siRNA knockdown led us to investigate other parameters affecting the activity of the +7 kb Cdx2 enhancer. There are a large number of type II nuclear hormone family members which can bind to DR1 motifs, such as those seen at Cdx2 (Figure 3B). Type II nuclear hormone receptors (NHR-II), formerly orphan receptors, are a class of transcription factors whose activating ligands are metabolic products, such as bile acids [47], and that function as repressors in the absence of ligand [48]. Indeed, bile acids and acidic culture conditions can cause ectopic expression of Cdx2 [49]. Since type II nuclear hormone receptors form obligate heterodimers with RXR, we performed ChIP against RXR in HepG2 cells. We observed RXR enrichment at the Cdx2 +7 kb element as compared to a control site in the TTF1 gene (Figure 7A). The extent of RXR enrichment at the Cdx2 +7 kb element was similar to that at the Cyp7a1 promoter, which contains a known type II nuclear hormone receptor binding site [50], [51]. Furthermore, mutation of the NHR-II site in the Cdx2 +7 kb enhancer resulted in a clear increase in enhancer activity, comparable to that seen with the Rfx1 mutation (Figure 7B). However, we were not able to identify the heterodimeric receptor partner for RXR at the NHR-II element in HepG2 and other cell contexts, and the effects of bile acids on the activity of the Cdx2 +7 kb element in HepG2 and MEK cells were inconsistent. Regardless, the repressive role of the NHR-II site emphasizes the redundant nature of repression of Cdx2 and the likely multistep nature required for ectopic gene activation. Furthermore, RXR at the repressive NHR-II domain of the +7 kb enhancer demonstrates how the FoxA pioneer factor bound to silent genes can be restrained by different types of transcriptional repressors.

Discussion
In contrast to other genomic studies of transcription factor occupancy at active genes, here we focused on the interactions of FoxA with silent target genes. Such an approach allowed us to identify an element near the silent Cdx2 gene as a cryptic FoxA target. This is notable because Cdx2 is activated during esophageal metaplastic changes, thereby facilitating, in a percentage of cases, the progression towards adenocarcinoma development [24]–[26], [52]. We employed a two-dimensional motif analysis to identify transcription factors which may function with FoxA at silent genes like Cdx2. By this approach, we found that the repressor Rfx1 can restrict the activation of the cryptic FoxA target sequence. We suggest that FoxA occupancy of silent genes in differentiated tissues can endow the competence of such genes to be activated aberrantly and may contribute to human disease. Indeed, FoxA1 has been implicated as a tumor promoting factor [53], [54] and is upregulated in a subset of esophageal cancers as a result of genomic amplification [55]. In our studies, partial knock-down of Rfx1 was insufficient to alter FoxA1 levels (data not shown).
We observed a marked and statistically significant decrease in the levels of Rfx1 expression in Barrett's esophagus with dysplasia and in esophageal adenocarcinoma. Since most Barrett's esophagus lesions do not become dysplastic, it is useful to possess markers that are indicative of the dysplastic transition. We therefore suggest that Rfx1 loss will function as such a marker, and more reliably so than the induction of Cdx2 in earlier stage Barrett's and then its variable down-regulation during progression [24]–[26]. Indeed, recent experiments suggest that Cdx2 plays a relatively early role during progression [56], [57], and thus its expression pattern may be less informative for the later stages. With regard to the small fraction of adenocarcinomas that retain Rfx1 expression, we suggest that either Rfx1 loss is not absolutely necessary for such progression or, like many other genes that are involved with cancer, the samples could, for example, contain point mutations that are not reflected in changes in protein abundance. Many well-known cancer markers appear in a frequency comparable to or less than those in our initial studies of Rfx1. For example, a meta-analysis showed that K-ras mutations progress from an occurrence in 36–44% of early stage pancreatic neoplasias to 87% in later stage cancers [58]. Mutations in p53 occur in frequencies of 25–80% in various cancers tested [59] and mutation in APC occur in up to 83% of colorectal tumors tested [60]; in both cases using tissue sample numbers comparable to those used here. Given the difficulties in qualitative assessment of tissue morphology, specific molecular markers such as Rfx1 can be of high utility in the diagnosis of cancer and its precursors.
Further studies are required to assess whether Rfx1 has a direct tumor suppressive role in the esophageal epithelium. Rfx1 functions genetically downstream of ATR and contributes to the DNA damage response and stalled DNA replication [35]. In response to DNA damage, Rfx1 binding to DNA is lost, leading to the activation of many of its target genes, such as its own promoter and the ribonucleotide reductase gene [35]. Rfx1 also binds the genes for PCNA and c-Myc, thus loss of Rfx1 binding or expression could promote increased cell proliferation [34], [61], [62]. Rfx1 expression was found to be down-regulated in gliomas as a result of promoter methylation and the reintroduction of Rfx1 in transfected glioma cells resulted in decreased cell proliferation, suggesting that Rfx1 may play a role as a tumor suppressor in glioma tumorigenesis [63]. Given these extensive activities of Rfx1 in cell growth and oncogenesis, our discovery of the gradual loss of Rfx1 expression in the progression to esophageal adenocarcinoma suggests that the factor has a functional role in that context. Considering the poor clinical prognosis of esophageal adenocarcinoma [64], Rfx1 down-regulation during progression to adenocarcinoma may be a useful new marker of cancer development. Mechanistically, Rfx1 is a winged helix factor [65], [66] and therefore, like FoxA, could be normally bound to silent chromatin by virtue of intrinsic chromatin binding properties.
By taking a genomic view of FoxA occupancy and focusing our analysis on the interactions at silent target genes, we have uncovered novel gene regulatory interactions at a cryptic enhancer. We found that the +7 kb Cdx2 enhancer weakly recapitulates part of the developmental activity of the upstream promoter region (Figure 3C), but only the +7 kb element binds FoxA in liver cells, not the Cdx2 promoter (Figure 3A). We suggest that the +7 kb element functions as a shadow enhancer, similar to those recently discovered in Drosophila [67], [68]. As an additional regulatory element at a gene, possibly arising by sequence duplication, a shadow enhancer may ensure a more precise gene expression pattern in development or allow a new regulatory function to evolve, while other regulatory elements maintain crucial regulatory functions. Although the normal function of the Cdx2 +7 kb element, if any, is not clear, binding by FoxA factors appears crucial for cryptic activation. The stringency with which FoxA is held in check is revealed by there being two nearby, repressive factor binding sites for Rfx and NHR-II.
Given that the genome appears to contain an abundance of cryptic regulatory elements [69], we suggest that our approach to investigating factor occupancy at silent genes will reveal the potential for other genetic programming transitions that are rare but can contribute to the basis for devastating human diseases.
Materials and Methods
Ethics statement
All work with animals for this study was performed in accordance with an approved IACUC protocol and relevant national guidelines. No animal survival studies were performed.
Tiled array fabrication
Selected 210 genes of interest, and included 30 kb upstream and 10 kb downstream of the gene boundaries bases on UCSC Mouse Genome Browser, March 2005 build. Custom microarray containing 50mer probes with 24 bp overlap. Repetitive elements were masked. The final array contained 380,000 features. (Nimblegen). A list of the gene regions probed is provided in Table S1.
Chromatin immunoprecipitation
Mouse livers from C3H strain, were crosslinked by perfusion through the portal vein and nuclei were isolated as described in [29]. Nuclei were resuspended in liver sonication buffer (50 mM Tris, 2 mM EDTA, 0.5% N-laurylsarcosine, 50 mM PMSF, protease inhibitors) held on ice for 5 min, then sheared in a bath sonicator (Diagenode Bioruptor) for 10 min with 30 sec ON/OFF intervals. RNAse was added to 40 ng/ml and chromatin was dialyzed to TE overnight 4°C, DNA was quantitated, and adjusted to 50 µg per ChIP reaction in 1X RIPA buffer. Immune complexes formed overnight at 4°C, and were recovered with 40 µl 50% pre-cleared protein A beads for 2 hr at 4°C. Beads were washed 6 times with high salt RIPA and eluted twice with 100 µl elution buffer (1% SDS, 0.1 M sodium bicarbonate) at 42°C. Protein-DNA crosslinks were reversed overnight at 68°C, and DNA was recovered by phenol-chloroform extraction followed by ethanol precipitation and resuspension in dH20. For locus specific ChIP, enrichment was quantitated by standard curve analysis using SYBR Green QPCR (iCycler, BIO-RAD). A list of oligonucleotides used for ChIP-qPCR is provided in Table S3. For ChIP-chip analysis three competitive hybridizations were performed (FoxA2 vs IgG, FoxA2 vs input DNA, IgG vs input DNA). LM-PCR and DNA hybridization were performed per Nimblegen protocol. For cultured cells, ChIP was performed as described by Odom et al 2004. Sonication and immunoprecipitation performed as described for liver. Antibodies: FoxA2 (Upstate 07-633), Pol II phospho serine5 (Covance MMS-134R), IgG (Upstate), rabbit serum (Sigma), FoxA1 [29] and (Chemicon AB4124), Rfx1 (Santa Cruz sc-48809).
Bioinformatics methods
To detect FoxA2 occupied regions or ChIP regions, we apply sliding-window method adapted from MAT [30] to the log-ratio intensities. For each window of a specific size w, a score is calculated, where xi is the intensity of each probe in the window, and n is the number of probes in the window. The T-scores follow symmetric and asymptotically a normal distribution, therefore, the negative T-scores were used to estimate the empirical null distribution and p-values. Significant windows that are nearby each other, with a distance smaller than a specified gap size g, were merged, and the best T-score among them and the associated p-value were reported. We optimized the three parameters, window size w and gap size g, and p-value p, using a small subset of positive and negative controls. The reported results were obtained using w = 400 nt, g = 100 nt, and p = 0.0001. A region is called significant if p<0.0001 in the hybridization of either FoxA2 vs. IgG or FoxA2 vs. input DNA. We estimate an FDR of 16%, using the control hybridization of IgG vs. input DNA. To identify the motifs significantly enriched in the ChIP regions, we use 500-nt sequences centered in each ChIP region, and upstream/downstream sequences of the same size as background. We scan all 673 matrices of vertebrate transcription factors from TRANSFAC (Matys 2003) and JASPAR [70], by comparison occurrences of each matrix in ChIP and background datasets. The significance of enrichment in the ChIP regions was evaluated by a Binomial distribution, and the threshold of motif scores was optimized to maximize the enrichment. This analysis was performed using the motifclass program in the CREAD package (http://rulai.cshl.edu/cread/).
Gene expression analysis
RNA was isolated using TRIzol reagent (Invitrogen) or RNeasy kit (QIAgen). 1 µg of RNA was converted to cDNA using iScript cDNA Synthesis kit (BIO-RAD.) and gene expression assessed by SYBR green QPCR using iCycler (BIO-RAD) or by TAQman low density arrays on an PRISM machine (Applied Biosystems.) Gene expression determined by the delta Ct method using HPRT as a reference. A list of Taqman probe IDs is provided in Table S4.
Luciferase assays
Enhancer elements were PCR amplified and TOPO TA cloned (Invitrogen). Binding site mutations were introduced by overlap-extension PCR and constructs were sequence verified. Enhancer elements were subcloned into pGL3-promoter vector (Promega) downstream of the luciferase reporter gene. Cells were cultured in 6-well dishes and co-transfected with 1250 ng pGL3 vector and 125 ng pRL-CMV with Fugene reagent (Invitrogen). 72-hrs after transfection cells were lysed and luciferase activity was measured with the Dual-luciferase kit (Promega) per manufacturer's instructions.
Histopathology and immunohistochemistry
We studied a tissue microarray containing 44 one millimeter cores from 22 anonymized esophageal mucosa samples, including 5 normal mucosa samples, from the gastroesophageal junction and 17 Barrett's esophagus lesions (11 Barrett's without dysplasia and 6 Barrett's with dysplasia). In addition, a total of twenty esophageal well differentiated invasive adenocarcinoma samples from the archives of FCCC were used. Paraffin sections were dewaxed using xylenes and hydrated using a series of ethanol. No antigen retrieval methods were necessary. Endogenous peroxidases were quenched with a short treatment of 1% hydrogen peroxide. Sections were incubated overnight with primary antibodies, washed the next day with PBS, incubated with biotinylated secondary antibodies (Vector Labs), incubated with Vecta Elite ABC kit (Vector Labs), developed with a DAB kit (Vector Labs) and counterstained with hematoxylin. Specimens were documented photographically using a Nikon Optiphot microscope, equipped with an Optronics CCD camera. Antibody against Rfx1 (Santa Cruz sc-10652) was used at a dilution of 1/50. Negative controls were incubated in the absence of primary antibodies as well as using a specific blocking peptide (Santa Cruz sc-10652 P) previously incubated together with the primary antibody at a concentration ten times higher than the latter. The percent of positively stained nuclei in normal and abnormal esophageal epithelium was determined by counting directly a total of 300–600 cells per sample (in at least three random fields per sample) using a micrometric eyepiece grid at a magnification of 400X.
siRNA experiments
Smart pools (Dharmacon control siRNA D-001206-14-20; Rfx1 M-058841-01-0020) were added to cells in 6 cm dishes at 50 nM concentration using RNAifect (QIAGEN) per manufacturer's instruction. Cells were harvested for protein and RNA analysis 3 days post-transfection.
Accession codes
Microarray data has been deposited to the NCBI GEO database.
Supporting Information
Zdroje
1. BerkesCABergstromDAPennBHSeaverKJKnoepflerPS 2004 Pbx marks genes for activation by MyoD indicating a role for a homeodomain protein in establishing myogenic potential. Mol Cell 14 465 477
2. DeckerTPasca di MaglianoMMcManusSSunQBoniferC 2009 Stepwise activation of enhancer and promoter regions of the B cell commitment gene Pax5 in early lymphopoiesis. Immunity 30 508 520
3. HoogenkampMLichtingerMKrysinskaHLancrinCClarkeD 2009 Early chromatin unfolding by RUNX1 - a molecular explanation for differential reqduring specification versus maintenance of the hematopoietic gene expression program. Blood Journal online prepublished
4. LangDLuMMHuangLEnglekaKAZhangM 2005 Pax3 functions at a nodal point in melanocyte stem cell differentiation. Nature 433 884 887
5. YuLMorseRH 1999 Chromatin opening and transactivator potentiation by RAP1 in Saccharomyces cerevisiae. Mol Cell Biol 19 5279 5288
6. ZaretK 1999 Developmental competence of the gut endoderm: genetic potentiation by GATA and HNF3/fork head proteins. Devel Biol 209 1 10
7. SlackJM 2007 Metaplasia and transdifferentiation: from pure biology to the clinic. Nat Rev Mol Cell Biol 8 369 378
8. KaestnerKH 2005 The making of the liver: developmental competence in foregut endoderm and induction of the hepatogenic program. Cell Cycle 4 1146 1148
9. KaestnerKHHiemischHLuckowBSchutzG 1994 The HNF-3 gene family of transcription factors in mice: gene structure, cDNA sequence, and mRNA distribution. Genomics 20 377 385
10. AngS-LRossantJ 1994 HNF-3β is essential for node and notochord formation in mouse development. Cell 78 561 574
11. AngS-LWierdaAWongDStevensKACascioS 1993 The formation and maintenance of the definitive endoderm lineage in the mouse: involvement of HNF3/forkhead proteins. Development 119 1301 1315
12. WeinsteinDCRuiz i AltabaAChenWSHoodlessPPreziosoVR 1994 The winged-helix transcription factor HNF-3β is required for notochord development in the mouse embryo. Cell 78 575 588
13. LeeCSFriedmanJRFulmerJTKaestnerKH 2005 The initiation of liver development is dependent on Foxa transcription factors. Nature 435 944 947
14. BossardPZaretKS 1998 GATA transcription factors as potentiators of gut endoderm differentiation. Development 125 4909 4917
15. BossardPZaretKS 2000 Repressive and restrictive mesodermal interactions with gut endoderm: possible relation to Meckel's Diverticulum. Development 127 4915 4923
16. GualdiRBossardPZhengMHamadaYColemanJR 1996 Hepatic specification of the gut endoderm in vitro: cell signaling and transcriptional control. Genes Dev 10 1670 1682
17. CirilloLLinFRCuestaIJarnikMFriedmanD 2002 Opening of compacted chromatin by early developmental transcription factors HNF3 (FOXA) and GATA-4. Molecular Cell 9 279 289
18. CarrollJSLiuXSBrodskyASLiWMeyerCA 2005 Chromosome-wide mapping of estrogen receptor binding reveals long-range regulation requiring the forkhead protein FoxA1. Cell 122 33 43
19. LupienMEeckhouteJMeyerCAWangQZhangY 2008 FoxA1 translates epigenetic signatures into enhancer-driven lineage-specific transcription. Cell 132 958 970
20. YuXGuptaAWangYSuzukiKMirosevichJ 2005 Foxa1 and Foxa2 interact with the androgen receptor to regulate prostate and epididymal genes differentially. Ann N Y Acad Sci 1061 77 93
21. BeckFErlerTRussellAJamesR 1995 Expression of Cdx-2 in the mouse embryo and placenta: possible role in patterning of the extra-embryonic membranes. Dev Dyn 204 219 227
22. SilbergDGSwainGPSuhERTraberPG 2000 Cdx1 and cdx2 expression during intestinal development. Gastroenterology 119 961 971
23. GaoNWhitePKaestnerKH 2009 Establishment of intestinal identity and epithelial-mesenchymal signaling by Cdx2. Dev Cell 16 588 599
24. EdaAOsawaHSatohKYanakaIKihiraK 2003 Aberrant expression of CDX2 in Barrett's epithelium and inflammatory esophageal mucosa. J Gastroenterol 38 14 22
25. MoonsLMBaxDAKuipersEJVan DekkenHHaringsmaJ 2004 The homeodomain protein CDX2 is an early marker of Barrett's oesophagus. J Clin Pathol 57 1063 1068
26. PhillipsRWFriersonHFJrMoskalukCA 2003 Cdx2 as a marker of epithelial intestinal differentiation in the esophagus. Am J Surg Pathol 27 1442 1447
27. BochkisIMRubinsNEWhitePFurthEEFriedmanJR 2008 Hepatocyte-specific ablation of Foxa2 alters bile acid homeostasis and results in endoplasmic reticulum stress. Nat Med 14 828 836
28. WederellEDBilenkyMCullumRThiessenNDagpinarM 2008 Global analysis of in vivo Foxa2-binding sites in mouse adult liver using massively parallel sequencing. Nucleic Acids Res 36 4549 4564
29. ChayaDHayamizuTBustinMZaretKS 2001 Transcription factor FoxA (HNF3) on a nucleosome at an enhancer complex in liver chromatin. J Biol Chem 276 44385 44389
30. JohnsonWELiWMeyerCAGottardoRCarrollJS 2006 Model-based analysis of tiling-arrays for ChIP-chip. Proc Natl Acad Sci U S A 103 12457 12462
31. TutejaGWhitePSchugJKaestnerKH 2009 Extracting transcription factor targets from ChIP-Seq data. Nucleic Acids Res 37 e113
32. KrivanWWassermanWW 2001 A predictive model for regulatory sequences directing liver-specific transcription. Genome Res 11 1559 1566
33. KyrmiziIHatzisPKatrakiliNTroncheFGonzalezFJ 2006 Plasticity and expanding complexity of the hepatic transcription factor network during liver development. Genes Dev 20 2293 2305
34. LiuMLeeBHMathewsMB 1999 Involvement of RFX1 protein in the regulation of the human proliferating cell nuclear antigen promoter. J Biol Chem 274 15433 15439
35. LubelskyYReuvenNShaulY 2005 Autorepression of rfx1 gene expression: functional conservation from yeast to humans in response to DNA replication arrest. Mol Cell Biol 25 10665 10673
36. AnisfeldAMKast-WoelbernHRMeyerMEJonesSAZhangY 2003 Syndecan-1 expression is regulated in an isoform-specific manner by the farnesoid-X receptor. J Biol Chem 278 20420 20428
37. FeltkampDWiebelFFAlbertiSGustafssonJA 1999 Identification of a novel DNA binding site for nuclear orphan receptor OR1. J Biol Chem 274 10421 10429
38. FrankCMakkonenHDunlopTWMatilainenMVaisanenS 2005 Identification of pregnane X receptor binding sites in the regulatory regions of genes involved in bile acid homeostasis. J Mol Biol 346 505 519
39. LaffitteBAKastHRNguyenCMZavackiAMMooreDD 2000 Identification of the DNA binding specificity and potential target genes for the farnesoid X-activated receptor. J Biol Chem 275 10638 10647
40. BenahmedFGrossIGauntSJBeckFJehanF 2008 Multiple regulatory regions control the complex expression pattern of the mouse Cdx2 homeobox gene. Gastroenterology 1238 1247 e1231–1233
41. GauntSJDrageDTrubshawRC 2005 cdx4/lacZ and cdx2/lacZ protein gradients formed by decay during gastrulation in the mouse. Int J Dev Biol 49 901 908
42. HinoiTAkyolATheisenBKFergusonDOGreensonJK 2007 Mouse model of colonic adenoma-carcinoma progression based on somatic Apc inactivation. Cancer Res 67 9721 9730
43. KnowlesBBHoweCCAdenDP 1980 Human hepatocellular carcinoma cell lines secrete the major plasma proteins and hepatitis B surface antigen. Science 209 497 499
44. WestonAPBadrASHassaneinRS 1999 Prospective multivariate analysis of clinical, endoscopic, and histological factors predictive of the development of Barrett's multifocal high-grade dysplasia or adenocarcinoma. Am J Gastroenterol 94 3413 3419
45. HaradaHNakagawaHOyamaKTakaokaMAndlCD 2003 Telomerase induces immortalization of human esophageal keratinocytes without p16INK4a inactivation. Mol Cancer Res 1 729 738
46. YuWYSlackJMToshD 2005 Conversion of columnar to stratified squamous epithelium in the developing mouse oesophagus. Dev Biol 284 157 170
47. WangHChenJHollisterKSowersLCFormanBM 1999 Endogenous bile acids are ligands for the nuclear receptor FXR/BAR. Mol Cell 3 543 553
48. HuXLiSWuJXiaCLalaDS 2003 Liver X receptors interact with corepressors to regulate gene expression. Mol Endocrinol 17 1019 1026
49. KazumoriHIshiharaSRumiMAKadowakiYKinoshitaY 2006 Bile acids directly augment caudal related homeobox gene Cdx2 expression in oesophageal keratinocytes in Barrett's epithelium. Gut 55 16 25
50. CrestaniMSadeghpourAStroupDGalliGChiangJY 1998 Transcriptional activation of the cholesterol 7alpha-hydroxylase gene (CYP7A) by nuclear hormone receptors. J Lipid Res 39 2192 2200
51. StroupDCrestaniMChiangJY 1997 Orphan receptors chicken ovalbumin upstream promoter transcription factor II (COUP-TFII) and retinoid X receptor (RXR) activate and bind the rat cholesterol 7alpha-hydroxylase gene (CYP7A). J Biol Chem 272 9833 9839
52. ColleypriestBJFarrantJMSlackJMToshD 2010 The role of Cdx2 in Barrett's metaplasia. Biochem Soc Trans 38 364 369
53. EeckhouteJCarrollJSGeistlingerTRTorres-ArzayusMIBrownM 2006 A cell-type-specific transcriptional network required for estrogen regulation of cyclin D1 and cell cycle progression in breast cancer. Genes Dev 20 2513 2526
54. YamaguchiNItoEAzumaSHonmaRYanagisawaY 2008 FoxA1 as a lineage-specific oncogene in luminal type breast cancer. Biochem Biophys Res Commun 365 711 717
55. LinLMillerCTContrerasJIPrescottMSDagenaisSL 2002 The hepatocyte nuclear factor 3 alpha gene, HNF3alpha (FOXA1), on chromosome band 14q13 is amplified and overexpressed in esophageal and lung adenocarcinomas. Cancer Res 62 5273 5279
56. KongJCrisseyMAFunakoshiSKreindlerJLLynchJP 2011 Ectopic Cdx2 expression in murine esophagus models an intermediate stage in the emergence of Barrett's esophagus. PLoS ONE 6 e18280 doi:10.1371/journal.pone.0018280
57. KongJNakagawaHIsariyawongseBKFunakoshiSSilbergDG 2009 Induction of intestinalization in human esophageal keratinocytes is a multistep process. Carcinogenesis 30 122 130
58. LohrMKloppelGMaisonneuvePLowenfelsABLuttgesJ 2005 Frequency of K-ras mutations in pancreatic intraductal neoplasias associated with pancreatic ductal adenocarcinoma and chronic pancreatitis: a meta-analysis. Neoplasia 7 17 23
59. FrankelRHBayonaWKoslowMNewcombEW 1992 p53 mutations in human malignant gliomas: comparison of loss of heterozygosity with mutation frequency. Cancer Res 52 1427 1433
60. RowanAJLamlumHIlyasMWheelerJStraubJ 2000 APC mutations in sporadic colorectal tumors: A mutational "hotspot" and interdependence of the "two hits". Proc Natl Acad Sci U S A 97 3352 3357
61. ChenLSmithLJohnsonMRWangKDiasioRB 2000 Activation of protein kinase C induces nuclear translocation of RFX1 and down-regulates c-myc via an intron 1 X box in undifferentiated leukemia HL-60 cells. J Biol Chem 275 32227 32233
62. ReinholdWEmensLItkesABlakeMIchinoseI 1995 The myc intron-binding polypeptide associates with RFX1 in vivo and binds to the major histocompatibility complex class II promoter region, to the hepatitis B virus enhancer, and to regulatory regions of several distinct viral genes. Mol Cell Biol 15 3041 3048
63. OhashiYUedaMKawaseTKawakamiYTodaM 2004 Identification of an epigenetically silenced gene, RFX1, in human glioma cells using restriction landmark genomic scanning. Oncogene 23 7772 7779
64. PohlHWelchHG 2005 The role of overdiagnosis and reclassification in the marked increase of esophageal adenocarcinoma incidence. J Natl Cancer Inst 97 142 146
65. EmeryPDurandBMachBReithW 1996 RFX proteins, a novel family of DNA binding proteins conserved in the eukaryotic kingdom. Nucleic Acids Res 24 803 807
66. GajiwalaKSChenHCornilleFRoquesBPReithW 2000 Structure of the winged-helix protein hRFX1 reveals a new mode of DNA binding. Nature 403 916 921
67. FrankelNDavisGKVargasDWangSPayreF 2010 Phenotypic robustness conferred by apparently redundant transcriptional enhancers. Nature 466 490 493
68. HongJWHendrixDALevineMS 2008 Shadow enhancers as a source of evolutionary novelty. Science 321 1314
69. ConsortiumEPBirneyEStamatoyannopoulosJADuttaAGuigoR 2007 Identification and analysis of functional elements in 1% of the human genome by the ENCODE pilot project. Nature 447 799 816
70. SandelinAAlkemaWEngstromPWassermanWWLenhardB 2004 JASPAR: an open-access database for eukaryotic transcription factor binding profiles. Nucleic Acids Res 32 D91 94
71. SiepelABejeranoGPedersenJSHinrichsASHouM 2005 Evolutionarily conserved elements in vertebrate, insect, worm, and yeast genomes. Genome Res 15 1034 1050
Štítky
Genetika Reprodukční medicínaČlánek vyšel v časopise
PLOS Genetics
2011 Číslo 9
Nejčtenější v tomto čísle
- Retrotransposon-Induced Heterochromatin Spreading in the Mouse Revealed by Insertional Polymorphisms
- The Evolutionarily Conserved Longevity Determinants HCF-1 and SIR-2.1/SIRT1 Collaborate to Regulate DAF-16/FOXO
- Genome-Wide Analysis of Heteroduplex DNA in Mismatch Repair–Deficient Yeast Cells Reveals Novel Properties of Meiotic Recombination Pathways
- Association of eGFR-Related Loci Identified by GWAS with Incident CKD and ESRD