
Coexpression Network Analysis in Abdominal and Gluteal Adipose Tissue Reveals Regulatory Genetic Loci for Metabolic Syndrome and Related Phenotypes
Metabolic Syndrome (MetS) is highly prevalent and has considerable public health impact, but its underlying genetic factors remain elusive. To identify gene networks involved in MetS, we conducted whole-genome expression and genotype profiling on abdominal (ABD) and gluteal (GLU) adipose tissue, and whole blood (WB), from 29 MetS cases and 44 controls. Co-expression network analysis for each tissue independently identified nine, six, and zero MetS–associated modules of coexpressed genes in ABD, GLU, and WB, respectively. Of 8,992 probesets expressed in ABD or GLU, 685 (7.6%) were expressed in ABD and 51 (0.6%) in GLU only. Differential eigengene network analysis of 8,256 shared probesets detected 22 shared modules with high preservation across adipose depots (DABD-GLU = 0.89), seven of which were associated with MetS (FDR P<0.01). The strongest associated module, significantly enriched for immune response–related processes, contained 94/620 (15%) genes with inter-depot differences. In an independent cohort of 145/141 twins with ABD and WB longitudinal expression data, median variability in ABD due to familiality was greater for MetS–associated versus un-associated modules (ABD: 0.48 versus 0.18, P = 0.08; GLU: 0.54 versus 0.20, P = 7.8×10⁻⁴). Cis-eQTL analysis of probesets associated with MetS (FDR P<0.01) and/or inter-depot differences (FDR P<0.01) provided evidence for 32 eQTLs. Corresponding eSNPs were tested for association with MetS–related phenotypes in two GWAS of >100,000 individuals; rs10282458, affecting expression of RARRES2 (encoding chemerin), was associated with body mass index (BMI) (P = 6.0×10⁻⁴); and rs2395185, affecting inter-depot differences of HLA-DRB1 expression, was associated with high-density lipoprotein (P = 8.7×10⁻⁴) and BMI–adjusted waist-to-hip ratio (P = 2.4×10⁻⁴). Since many genes and their interactions influence complex traits such as MetS, integrated analysis of genotypes and coexpression networks across multiple tissues relevant to clinical traits is an efficient strategy to identify novel associations.
Published in the journal:
. PLoS Genet 8(2): e32767. doi:10.1371/journal.pgen.1002505
Category:
Research Article
doi:
https://doi.org/10.1371/journal.pgen.1002505
Summary
Metabolic Syndrome (MetS) is highly prevalent and has considerable public health impact, but its underlying genetic factors remain elusive. To identify gene networks involved in MetS, we conducted whole-genome expression and genotype profiling on abdominal (ABD) and gluteal (GLU) adipose tissue, and whole blood (WB), from 29 MetS cases and 44 controls. Co-expression network analysis for each tissue independently identified nine, six, and zero MetS–associated modules of coexpressed genes in ABD, GLU, and WB, respectively. Of 8,992 probesets expressed in ABD or GLU, 685 (7.6%) were expressed in ABD and 51 (0.6%) in GLU only. Differential eigengene network analysis of 8,256 shared probesets detected 22 shared modules with high preservation across adipose depots (DABD-GLU = 0.89), seven of which were associated with MetS (FDR P<0.01). The strongest associated module, significantly enriched for immune response–related processes, contained 94/620 (15%) genes with inter-depot differences. In an independent cohort of 145/141 twins with ABD and WB longitudinal expression data, median variability in ABD due to familiality was greater for MetS–associated versus un-associated modules (ABD: 0.48 versus 0.18, P = 0.08; GLU: 0.54 versus 0.20, P = 7.8×10⁻⁴). Cis-eQTL analysis of probesets associated with MetS (FDR P<0.01) and/or inter-depot differences (FDR P<0.01) provided evidence for 32 eQTLs. Corresponding eSNPs were tested for association with MetS–related phenotypes in two GWAS of >100,000 individuals; rs10282458, affecting expression of RARRES2 (encoding chemerin), was associated with body mass index (BMI) (P = 6.0×10⁻⁴); and rs2395185, affecting inter-depot differences of HLA-DRB1 expression, was associated with high-density lipoprotein (P = 8.7×10⁻⁴) and BMI–adjusted waist-to-hip ratio (P = 2.4×10⁻⁴). Since many genes and their interactions influence complex traits such as MetS, integrated analysis of genotypes and coexpression networks across multiple tissues relevant to clinical traits is an efficient strategy to identify novel associations.
Introduction
Genome-wide association (GWA) studies are routinely employed to identify common genetic variants contributing to complex diseases. Many replicated GWA signals have been found for metabolic traits including high-density lipoprotein (HDL), low-density lipoprotein, body mass index (BMI), triglycerides (TG) and blood pressure, greatly enhancing the understanding of the genetic basis of these traits [1]–[6]. However, statistically significant signals resulting from GWA studies do not necessarily lead directly to the identification of genes associated with disease or provide limited insights into the molecular mechanisms of the disease phenotype. In addition, the associated SNPs explain a very small proportion of the heritability estimated for the complex trait [7]. For example, a GWA study for BMI in up to ∼250,000 individuals identified 32 loci that, together, explain only 4.5% of the phenotypic variation or ∼6–11% of the genetic variation in BMI [3]. The 1000 Genomes Project Consortium tested ∼95% of common variation using low-coverage sequencing of 167 individuals and showed that only one-third of complex trait associations are likely to be caused by common coding variation, indicating that most contributions of common variation to complex traits are regulatory in nature [8].
eQTL (expression Quantitative Trait Loci) studies could help in understanding how known genetic variants identified by GWA studies influence clinical traits through gene expression, or suggest potential biological pathways. eQTLs have already been associated to several complex traits including Type I diabetes [9], asthma [10] and obesity [11]. In addition, eQTL studies have shown that top hits from GWA studies are more likely to be eQTLs [12], [13] and eSNPs are enriched for association to Type 2 diabetes (T2D) [14]. Focusing on SNPs that have been associated with an expression trait in the relevant tissue and testing whether such eSNPs are associated with disease could highlight novel genetic loci that fail to meet the stringent genome-wide significance level of GWA studies.
Metabolic syndrome (MetS) is highly prevalent, occuring in up to 22% of US individuals, and is a serious public-health problem world wide [15]. Defined by The International Diabetes Federation (IDF), it is characterized by central obesity plus the presence of two of four heritable metabolic abnormalities: raised TG; reduced HDL; hypertension; and hyperglycaemia. It is considered a serious risk factor of both T2D and cardiovascular disease [16]. Traditional approaches have highlighted insulin resistance, obesity, inflammation, and glucose and/or lipid metabolism to be important to the pathophysiology of the MetS [17], [18]. Body fat distribution plays an important role due to its association with metabolic disorders. Individuals with increased intra-abdominal/visceral fat (high waist-to-hip ratio (WHR)) are at high risk of MetS, whereas those with increased subcutaneous fat in the gluteofemoral region (low WHR) are at little or no risk of MetS [19], [20]. The adverse metabolic risk of visceral fat has been attributed to distinct metabolic properties of adipocytes in this fat depot compared with those in other sites, including differences in metabolic responses, gene expression, adipokine secretion and insulin action [21]–[23]. In addition, GWA studies have identified multiple loci that modulate body fat distribution independent of overall adiposity [24].
The estimated heritability of MetS ranges from 0.10 to 0.51, whilst that of the individual traits that constitute MetS range from 0.13 to 0.72 [25]–[27]. The clinical clustering of individual MetS traits may be explained by shared genetic and environmental factors contributing to their origin [25]. GWA studies on the individual metabolic traits have identified many genetic loci, however, a much smaller number of genetic factors that influence MetS as a clinical entity have been identified (www.genome.gov/gwastudies, accessed 02-03-2011 [28]).
It is likely that for a clinical entity such as MetS comprising multiple complex trait components, there is considerable genetic heterogeneity in causal pathways. Therefore examining many genes simultaneously using a systems-based approach, such as weighted gene co-expression network analysis [29], may be more powerful than analysing single-gene effects. A previous eQTL study in adipose tissue has led to the identification of a macrophage-enriched metabolic network which was enriched for eQTL signals and associated with obesity-related traits [11]. However, the focus of most eQTL studies so far has been on single tissue networks ignoring the fact that complex clinical entities such as MetS are the result of interactions of multiple molecular networks operating within and between tissues. In addition, it is not often recognised that molecular phenotypes such as gene expression traits are influenced by biological and technical variation, affecting power of association detection.
To uncover eQTLs in tissues relevant to MetS, we analysed gene expression profiles in abdominal (ABD) and gluteal (GLU) adipose tissue, and whole blood (WB), from 73 individuals, allowing the investigation of differential regulation between different adipose depots applying both single-gene and a network approaches. Using a second independent cohort comprising 145 and 141 twins with ABD and WB expression data collected longitudinally across two visits, we demonstrate the relative contribution of familial, environmental, and experimental variability to the MetS-associated expression phenotypes. Lastly, we identify a set of SNPs associated with the expression of genes in selected MetS-associated modules showing differential expression between the adipose depots, and test these eSNPs for association with MetS-related phenotypes in two large GWA cohorts.
Results
Single-gene associations between MetS and gene expression
Figure S1 shows the study design. Using Affymetrix hgu133plus2 arrays, we analysed ABD, GLU and WB samples from 29 MetS cases and 44 controls from the MolOBB study. For each subject, we collected six quantitative traits used to define MetS including waist circumference, systolic and diastolic blood pressure, TG, HDL and fasting glucose levels. We defined MetS according to IDF Criteria [16]: central obesity, as assessed by waist circumference plus any two of the following four components (raised TG, reduced HDL cholesterol, raised blood pressure, raised fasting plasma glucose) (Table 1). After filtering for high-quality array data, we limited further analyses to 54, 65, and 68 individuals and those probesets that showed a mean intensity above 4 arbitrary units of log2 (intensity) in at least 10% of individuals resulting in 8941 (ABD), 8307 (GLU) and 6909 (WB) gene expression profiles (probesets were mapped to Entrez Genes), respectively (see Methods). We identified 893 and 335 genes showing significant expression changes with MetS in ABD and GLU applying a 1% False Discovery Rate (FDR) correction [30] with 210 genes overlapping (‘single-gene analysis’) (Figure 1, Table S1, Table S2). Hierarchical clustering of the differentially expressed genes showed distinct clustering of the majority of MetS cases. Clustering was independent of gender or the presence of specific subsets of the two MetS components as defined in the IDF criteria (waist circumference plus any two of the four MetS components) (Figure 1).


The large overlap between the two fat depots supports the robustness of the data and consistency across fat depots. Among the top 10 genes that were associated with MetS was KCTD10; SNPs at this locus were previously associated with HDL [31] (Figure 1C). To validate these findings further, we compared previously implicated MetS-associated loci [32] and obesity-related gene expression differences [11] with the MetS-associated expression differences in our study. This comparison revealed consistency for MetS-associated expression differences including LPL, C3AR1, HSD11B1, and FAT3 in ABD and APOE, FAT3 and FNDC4 in GLU (Table S3, Table S4).
None of the genes was differentially expressed between MetS cases and controls in WB although for the individual MetS components (122 genes for waist circumference, nine genes for TG and one gene for HDL) significant gene expression differences were identified (not shown). Only two of these genes, ATP5E and BLVRB showed significant expression changes with multiple MetS components (waist circumference (FDR P = 9.0 *10−3) and TG (FDR P = 0.01); waist (FDR P = 5.7 *10−3) and HDL (FDR P = 4.3 *10−3) indicating that MetS gene expression differences were more pronounced in the fat depots, which became the main focus of further analysis.
The distribution of adipose tissue between ABD and GLU depots varies between individuals and this variation is associated with MetS and some of the WHR-associated loci have shown depot-specific differences in expression patterns and/or an enrichment of associations with metabolic phenotypes [24]. This led us to test the hypothesis that MetS-associated expression differences found for genes expressed in both depots might reflect depot-specific expression differences. Whereas 8.9% and 13% of the genes associated with MetS in ABD or GLU only exhibited depot-specific differential expression, 44 of the 210 overlapping MetS-associated genes (21%) including KCTD10 and C3AR1 showed evidence for depot-specific expression changes. These findings support the hypothesis that, at least for some genes, the associations with MetS reflect depot-specific differences.
Construction of weighted coexpression networks
A Pearson correlation matrix (containing an estimate of each pairwise correlation between gene expression levels, irrespective of MetS status) was calculated and transformed into a matrix of connection strengths using a power function resulting in a weighted network (see Methods and [33]). Using these connection strengths, genes were clustered in distinct groups of highly connected genes (modules). For each gene in a module, we calculated the Module Membership (MM) by correlating its gene expression profile with the module eigengene (the first principal component of the gene expression profiles in each module). Genes with high MM values to the respective module are considered hubgenes (see Methods and [30]).We constructed gene networks separately for each of the three MolOBB tissue datasets and identified 20, 26 and 18 modules in ABD, GLU and WB, respectively. To distinguish between modules, each module was assigned an arbitrary color. Figure S2 depicts a hierarchically clustered connectivity matrix of the ABD dataset and the 20 identified modules.
Biological significance of network modules
We examined the biological significance of the identified modules by testing for 1) association with MetS 2) enrichment of Gene Ontology (GO) terms 3) hubgenes and 4) previous implicated genes. For the former, we extracted the first principal component of the gene expression profiles in each module (module ‘eigengene’) and tested its association with MetS (see Methods). From the 20, 26 and 18 modules found in ABD, GLU and WB, nine, six and zero modules, respectively, were associated with MetS (FDR P<0.01, Table 2). Four of the nine ABD MetS-associated modules and two of the six GLU MetS-associated modules showed a significant (FDR P<0.01) enrichment of GO terms (Table 3). In the ABD brown module, the eigengene was downregulated for MetS cases compared to MetS controls indicating that genes positively correlated with the eigengene (MM>0) were downregulated in MetS cases. This module was enriched for GO Biological Processes related to oxidative phosphorylation pathways (GO: 0006082 organic acid metabolic process (FDR P = 7.9*10−7) and GO:0006091 generation of precursor metabolites and energy (FDR P = 7.5*10−7). For these GO categories, the majority of the genes (more than 84% of genes with MM>0) were downregulated in MetS cases. The genes in these GO categories had a higher median MM (MM>0.74) than the 877 genes in the module (MM = 0.51) showing functional relevance of these genes in the module. Furthermore, among the top 10 genes with the highest rank of membership (hubgenes), eight were previously implicated in mitochondrial processes including generation of metabolites and energy (ATP5B, ACO2, SUCLG1 and UQCRC), oxidation reduction (MOSC1, MOSC2, LDHD) and fatty acid oxidation (ECHS1) (Table S5, Figure 2A). This module contained the genes LPL, FAT3 and PPMG1 for which SNPs were previously associated with MetS (Table S4) [32].


The eigengene of the ABD cyan module was upregulated for MetS cases compared to MetS controls and genes in this module were enriched for immune response related GO categories. CD163, C1QB, C1QC and C3AR1, which are involved in the inflammatory response and/or complement cascade were among the strongest hubgenes (Table S5). This module contained three of seven reported genes (C3AR1, HSD11B1 and CD68) with a highly significant MM (MM>0.75) from a previously identified macrophage-enriched metabolic network in subcutaneous adipose tissue in humans and mice that was associated with obesity-related traits and enriched for inflammatory response and macrophage activation pathway [11] (Table S3). In addition, CD163 encodes a monocyte/macrophage specific receptor whose soluble form (sCD163) is elevated in T2D and obesity [34]. Although, gene identity and connectivity strength of the previously published module was not available, which is required for a comprehensive comparison between studies, the modules might represent similar immune-response related processes in ABD.
For the GLU samples, the brown module showed an enrichment for glucose metabolic processes (GO:0045913 positive regulation of carbohydrate metabolic process (FDR P = 3.8*10−3)). For the darkgreen GLU module eigengene, the strongest MetS-associated module in GLU and associated with all MetS components (FDR P<0.01), an upregulation among MetS cases was observed as compared to controls. No significant enrichment of GO terms was observed among the genes in the module (Table 3). Among the top 10 of hubgenes in the darkgreen GLU module, were GLUL (MM = −0.89) and PHLDA2 (MM = 0.84) (Table S5, Figure 2B). Both these genes are highly differentially expressed between depots (FDR P<0.01). GLUL, encoding glutamate synthase, showed lower expression levels in GLU, as compared to ABD but the relation of this gene to MetS is unknown. PHLDA2 encoding pleckstrin homology-like domain, family A, member 2 was upregulated in GLU as compared to ABD and is known to be involved in fetal growth with elevated placental expression associated with low birth weight [35].
Differences in single-gene and single-tissue network approaches
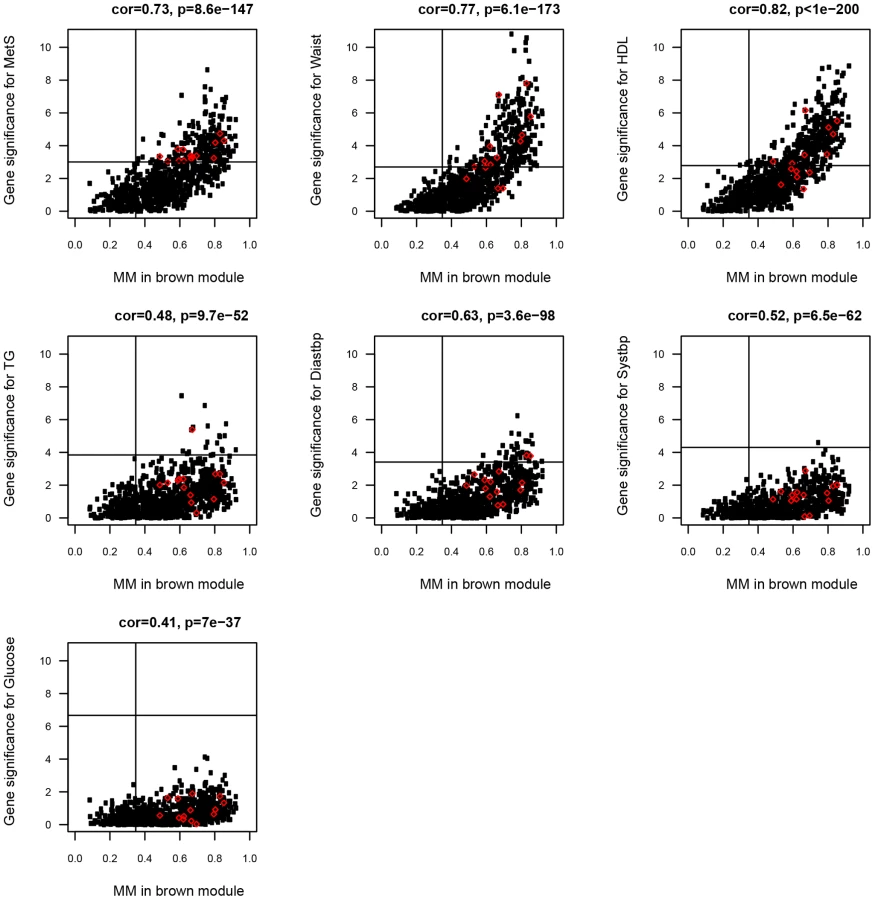
To investigate to what extent gene expression probesets identified in the single-gene analyses as associated with MetS were included in the MetS-associated modules, and signified hubgenes, the correlation between MM and gene significance (direct association between gene expression probeset and MetS from single-gene analyses) was calculated for each gene expression probeset (see Methods and [33]). For 862/893 (97%) and 238/335 (71%) of the MetS-associated probesets in ABD (p<0.01, MM>0.36) and GLU (p<0.01, MM>0.41), a significant association with a MetS-associated module eigengene was found (147 probesets were overlapping). For the ABD brown (Pearson ρ>0.41, p<10−36) and the GLU darkgreen modules (Pearson ρ>0.57, p<10−9) most significantly associated with MetS (Table 2), the correlations between gene significance for MetS and the individual MetS components and MM were highly significant (Figure 3, Figure S3). These results imply substantial concordance in results between the two approaches and support the increased power of the network-based approach by reducing the number of tests significantly. A further advantage of the network approach is the identification of distinct functional modules within single-tissue networks that associated with MetS. Genes that fall into these modules were more highly connected than with genes in other modules (Figure S2) and their relevance can be inferred based on the correlation with the eigengene. The MetS-associated modules were enriched for immune response and oxidative phosphorylation pathways consistent with studies showing that adipose tissue secretes factors that regulate energy homeostasis and the immune response and the activation of inflammatory signalling pathways that emerges in the presence of obesity, insulin resistance and T2D [11], [36].
Differential eigengene network and GO analysis of ABD and GLU expression data
MetS is a complex trait that is manifested in multiple tissues and where regulatory processes may act specific to a tissue as well as across tissues. The regulatory processes that play a role within a tissue may differ from those processes across tissues. It is likely that if modules of coexpressed genes are preserved among tissues, these modules may highlight communication between tissues and elucidate biological pathways that are shared among the tissues. Studying differential expression of individual genes in the module may reveal differences in pathway regulation across tissues.
To examine to what extent biological processes underlying MetS are shared and differentially regulated among the different adipose depots, we first examined the overlap of expressed genes between ABD and GLU (Figure S4). Of 8992 probesets expressed in ABD or GLU, 685 (7.6%) were expressed in ABD; 51 (0.6%) in GLU and 8256 (92%) in both adipose depots. For 679 of the 8256 probesets (8.2%), differential expression between depots was found (FDR P<0.01). GO analysis of the 685 ABD-only probesets showed enrichment for common GO terms (GO:0051171∼regulation of nitrogen compound metabolic process (FDR P = 7.5*10−3)) and other gene transcription terms whilst analysis of the 51 GLU-only probesets showed no enrichment. The enrichment of gene transcription categories among genes expressed in ABD only might suggest regulatory processes specific for ABD rather than genes that are able to induce gene activity changes in other tissues. The large overlap of expressed genes among ABD and GLU, however, suggest the existence of shared processes or at least communication between tissues.
To examine whether the eigengene networks are similar across fat depots, we calculated spearman correlations for the median expression (ρ = 0.98, p<1*10−10 and whole-network connectivities (ρ = 0.66, p<1*10−10) between ABD and GLU (Figure S5). These significant correlations suggest that the ABD and GLU networks are comparable.
Next, we applied differential eigengene network analysis on 8256 genes that were expressed in both the ABD and GLU datasets [29]. In this analysis, we detected 22 consensus modules, i.e., modules that are shared by the ABD and GLU datasets. To identify differences in pathway regulation between ABD and GLU depots, we examined the relationship between all pairs of the consensus module eigengenes represented by consensus networks (see Methods and [29]). For each individual eigengene within an adipose depot, we found that its relationship with the other eigengenes was highly preserved across the adipose depots, with an overall preservation network density D(PreservABD,GLU) of 0.89 (see Methods; Figure S6).
To assess the relevance of the consensus modules for MetS, we tested the consensus module eigengenes for association with MetS (Table S6). Eigengenes of seven consensus modules (six in ABD and six in GLU) were associated with MetS of which five modules were overlapping (FDR P<0.01) (Table S6), suggesting that, in general, the effect of consensus modules on MetS was not characterized by different patterns of coexpressed genes between different adipose depots. The yellow module eigengene showed the strongest association with MetS in both the ABD (FDR P = 1.4*10−5) and the GLU dataset (FDR P = 4.6*10−6) and was upregulated in MetS cases as compared to controls in both fat depots. The genes in this yellow module were enriched for immune response related processes (Table S7). Among the hubgenes of the yellow module, that is, the genes with the highest rank of module membership in both networks, were C3AR1, CD163 and c22orf9 and NPC2 (Figure 2C and 2D and Table S8). Consistent with the overlap of hubgenes between the cyan ABD module and the consensus module, the module eigengenes of ABD cyan and the yellow consensus module were highly correlated (ρ = 0.97, p<1*10−10) and contained many common genes (310 genes).
The yellow module eigengenes in ABD and GLU were highly correlated (ρ = 0.81) and not differentially expressed (p = 0.64). However, 94 genes of the 620 genes (15%) were differentially expressed between depots (FDR P<0.01) which were enriched for the GO-term: GO:0009611 response to wounding (FDR P = 2.3*10−3) (see Methods). Among these differentially expressed genes, were the hubgenes C3AR1, C1QC, CD163 involved in the complement cascade suggesting that the inflammatory response overlapping in the fat depots are regulated through common genes.. Thus, the results suggested the presence of a specific, highly preserved Mets-associated module enriched for immune response pathways containing a significant number of inter-depot differentially expressed genes which may indicate differential regulation between adipose depots.
Variability of MetS-associated gene expression from single-gene analyses
Variation of gene expression traits may be driven by biological as well as experimental factors. Characterizing and quantifying sources of variation of gene expression traits or module eigengenes is important for the identification of regulatory genetic variants. In a separate dataset (MolTWIN) of 154 healthy twins, we retained gene expression of 202 ABD and 191 WB samples from 145 and 141 twins after quality control, respectively (202/191 visits, with 29/26 duplicate measurements (see Methods)). To examine whether the two independent ABD datasets were comparable, spearman correlations for the median expression (ρ = 0.96, p<1*10−10), whole-network connectivities (ρ = 0.51, p<1*10−10) and the intramodular connectivities for the brown module (ρ = 0.71, p<1*10−10) were calculated using the module assignments from MolOBB to calculate the connectivities (Figure S7). The significant correlations suggested that the ABD networks were comparable.
The MolTWIN dataset allowed us to decompose the biological and experimental variation underlying an expression trait into five components: familiality (genetic and common environment effects shared by twin pairs); individual environment (unique for twin individual); common visit and individual visit effects, which respectively measure the amount of shared (by twins within a pair) and non-shared variation occurring in the phenotype over the sampling period. The residual component of variation comprised experimental effects (two technical replicates of the same sample). Familiality and individual environment variation assess longitudinally stable, and common and individual visit variation, short-term biological components. Although, our main focus –given the size of the MolTWIN datasets – was on estimating familiality, we also included heritablity estimates for contrast and completeness (Table S9). We assessed the relative proportions of the five sources of variances using a twin mixed-effects modelling approach (see Methods) retaining 6787 probesets expressed in MolTWIN ABD and WB, and for four groups of probesets selected for association with MetS in MolOBB identified in single-gene analysis and expressed in MolTWIN and in MolOBB 1) 626/893 ABD probesets; 2) 205/335 GLU probesets; 3) 121/210 probesets with expression in both tissues and 4) 22/121 differentially expressed probesets (see Methods).
Familiality was the largest source of variation that contributed to the variance of the gene expression traits in ABD and WB (Figure 4, Text S2). The four groups of MetS-associated probesets showed similar familiality patterns, and their median familiality estimates were significantly higher compared to the probesets not associated with MetS, in both MolTWIN ABD and in WB (Table S9). Also, the groups of MetS-associated probesets showed a greater median familiality in ABD than in WB (Table S9). The highest median estimates were found for the 121 probesets associated with MetS in ABD+GLU (0.43, IQR: 0.18), and the 22 associated with MetS and differentially expressed between ABD and GLU (0.41, IQR: 0.15; Table S9). In addition to familiality, we estimated heritabilities for the groups of MetS-associated probesets, and the heritability patterns were similar as the familiality patterns in ABD but not in WB which might suggest an enrichment of genetic signals in ABD but not in WB.

Variance decomposition of module eigengenes
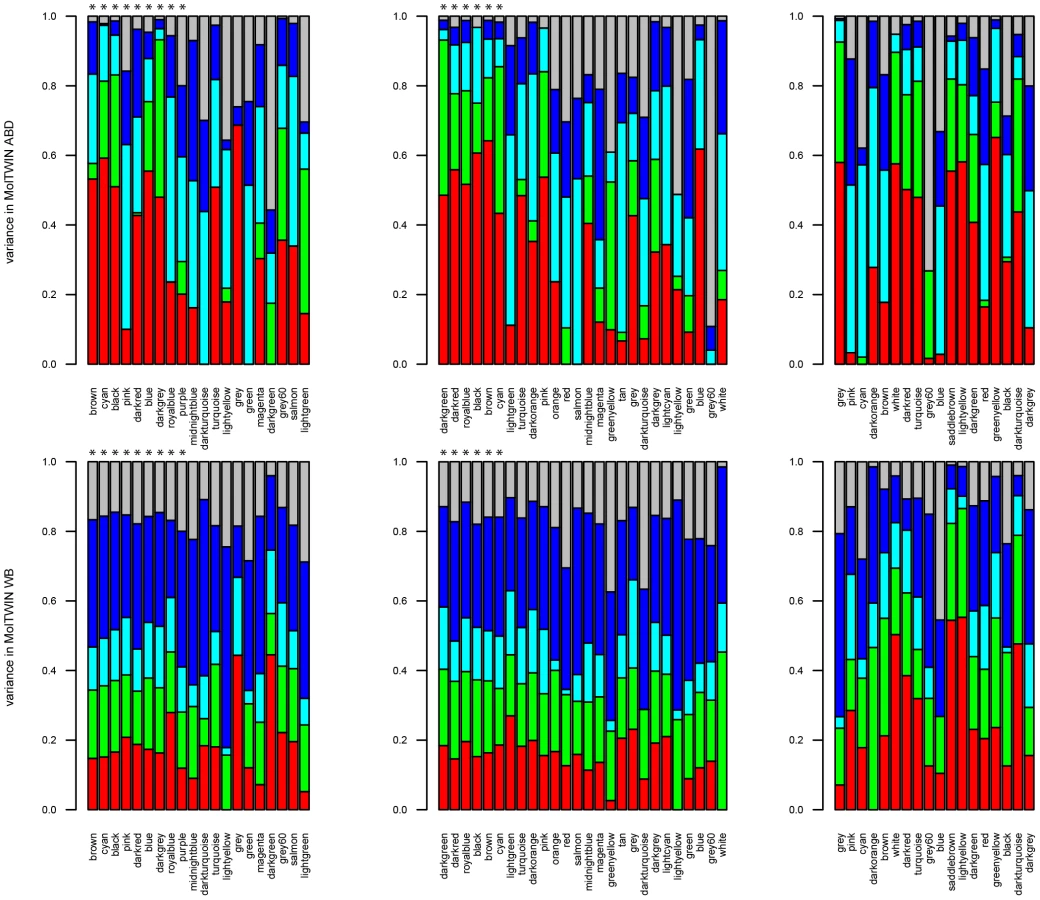
We also used the MolTWIN data to characterize the sources of variation underlying the eigengenes of the MetS-associated modules from the MolOBB data. Rather than constructing networks in MolOBB and MolTWIN separately, we calculated module eigengenes in the MolTWIN study using the module assignments from MolOBB and decomposed the module eigengenes into the five variance sources as described above (Figure 5, Text S2). The variability patterns of the eigengenes were consistent with the results for probesets identified using the single-gene approach. Median familiality estimates from MolTWIN ABD (Figure 5A) were greater for MetS-associated module eigengenes than those not associated with MetS in MolOBB ABD (median = 0.48, IQR = 0.30 vs median = 0.18, IQR = 0.28, p = 0.08) and GLU (median = 0.54, IQR = 0.10 vs median 0.20, IQR = 0.28, p = 7.8*10−4). This pattern was not observed for familiality estimates derived from MolTWIN WB (Figure 5B). For the MetS-associated modules, median heritability estimates were significantly greater than for modules not associated with MetS in ABD (median = 0.41, IQR = 0.27 vs median = 6.9*10−5, IQR = 0.25, p = 0.03) and GLU (median = 0.65, IQR = 0.32 vs median = 0.14, IQR = 0.28, p = 0.007).
eQTL Analysis of differentially expressed genes
To assess whether specific genetic loci were associated with MetS-associated gene expression in ABD and GLU, we performed cis eQTL analyses (cis defined as SNP location within 500 kb of the gene start or stop position; eQTLs are defined as genomic loci that regulate expression levels of mRNAs or proteins). For the ABD eQTL analysis, we used both ABD datasets (MolOBB and MolTWIN) comprising 189 individuals whilst for the GLU dataset we used 62 individuals from the MolOBB dataset. Out of the 8242 ABD genes tested, we found 1287 cis eQTL genes (FDR P<0.01) using a fixed-effects meta-analysis [37]. We found evidence for an eQTL in cis for 77 of the 893 probesets associated with MetS in the single-gene meta-analysis. Six of these eQTL genes showed significant inter-depot differences (Table 4). For the GLU eQTL analysis, 628 of the 8307 tested genes had an eQTL in cis (empirical p<0.01, see Methods). We found a cis eQTL for 6/335 genes associated with MetS. Two of these genes ATP8B4 and LTBP2, exhibited differential expression between ABD and GLU (Table 4). Only one of these MetS eSNPs (an eSNP has been defined as a SNP associated with an expression trait), rs8207, affecting PHOSPHO2 expression levels, was found in both ABD and GLU analyses but none of the corresponding expression probesets showed significant differences between adipose depots (Table 4).

We similarly calculated cis eQTL associations for probesets in the ABD brown and GLU darkgreen modules most significantly associated with MetS in MolOBB. For 124/877 genes in the ABD brown module (877 tests), we found evidence for an eQTL in cis. For 14/124 genes, a high MM (p<0.01) and a significant association with MetS was found (Table 4; Figure 3). For the GLU darkgreen module comprising 107 genes, we found two eQTL genes that were significantly associated with MetS and high MM (p<0.01) (Table 4; Figure S3). For the yellow consensus module (620 genes), shared between ABD and GLU datasets, we found 69 and 26 genes with evidence for an eQTL in cis in ABD and GLU respectively; five eQTLs in ABD and four eQTLs in GLU, had corresponding genes exhibiting interdepot expression differences (Table 4).
To validate the eQTL analysis, we evaluated 29 SNPs and their proxies (r2>0.5) that were associated with MetS in a GWA of 22,161 participants [32]. In both ABD and GLU, an eQTL for HERPUD1 (rs3764261) was found (Table S4).
Modules are groups of highly correlated genes and could be the result of transcriptional co-regulation. We examined whether we could find genomic hotspots i.e. genetic loci that regulate multiple genes that are coexpressed within the module. We tested the module eigengenes of the ABD brown, GLU darkgreen and yellow consensus modules for association with 296,017 SNPs. After multiple testing correction (FDR P<0.05), we found the 21q22.13 locus (rs2835630, p = 1.4*10−7, FDR P = 0.04) significantly associated with the ABD brown module eigengene and the 6p21 locus (rs909982, p = 8.3*10−8, FDR P = 0.02) associated with the GLU darkgreen module. The SNP at the 21q22.13 locus was within the Down Syndrome Critical Region in a high LD region containing the TTC3 and DSCR9 genes. Of the two genes, only TTC3 was expressed in ABD. This gene was not differentially expressed between MetS cases and controls (p = 0.01, FDR P = 0.06) and assigned to the turquoise module (MM = −0.62, P = 3.4*10−7). Remarkably, TTC3 is an E3 ligase facilitating ubiquitination and degradation of phosphorylated Akt [38] whereas Akt has a key role in metabolic regulation. The SNP at the 6p21 locus was in the intronic region of LRFN2. This gene was however not expressed in GLU and plays a role in neuronal development. These loci may act as a master regulator of the genes in the module mediating a gene expression regulatory mechanism.
Confirmation of associations between eSNPs and MetS–related phenotypes in two large GWA cohorts
To validate our results, we tested our prioritised eSNPs for association with MetS-related phenotypes using data from two large GWA cohorts. Based on the eQTL analyses, we prioritised a set of 32 eSNPs that were associated with MetS-associated probesets/modules (Table 4): 15 eSNPs associated with probesets in the most significant ABD (brown) module, three eSNPs in the most significant GLU (darkgreen) module, and 14 eSNPs associated with genes exhibiting inter-depot differences in the consensus (yellow) module and/or with the single-gene models (nine of which were also significantly associated with MetS). The 32 eSNPs were tested for association with individual phenotypic components of MetS and the fourteen eSNPs exhibiting ABD-GLU inter-depot differences were tested for association with WHR-adjBMI (Table 4): Association with BMI and WHR-adjBMI was assessed using data from the GIANT consortium comprising ∼120,000 individuals and with HDL and TG in >100,000 individuals from a large-scale publicly available lipid study [4]. For each of the four clinical phenotypes, a Bonferroni-adjusted significance threshold of 1.6*10−3 was chosen such that Pr(Number of False Positives >0) <0.05 by correcting for 32 SNP-clinical phenotype associations. This threshold was corresponding to a FDR of 0.03 across 110 tests. Adopting a much simplified scenario given the complex correlation structure of the MetS-related traits, we found three significant associations which was more than expected by chance; assuming independence between the 110 tests, the binomial probability was 7.3*10−4. SNP rs10282458, was significantly associated with gene expression levels of the adipokine RARRES2 encoding chemerin, and was significantly associated with BMI (genomic control corrected p = 6.0*10−4). RARRES2 gene expression levels showed a familiality of 0.53 in the MolTWIN ABD dataset and were highly connected with the brown module eigengene (MM = 0.83). In MolOBB, expression levels of RARRES2 were strongly associated with MetS (p = 1.9*10−5) and with the individual components of MetS: waist (p = 1.6*10−8), HDL (p = 2.0*10−5) and diastolic blood pressure (p = 1.5*10−4). SNP rs2395185, which affected expression levels of HLA-DRB1, was significantly associated with HDL (genomic-control corrected p = 8.7*10−4). Expression levels of HLA-DRB1 showed a familiality of 0.59 in MolTWIN ABD and were correlated with waist circumference (p = 2.9*10−5) and HDL (p = 5.3*10−5) in MolOBB.
Next, we tested the 14 eSNPs that were associated with ABD-GLU inter-depot differences and rs10282458 for association with WHR-adjBMI in the GIANT consortium. By focusing on WHR after adjustment for BMI, we anticipated to detect associations with body fat distribution independent of those influencing overall adiposity. SNP rs10282458 was indeed associated with BMI but not with WHR-adjBMI (Table 4). We found one significant association (genomic-control corrected) between eSNP rs2395185, influencing HLA-DRB1 expression levels in ABD and GLU, and WHR-adjBMI (p = 2.4*10−4). These results may suggest that differential regulation of the HLA-DRB1 region is associated with WHR-adjBMI.
Discussion
Given that many molecular processes in multiple tissues could be involved in the onset of MetS, we genotyped and profiled gene expression in WB and two different adipose depots, ABD and GLU, from 73 individuals. After constructing coexpression networks for each tissue independently and between tissues, we identified MetS-associated modules of coexpressed genes enriched for immune response and oxidative phosphorylation pathways in adipose depots but not in WB. By testing eSNPs, that were associated with expression of the genes in the MetS-associated modules, for association with MetS-related phenotypes in large scale GWA datasets, we found associations with RARRES2 and HLA-DRB1. Thus, by constructing networks across and within different adipose depots combined with single-gene analysis, two signals which had not reached genome-wide significance in GWA datasets of more than 100,000 individuals were identified.
Adipose tissue is a dynamic endocrine organ that secretes proteins such as cytokines and hormones, collectively named adipokines. Adipokines may regulate energy and vascular homeostasis, as well as inflammatory processes, and are involved in glucose and lipid metabolism. Chemerin, encoded by RARRES2, is an adipokine known to play an important role in adipogenesis and metabolic homeostasis and modulating chemotaxis and activation of dendritic cells and macrophages [39], [40]. In humans, chemerin levels are associated with multiple components of MetS including BMI, plasma TG, hypertension, and HDL [41]–[43]. In a study of Caucasian individuals, a serum chemerin concentration of 240 ug/L was selected to diagnose MetS with a sensitivity of 75% and specificity of 67% [44]. Chemerin expression and secretion from adipose tissue increases with adipocyte differentiation and obesity [39], [41]. Despite the evidence linking circulating chemerin levels with metabolic phenotypes, to our knowledge, this is the first study that identified loci near genes encoding chemerin for MetS-related phenotypes. A GWA study reported that serum chemerin levels were heritable and found a genetic association between the EIDL3 gene and serum chemerin levels supporting a potential role for chemerin in angiogenesis [45]. Given the convergence of adipocyte and macrophage function, chemerin may provide an interesting link between chronic inflammation, often associated with obesity-related diseases, and obesity and metabolic function in human adipose tissue with MetS.
In humans, variations in adipose tissue distribution is associated to different metabolic consequences, with abdominal increase of fat producing a much greater risk for metabolic traits than gluteofemoral fat, suggesting differential regulation between the two adipose depots [20]. We identified a MetS-associated module highly preserved across the two adipose depots and enriched for immune response pathways, with 15% of the probesets differentially expressed between tissues. A modest association between eSNP rs2395185, influencing HLA-DRB1 expression levels in ABD and GLU, and WHR-adjBMI was found. The HLA-associated SNP found in our study has also been linked to ulcerative colitis [46], [47]. Cis eQTLs of the HLA-DRB1 locus with other SNPs have previously been associated with Type 1 diabetes in liver tissue [9] and with cholesterol levels in omental and subcutaneous fat [4] suggesting differential regulation of this locus across different tissues.
The specific identified genetic associations were found with a network approach rather than with single-gene association between expression and clinical traits, even though there was substantial concordance in results between the two strategies. Investigating coexpression networks may be a more powerful approach than a single-gene association analysis since most cellular components are connected to each other through regulatory, metabolic and protein-protein interactions and summarising coexpressed genes in a single eigengene reduces the number of tests significantly. In our study, we tested a set of SNPs, associated with expression of genes in MetS-associated expression modules in relevant tissues, with the hypothesis that these eSNPs are enriched for SNP-MetS associations. Testing this small SNP set for disease association in large GWAS cohorts revealed two SNP-disease associations, the signals of which would have been relatively weak in a genome-wide multiple-testing context.
An additional motivation for utilising a network-based approach is that it is unlikely that MetS is a consequence of an abnormality in a single gene product, but reflects the perturbations of a particular functional module in the gene network by a complex interaction of genetic and environmental interactions [48], [49]. The existence of distinct disease-specific functional modules is consistent with: findings from GWA studies observing that many genetic loci identified with GWAs for traits such as height, lipids and BMI may be not randomly distributed with respect to biological function [50], genes associated with similar disorders show higher expression profiling similarity for their transcripts, and proteins involved in the same disease have an increased tendency to interact with each other [51].
We found an enrichment of oxidative phosphorylation genes in the most significant ABD gene network module, which is consistent with previous studies showing compelling evidence for mitochondrial dysfunction in association with insulin resistance and obesity [52], [53]. Reduced mitochondrial biogenesis has been demonstrated in humans with MetS, coinciding with reduced ATP level and dysfunctional mitochondrial electron transport [54], [55]. Mitochondrial dysfunction may lead to an increased production of Reactive Oxygen Species and consequently oxidative stress which is coupled to activation of inflammatory pathways and insulin resistance in adipocytes [36], [56].
The network topology-based approach helps to uncover potential mechanisms that contribute to the shared pathophysiology of the multiple components of MetS. Defects in gene products that are part of the same pathway, may also affect other cellular functions, resulting in potential comorbidity effects. Consistent with this view, our results and those of other studies support the idea that the chronic low-grade inflammatory condition that is associated with obesity plays a role in the etiology of MetS [36]. Specifically, cells of the innate immune system, particularly macrophages, are crucially involved in adipose inflammation and systemic metabolic abnormalities [36]. CD163, one of the hubgenes found this study, encodes a monocyte/macrophage specific receptor whose soluble form (sCD163) is elevated in T2D and obesity [34].
It is however not clear whether obesity is the origin or whether inflammation is proximal to metabolic dysfunction [36]; a chronic excess of nutrients can trigger metabolic dysfunction and inflammatory responses simultaneously leading to metabolic excess which also leads to inflammatory responses.
In any expression study, many expression traits associated with the disease will not necessarily be causative, but instead be mostly reactive to disease. In addition, expression levels represent measurements from a heterogeneous mixtures of cells. It is important to distinguish the effect of genetic variation on gene expression from other factors that are reactive to the disease or confounding factors that also correlate with expression variability. Both our single-gene and network-based results showed that the expression probesets and modules filtered by association with MetS had increasing familiality and heritability levels, which may suggest an enrichment of genetically relevant signals.
Our results arose principally from the analysis of gene expression in ABD and GLU adipose depots, and not WB. In addition, the heritability of the genes associated with MetS in both ABD and GLU was high in ABD tissue of the twins but not in WB. Moreover, the proportion of variance that was explained by the fact that the twins attended the hospital together (common visit effect) was high in WB, indicating stronger short-term environmental effects on WB than ABD expression levels. These observations suggest that WB is not necessarily the tissue of choice to detect eQTLs that are of direct relevance to MetS.
In conclusion, we performed an eQTL study in WB, ABD and GLU and highlighted two genetic loci associated with MetS mediated by gene expression variation. Considering many genes and their interactions influence complex traits such as MetS, the integrated analysis of genotype data and expression networks across multiple tissues relevant to the clinical traits under study is an efficient strategy to identify novel genetic associations, and may offer better targets for drug development.
Methods
Ethics statement
The MolTWIN study was approved by St. Thomas' Hospital Research Ethics Committee (EC04/015 Twins UK). The MolOBB study received ethical approval from Oxfordshire REC C (08/H0606/107). All participants gave informed consent.
MolOBB data collection
The MolOBB study consists of 44 healthy controls (27 men, 17 women) and 29 cases with MetS (16 men, 13 women) between 39 and 56 years old that were collected from the Oxford Biobank as part of the MolPAGE consortium [57]. Based upon the IDF Criteria (www.idf.org), MetS was assigned as central obesity (waist circumference (or BMI>30 kg/m2) plus any two of the following four factors: raised triglycerides, reduced HDL cholesterol, raised blood pressure or raised fasting plasma glucose [16]. Control subjects were selected to be discordant from the MetS cases (Table 1). From these individuals, ABD and GLU adipose and WB samples were taken. A total of 143 samples were obtained, with 71 subjects successfully donating both tissue types, and one individual donating only GLU. Subcutaneous adipose tissue from the abdominal wall is taken at the level of the umbilicus; subcutaneous gluteal tissue is taken from the upper outer quadrant of the buttock and WB samples were taken using EDTA and PAXgene tubes. Gene expression data is available at ArrayExpress (E-TABM-54).
MolTWIN collection
A total of 154 twins (56 monozygotic (MZ) pairs and 21 dizygotic (DZ) pairs), were ascertained from the UK Adult Twin registry at St. Thomas' Hospital [58] and recruited to participate in this study. Gene expression data is available at ArrayExpress (E-TABM-325). Eligible volunteers were healthy, Caucasian, post-menopausal females of Northern European descent, aged between 45–76 years old. Twins were checked for zygosity using a panel of 47 SNPs [59]. Each participant donated subcutaneous adipose tissue from the abdominal wall and WB; 34 MZ twin pairs donated samples during two visits whereas 21 DZ pairs and 22 MZ pairs donated samples during one visit. Both twins in a pair visited on the same day.
Gene expression profiling
For the WB samples, PAXgene tubes were used and RNA was extracted according to the manufacturer's protocol (PAXgene, QIAGEN). Total RNA was extracted with TRIreagent (SIGMA-ALDRICH, Gillingham, UK) from the fat biopsies and quantified using a NanoDrop. For six of the MolOBB subjects and 30 of the MolTWIN subjects from the first visit (15 MZ pairs), RNA was split into two aliquots before labelling (technical replicates). RNA was labelled using the MessageAmp II 96-well amplification kit (Applied Biosystems, CA, USA). Labelled RNA was hybridized onto Affymetrix hgu133plus2 arrays washed, stained, and scanned for fluorescence intensity according to manufacturers protocols (Affymetrix, Inc., USA). For each tissue, RNA samples were randomised and extracted in batches of 12 samples, rerandomised before labelling in 96-well plates and hybridised in batches of 12 samples on a plate-row by plate-row basis. Quality control checks involved signal intensities, background intensity, expression of control genes and spike-ins, as well as a spatial representation of the intensities. To identify outliers further, principal components analysis was performed on the normalised gene expression dataset using the NIPALS algorithm. The majority of the probes on the hgu133plus2 arrays were collected into 17,726 non-overlapping probesets according to Entrez Gene annotations provided by Dai et al. [60].
Gene expression preprocessing
After outlying arrays had been removed, there remained data in the MolOBB study from 54 ABD samples (four in technical duplicate), 65 GLU samples (five in technical duplicate) and 68 WB samples. During 202 visits, 231 MolTWIN samples from ABD (29 technical replicates) were successfully profiled from 145 individuals. From the WB samples, 217 MolTWIN gene expression profiles for 141 individuals were generated during 191 visits (26 technical replicates). All arrays were normalised concurrently across datasets for comparisons between tissues and separately for comparisons within a single tissue using GC robust multi-array analysis [61]. Gene-specific expression summaries were averaged across technical replicates of a sample. We then filtered the data, retaining only those probesets that were annotated to an autosomal location, and also showed a mean intensity above 4 arbitrary units of log2 (intensity) in at least 10% of individuals. After this filtering stage in the MolOBB, there remained 8619 probesets in the ABD-GLU dataset, 8941 in the ABD dataset, 8307 in the GLU and 6909 probesets in the WB dataset. In the MolTWIN study, 8928 probesets in the ABD dataset and 9071 probesets in the WB dataset remained.
Genotyping and quality control
DNA was successfully extracted from WB samples using GeneCatcher (Invitrogen Life Technologies, Carlsbad, USA) according to manufacturer's protocol. 166 samples (70 MolOBB, 96 twins (one MZ individual per MZ pair and two DZ individuals per DZ pair)) are genotyped with Illumina 317K BeadChip SNP arrays (Illumina, San Diego, USA). Genotype data (EGAS00000000102) is available at EGA.
Quality control on the genotyped subjects was performed applying slightly changed quality control filters as described previously by the Wellcome Trust Case Control Consortium [62]. Two twin samples are removed due to sample success rate <95% and three samples (two twins, one MolOBB) were removed due to non European ancestry. SNPs are removed when minor allele frequency (MAF) <1% or showed a success rate <95% and MAF>5%, and when <99% and MAF<5%. Hardy-Weinberg equilibrium was calculated by combining all unrelateds of the MolOBB and MolTWIN dataset (e.g.one twin per twinpair) and SNPs were removed if P value<10−4. After QC, genotypes of the ungenotyped MZ twin were copied from genotyped MZ twin. Finally, we included 69 MolOBB individuals and 144 twins genotyped for 296,017 autosomal SNPs.
Statistical analysis
Identifying differentially expressed genes
For the differential expression analysis between MetS cases and controls, we investigated the effect of gender, RNA Integrity Number, age and plate on gene expression measurements. Several probesets were associated with gender and plate but none with age or RNA Integrity Number. We then tested all detected probesets for association with MetS adjusting for gender and plate-effects using linear models. To investigate whether genes are differentially expressed between ABD and GLU, we used a linear mixed model on in which tissue (ABD versus GLU), MetS case-control status, gender, and plate were fitted as fixed effects, and subject (sample donor) as a random effect. Models were fitted using the Rpackage Maanova [63]. The pvalues from the test were corrected for multiple testing using FDR [30] and probesets were considered significant if the adjusted p-value of the test was <0.01.
Construction of the weighted gene coexpression networks
We used the Rpackage WGCNA for network construction. To construct single tissue and consensus eigengene networks, we adjusted the tutorials from the WGCNA website (http://www.genetics.ucla.edu/labs/horvath/CoexpressionNetwork/Rpackages/WGCNA/Tutorials/index.html). A weighted gene co-expression network reconstruction algorithm was used to reconstruct co-expression networks for each of the three MolOBB datasets (ABD, GLU and WB) [64]. Briefly, a Pearson correlation matrix (gene-by-gene matrix) between all gene expression pairs was constructed. To define the weighted coexpression network, an adjacency matrix was constructed using a soft power adjacency function . This parameter of the power function was defined in such a way that the resulting co-expression network (adjacency matrix) satifies approximate scale-free topology. To measure how well the network satisfied a scale-free topology, we used fitting index of the linear model that regressed on where k is connectivity and is the frequency distribution of connectivity [64]. The fitting index of a perfect scale-free network is 1. For the MolOBB ABD, GLU and WB datasets, we chose a power of 5, 6 and 12, respectively, which resulted to an approximate scale-free topology network with the scale-free fitting index greater than 0.8. The distribution of the resulting network approximated a power law: [64].
Modules were defined as groups of genes with similar patterns of connection strengths with all other genes of the network. The adjacency matrix was transformed into a topological overlap matrix. To identify modules of highly co-regulated genes, we used average linkage hierarchical clustering to group genes based on the topological overlap of their connectivity, followed by a dynamic cut-tree algorithm to cluster dendrogram branches into gene modules [65].
To summarise the gene expression profiles of an entire module by a single gene expression profile, module eigengenes were computed. Gene expression profiles for each module were decomposed using singular value decomposition , where is a n-by-g matrix where g is the number of genes and n the number of samples. The first column of represented the module eigengene. These module eigengenes were tested for association with the MetS-related phenotypes adjusted for plate and gender using a linear regression model. These associations were adjusted for multiple testing by applying a 1% FDR [30].
To determine whether the MetS-associated modules are biologically meaningful, GO enrichment analyses were conducted using DAVID [66]. For each of the MetS-associated modules, we examined enrichment of Biological Process GO terms as compared to the expressed probesets of that tissue using a Fisher's exact test. FDR Pvalues<0.01 were considered significant [30]. Whole network connectivities were defined as the sum of connection strength with the other network genes. The intramodular connectivity of the ith gene is defined as the absolute value of the correlation between the ith expression profile and the module eigengene (ME): . Modules were visualised using the program VisANT [67].
To assess the preservation of network properties across the ABD and GLU datasets, we applied differential eigengene network analysis to identify consensus modules [29]. These consensus modules were defined using consensus dissimilarity and used for hierarchical clustering. To compare the consensus eigengene networks of ABD and GLU whose adjacency matrices are and we used a preservation network in which adjacencies are defined as . Here, and denote the eigengenes of the Ith consensus module in ABD and GLU, respectively. High levels of the preservation network indicate a strong preservation between I and J across the two networks. The density D is an aggregate measure of adjacency preservation between the and [29].
Variability analysis
Maximum likelihood estimation of variance components from the MolTWIN dataset was performed by fitting a linear mixed-effects model using the lme4 package [68]. For each normalised probeset or module eigengene, , we fitted a model for the lth aliquot (1,2) from a biological sample taken at the kth visit (1,2) of the jth twin (1,2) from the ith pair (1,2,..,76):with the overall mean and the batch-effect i.e. modelling variation across 96-well plates (fixed effects). The random effects , , , , , represent pair (common to a pair of twins, irrespective of zygosity), zygosity indicator (shared by a pair of MZ twins () but not by a pair of DZ twins ()), individual environmental, common visit, individual visit and residual experimental error effects, respectively. The total phenotypic variance can be decomposed into the variances of , , , , and, respectively:
To estimate the familiality (genetic and common environmental components) among twin pairs, we calculated: . where represents the genetic and common-environmental phenotypic covariance between a pair of DZ twins, irrespective of zygosity. DZ pairs share half their additive genetic variance plus all of their common environmental variance. MZ pairs share this variance, but in addition also share the remaining half of additive genetic variance. The latter extra covariance is parameterized by . The heritability was estimated by . Differences between the familiality distributions in MolTWIN ABD and WB were determined using the Wilcoxon Signed Rank Test. Familiality differences between the MetS-associated probesets or module eigengene and the probesets or module eigengenes that were not associated with MetS were calculated using the Wilcoxon Rank Sum Test.
eQTL analysis
We selected subjects who had complete data on plate, gender, casecontrol status, gene expression and genotypes. We set out to identify SNPs that affect gene expression levels in cis. We defined an association between a SNP and gene expression level as cis-acting if the SNP was located within 500 kb from the start or stop position of the annotated gene (NCBI build 36). Genotypes were coded as 0, 1, and 2 corresponding to the counts of the minor allele and an additive model was fitted in all models. For each of the genes, each SNP in the cis region was tested independently.
In the MolOBB study, SNP associations were calculated by regressing expression level against using a linear regression model adjusting for gender and plate-effects. In the MolTWIN study, we fitted linear mixed models, for which twin pairing, zygosity, individual visit, common visit, individual environment and residual effect were fitted as random effects and genotype and plate as fixed effects. eQTL associations in MolOBB and MolTWIN were calculated with the Rpackages lm and lme4, respectively. In the ABD meta-analysis, we combined study-specific allelic effect-estimates on 8242 probesets expressed in both ABD MolOBB (N = 52) and MolTWIN (N = 137) using a fixed effect model, using the inverse of the variance of the study-specific allelic effect-estimates to weight the contribution of the two studies [37]. Results were checked for heterogeneity and adjusted for multiple testing by FDR [30].
Follow-up of SNP–MetS associations in independent cohorts
In order to followup eSNPs in independent cohort we assembled a set of 32 eSNPs based on two criteria: i. Expression levels had to be differentially expressed between MetS cases and controls and showed a high MM (p<0.01) with the brown module in ABD or the darkgreen module in GLU. ii. Expression levels in yellow consensus module or gene-by-gene model had to be differentially expressed between depots. In order to confirm the associations between the 32 eSNPs and the MetS related phenotypes in independent cohorts, we obtained results of relevant meta-analyses conducted by two consortia. For the BMI associations, 32 eSNPs were tested for association in the GIANT consortium consisting of >120,000 individuals. To confirm associations with TG and HDL, we used previously published GWA results comprising >100,000 individuals [4]. For the 14 eQTL associations affecting gene expression levels associated with interdepot differences, 14 eSNPs were examined for association with WHR-BMIadj. Meta-analysis statistics were obtained using weighted z-statistics and corrected for genomic control. For each of four clinical phenotypes, the significance threshold 1.6*10−3 is chosen such that Pr(Number of False Positives >0) <0.05. Exact binomial probabilities were calculated through repeated applications of the standard binomial formula.
We selected 29 variants and their proxies (r2>0.5) previously associated to MetS or a pair of MetS traits [32] and tested these for association with expression levels in ABD and GLU. Expression levels of genes within 500 kb around SNP were examined for differential expression between MetS cases and controls.
URL
All code is available at http://www.well.ox.ac.uk/ggeu/PLoSGenet_Minetal_MolPAGE/.
Supporting Information
Zdroje
1. LoosRJLindgrenCMLiSWheelerEZhaoJH 2008 Common variants near MC4R are associated with fat mass, weight and risk of obesity. Nat Genet 40 768 775
2. WillerCJSpeliotesEKLoosRJLiSLindgrenCM 2009 Six new loci associated with body mass index highlight a neuronal influence on body weight regulation. Nat Genet 41 25 34
3. SpeliotesEKWillerCJBerndtSIMondaKLThorleifssonG 2010 Association analyses of 249,796 individuals reveal 18 new loci associated with body mass index. Nat Genet 42 937 948
4. TeslovichTMMusunuruKSmithAVEdmondsonACStylianouIM 2010 Biological, clinical and population relevance of 95 loci for blood lipids. Nature 466 707 713
5. LevyDEhretGBRiceKVerwoertGCLaunerLJ 2009 Genome-wide association study of blood pressure and hypertension. Nat Genet 41 677 687
6. TabaraYKoharaKKitaYHirawaNKatsuyaT 2010 Common variants in the ATP2B1 gene are associated with susceptibility to hypertension: the Japanese Millennium Genome Project. Hypertension 56 973 980
7. ManolioTACollinsFSCoxNJGoldsteinDBHindorffLA 2009 Finding the missing heritability of complex diseases. Nature 461 747 753
8. DurbinRMAbecasisGRAltshulerDLAutonABrooksLD 2010 A map of human genome variation from population-scale sequencing. Nature 467 1061 1073
9. SchadtEEMolonyCChudinEHaoKYangX 2008 Mapping the genetic architecture of gene expression in human liver. PLoS Biol 6 e107 doi:10.1371/journal.pbio.0060107
10. MoffattMFKabeschMLiangLDixonALStrachanD 2007 Genetic variants regulating ORMDL3 expression contribute to the risk of childhood asthma. Nature 448 470 473
11. EmilssonVThorleifssonGZhangBLeonardsonASZinkF 2008 Genetics of gene expression and its effect on disease. Nature 452 423 428
12. NicaACMontgomerySBDimasASStrangerBEBeazleyC 2010 Candidate causal regulatory effects by integration of expression QTLs with complex trait genetic associations. PLoS Genet 6 e1000895 doi:10.1371/journal.pgen.1000895
13. NicolaeDLGamazonEZhangWDuanSDolanME 2010 Trait-associated SNPs are more likely to be eQTLs: annotation to enhance discovery from GWAS. PLoS Genet 6 e1000888 doi:10.1371/journal.pgen.1000888
14. ZhongHBeaulaurierJLumPYMolonyCYangX 2010 Liver and adipose expression associated SNPs are enriched for association to type 2 diabetes. PLoS Genet 6 e1000932 doi:10.1371/journal.pgen.1000932
15. FordESGilesWHDietzWH 2002 Prevalence of the metabolic syndrome among US adults: findings from the third National Health and Nutrition Examination Survey. JAMA 287 356 359
16. AlbertiKGZimmetPShawJ 2005 The metabolic syndrome–a new worldwide definition. Lancet 366 1059 1062
17. EckelRHGrundySMZimmetPZ 2005 The metabolic syndrome. Lancet 365 1415 1428
18. LusisAJAttieADReueK 2008 Metabolic syndrome: from epidemiology to systems biology. Nat Rev Genet 9 819 830
19. KissebahAHKrakowerGR 1994 Regional adiposity and morbidity. Physiol Rev 74 761 811
20. ManolopoulosKNKarpeFFraynKN 2010 Gluteofemoral body fat as a determinant of metabolic health. Int J Obes (Lond) 34 949 959
21. GestaSBluherMYamamotoYNorrisAWBerndtJ 2006 Evidence for a role of developmental genes in the origin of obesity and body fat distribution. Proc Natl Acad Sci U S A 103 6676 6681
22. WajchenbergBLGiannella-NetoDda SilvaMESantosRF 2002 Depot-specific hormonal characteristics of subcutaneous and visceral adipose tissue and their relation to the metabolic syndrome. Horm Metab Res 34 616 621
23. PerriniSLaviolaLCignarelliAMelchiorreMDe StefanoF 2008 Fat depot-related differences in gene expression, adiponectin secretion, and insulin action and signalling in human adipocytes differentiated in vitro from precursor stromal cells. Diabetologia 51 155 164
24. HeidIMJacksonAURandallJCWinklerTWQiL 2010 Meta-analysis identifies 13 new loci associated with waist-hip ratio and reveals sexual dimorphism in the genetic basis of fat distribution. Nat Genet 42 949 960
25. ZhangSLiuXYuYHongXChristoffelKK 2009 Genetic and environmental contributions to phenotypic components of metabolic syndrome: a population-based twin study. Obesity (Silver Spring) 17 1581 1587
26. HennemanPAulchenkoYSFrantsRRvan DijkKWOostraBA 2008 Prevalence and heritability of the metabolic syndrome and its individual components in a Dutch isolate: the Erasmus Rucphen Family study. J Med Genet 45 572 577
27. SungJLeeKSongYM 2009 Heritabilities of the metabolic syndrome phenotypes and related factors in Korean twins. J Clin Endocrinol Metab 94 4946 4952
28. HindorffLASethupathyPJunkinsHARamosEMMehtaJP 2009 Potential etiologic and functional implications of genome-wide association loci for human diseases and traits. Proc Natl Acad Sci U S A 106 9362 9367
29. LangfelderPHorvathS 2007 Eigengene networks for studying the relationships between co-expression modules. BMC Syst Biol 1 54
30. BenjaminiYHochbergY 1995 Controlling the false discovery rate: a practical and powerful approach to multiple testing. Journal of the Royal Statistical Society Series_ B 57 289 300
31. WaterworthDMRickettsSLSongKChenLZhaoJH 2010 Genetic variants influencing circulating lipid levels and risk of coronary artery disease. Arterioscler Thromb Vasc Biol 30 2264 2276
32. KrajaATVaidyaDPankowJSGoodarziMOAssimesTL 2011 A bivariate genome-wide approach to metabolic syndrome: STAMPEED consortium. Diabetes 60 1329 1339
33. LangfelderPHorvathS 2008 WGCNA: an R package for weighted correlation network analysis. BMC Bioinformatics 9 559
34. SporrerDWeberMWanningerJWeigertJNeumeierM 2009 Adiponectin downregulates CD163 whose cellular and soluble forms are elevated in obesity. Eur J Clin Invest 39 671 679
35. ApostolidouSAbu-AmeroSO'DonoghueKFrostJOlafsdottirO 2007 Elevated placental expression of the imprinted PHLDA2 gene is associated with low birth weight. J Mol Med (Berl) 85 379 387
36. HotamisligilGS 2006 Inflammation and metabolic disorders. Nature 444 860 867
37. MagiRMorrisAP 2010 GWAMA: software for genome-wide association meta-analysis. BMC Bioinformatics 11 288
38. SuizuFHiramukiYOkumuraFMatsudaMOkumuraAJ 2009 The E3 ligase TTC3 facilitates ubiquitination and degradation of phosphorylated Akt. Dev Cell 17 800 810
39. GoralskiKBMcCarthyTCHannimanEAZabelBAButcherEC 2007 Chemerin, a novel adipokine that regulates adipogenesis and adipocyte metabolism. J Biol Chem 282 28175 28188
40. WittamerVFranssenJDVulcanoMMirjoletJFLe PoulE 2003 Specific recruitment of antigen-presenting cells by chemerin, a novel processed ligand from human inflammatory fluids. J Exp Med 198 977 985
41. BozaogluKBoltonKMcMillanJZimmetPJowettJ 2007 Chemerin is a novel adipokine associated with obesity and metabolic syndrome. Endocrinology 148 4687 4694
42. BozaogluKSegalDShieldsKACummingsNCurranJE 2009 Chemerin is associated with metabolic syndrome phenotypes in a Mexican-American population. J Clin Endocrinol Metab 94 3085 3088
43. WeigertJNeumeierMWanningerJFilarskyMBauerS 2010 Systemic chemerin is related to inflammation rather than obesity in type 2 diabetes. Clin Endocrinol (Oxf) 72 342 348
44. StejskalDKarpisekMHanulovaZSvestakM 2008 Chemerin is an independent marker of the metabolic syndrome in a Caucasian population–a pilot study. Biomed Pap Med Fac Univ Palacky Olomouc Czech Repub 152 217 221
45. BozaogluKCurranJEStockerCJZaibiMSSegalD 2010 Chemerin, a novel adipokine in the regulation of angiogenesis. J Clin Endocrinol Metab 95 2476 2485
46. AsanoKMatsushitaTUmenoJHosonoNTakahashiA 2009 A genome-wide association study identifies three new susceptibility loci for ulcerative colitis in the Japanese population. Nat Genet 41 1325 1329
47. SilverbergMSChoJHRiouxJDMcGovernDPWuJ 2009 Ulcerative colitis-risk loci on chromosomes 1p36 and 12q15 found by genome-wide association study. Nat Genet 41 216 220
48. BarabasiALGulbahceNLoscalzoJ 2011 Network medicine: a network-based approach to human disease. Nat Rev Genet 12 56 68
49. SchadtEE 2009 Molecular networks as sensors and drivers of common human diseases. Nature 461 218 223
50. LangoAHEstradaKLettreGBerndtSIWeedonMN 2010 Hundreds of variants clustered in genomic loci and biological pathways affect human height. Nature 467 832 838
51. GohKICusickMEValleDChildsBVidalM 2007 The human disease network. Proc Natl Acad Sci U S A 104 8685 8690
52. KimJAWeiYSowersJR 2008 Role of mitochondrial dysfunction in insulin resistance. Circ Res 102 401 414
53. LowellBBShulmanGI 2005 Mitochondrial dysfunction and type 2 diabetes. Science 307 384 387
54. NisoliEClementiECarrubaMOMoncadaS 2007 Defective mitochondrial biogenesis: a hallmark of the high cardiovascular risk in the metabolic syndrome? Circ Res 100 795 806
55. RenJPulakatLWhaley-ConnellASowersJR 2010 Mitochondrial biogenesis in the metabolic syndrome and cardiovascular disease. J Mol Med 88 993 1001
56. HoustisNRosenEDLanderES 2006 Reactive oxygen species have a causal role in multiple forms of insulin resistance. Nature 440 944 948
57. TanGDNevilleMJLiveraniEHumphreysSMCurrieJM 2006 The in vivo effects of the Pro12Ala PPARgamma2 polymorphism on adipose tissue NEFA metabolism: the first use of the Oxford Biobank. Diabetologia 49 158 168
58. SpectorTDWilliamsFM 2006 The UK Adult Twin Registry (TwinsUK). Twin Res Hum Genet 9 899 906
59. HanneliusUGhermanLMakelaVVLindstedtAZucchelliM 2007 Large-scale zygosity testing using single nucleotide polymorphisms. Twin Res Hum Genet 10 604 625
60. DaiMWangPBoydADKostovGAtheyB 2005 Evolving gene/transcript definitions significantly alter the interpretation of GeneChip data. Nucleic Acids Res 33 e175
61. WuZIrizarryRAGentlemanRMartinez-MurilloFSpencerF 2004 A Model Based Background Adjustment for Oligonucleotide Expression Arrays
62. The Wellcome Trust Case Control Consortium 2007 Genome-wide association study of 14,000 cases of seven common diseases and 3,000 shared controls. Nature 447 661 678
63. WuHKerrKCuiXChurchillGA 2002 MAANOVA: A software package for the analysis of spotted cDNA Microarray Experiments. ParmigianiGGarettES The analysis of gene expression data Springer-Verlag 313 341
64. ZhangBHorvathS 2005 A general framework for weighted gene co-expression network analysis. Stat Appl Genet Mol Biol 4 Article17
65. LangfelderPZhangBHorvathS 2008 Defining clusters from a hierarchical cluster tree: the Dynamic Tree Cut package for R. Bioinformatics 24 719 720
66. HuangWShermanBTTanQKirJLiuD 2007 DAVID Bioinformatics Resources: expanded annotation database and novel algorithms to better extract biology from large gene lists. Nucleic Acids Res 35 W169 W175
67. HuZMellorJWuJDeLisiC 2004 VisANT: an online visualization and analysis tool for biological interaction data. BMC Bioinformatics 5 17
68. BatesD 2005 (2005) R News 5 : 1. http://cran.r-project.org/doc/Rnews/Rnews_2005-1.pdf
Štítky
Genetika Reprodukční medicínaČlánek vyšel v časopise
PLOS Genetics
2012 Číslo 2
Nejčtenější v tomto čísle
- Gene Expression and Stress Response Mediated by the Epigenetic Regulation of a Transposable Element Small RNA
- Contrasting Properties of Gene-Specific Regulatory, Coding, and Copy Number Mutations in : Frequency, Effects, and Dominance
- Homeobox Genes Critically Regulate Embryo Implantation by Controlling Paracrine Signaling between Uterine Stroma and Epithelium
- Nondisjunction of a Single Chromosome Leads to Breakage and Activation of DNA Damage Checkpoint in G2