
Genomic Networks of Hybrid Sterility
Hybrid dysfunction, a common feature of reproductive barriers between species, is often caused by negative epistasis between loci (“Dobzhansky-Muller incompatibilities”). The nature and complexity of hybrid incompatibilities remain poorly understood because identifying interacting loci that affect complex phenotypes is difficult. With subspecies in the early stages of speciation, an array of genetic tools, and detailed knowledge of reproductive biology, house mice (Mus musculus) provide a model system for dissecting hybrid incompatibilities. Male hybrids between M. musculus subspecies often show reduced fertility. Previous studies identified loci and several X chromosome-autosome interactions that contribute to sterility. To characterize the genetic basis of hybrid sterility in detail, we used a systems genetics approach, integrating mapping of gene expression traits with sterility phenotypes and QTL. We measured genome-wide testis expression in 305 male F2s from a cross between wild-derived inbred strains of M. musculus musculus and M. m. domesticus. We identified several thousand cis - and trans-acting QTL contributing to expression variation (eQTL). Many trans eQTL cluster into eleven ‘hotspots,’ seven of which co-localize with QTL for sterility phenotypes identified in the cross. The number and clustering of trans eQTL—but not cis eQTL—were substantially lower when mapping was restricted to a ‘fertile’ subset of mice, providing evidence that trans eQTL hotspots are related to sterility. Functional annotation of transcripts with eQTL provides insights into the biological processes disrupted by sterility loci and guides prioritization of candidate genes. Using a conditional mapping approach, we identified eQTL dependent on interactions between loci, revealing a complex system of epistasis. Our results illuminate established patterns, including the role of the X chromosome in hybrid sterility. The integrated mapping approach we employed is applicable in a broad range of organisms and we advocate for widespread adoption of a network-centered approach in speciation genetics.
Published in the journal:
. PLoS Genet 10(2): e32767. doi:10.1371/journal.pgen.1004162
Category:
Research Article
doi:
https://doi.org/10.1371/journal.pgen.1004162
Summary
Hybrid dysfunction, a common feature of reproductive barriers between species, is often caused by negative epistasis between loci (“Dobzhansky-Muller incompatibilities”). The nature and complexity of hybrid incompatibilities remain poorly understood because identifying interacting loci that affect complex phenotypes is difficult. With subspecies in the early stages of speciation, an array of genetic tools, and detailed knowledge of reproductive biology, house mice (Mus musculus) provide a model system for dissecting hybrid incompatibilities. Male hybrids between M. musculus subspecies often show reduced fertility. Previous studies identified loci and several X chromosome-autosome interactions that contribute to sterility. To characterize the genetic basis of hybrid sterility in detail, we used a systems genetics approach, integrating mapping of gene expression traits with sterility phenotypes and QTL. We measured genome-wide testis expression in 305 male F2s from a cross between wild-derived inbred strains of M. musculus musculus and M. m. domesticus. We identified several thousand cis - and trans-acting QTL contributing to expression variation (eQTL). Many trans eQTL cluster into eleven ‘hotspots,’ seven of which co-localize with QTL for sterility phenotypes identified in the cross. The number and clustering of trans eQTL—but not cis eQTL—were substantially lower when mapping was restricted to a ‘fertile’ subset of mice, providing evidence that trans eQTL hotspots are related to sterility. Functional annotation of transcripts with eQTL provides insights into the biological processes disrupted by sterility loci and guides prioritization of candidate genes. Using a conditional mapping approach, we identified eQTL dependent on interactions between loci, revealing a complex system of epistasis. Our results illuminate established patterns, including the role of the X chromosome in hybrid sterility. The integrated mapping approach we employed is applicable in a broad range of organisms and we advocate for widespread adoption of a network-centered approach in speciation genetics.
Introduction
To understand patterns of biodiversity, it is essential to characterize the processes by which new species arise and are maintained in nature, including ecological specialization, population differentiation and reproductive isolation. Genetic dissection of reproductive isolation has proven to be an especially powerful strategy for revealing mechanisms of speciation. Many genomic regions and even specific genes that contribute to hybrid defects have been identified by genetic mapping in recombinant populations [1]–[7]. Divergence in gene regulation is expected to contribute to reproductive isolation between nascent species, and studies with F1 hybrids support this prediction [8]–[13]. Importantly, these two approaches – genetic mapping and measurement of genome-wide expression patterns in hybrids – have yet to be combined directly in the context of speciation.
Hybrid sterility and hybrid inviability frequently result from negative epistasis between mutations at interacting genes [14]–[16]. This “Dobzhansky-Muller model” predicts that disruptions in gene networks should be common in hybrids. By integrating organismal phenotypes and genotypes with gene expression patterns, this prediction can be tested. Despite the identification of hybrid incompatibility genes in several species and the prevalence of the Dobzhansky-Muller model, the nature and complexity of hybrid incompatibility networks remains poorly understood. Do hybrid incompatibilities generally involve two loci or are higher order interactions common? Are incompatibilities independent or do they share some common loci? Is the genetic architecture of hybrid defects similar among taxa? Known incompatibility genes have provided the first hints about these questions, particularly in Drosophila [6], yet too few genes and taxa are represented to determine whether there are generalities underlying the speciation process. A network perspective should provide insights into the genetics of reproductive isolation that are difficult to obtain using a gene-by-gene approach.
The house mouse (Mus musculus) is an excellent model for investigating speciation from a network perspective. Genomic resources are abundant for the house mouse, and reproductive processes are well characterized because the mouse is the premier model for fertility research in humans [17]. House mouse subspecies are in the early stages of speciation, showing significant but incomplete reproductive isolation. Evidence for hybrid male sterility in laboratory crosses [5], [18]–[22] and in natural zones of hybridization [23], [24] suggests it is a primary isolating barrier between these nascent species.
Studies of sterility in F1 hybrids between Mus musculus domesticus and Mus musculus musculus (subsequently referred to as domesticus and musculus) revealed an important role for the X chromosome and identified several contributing autosomal loci [4], [5], [25], [26]. One of these loci is Prdm9, a histone methyltransferase [27]. Hybrids with some alleles of Prdm9 from domesticus show pachytene arrest of meiosis. The effects of sterile Prdm9 alleles appear to be due to mutations in the protein-coding sequence and there is evidence for downstream regulatory effects, but the incompatibility network involving Prdm9 has not been revealed.
Genetic mapping of sterility phenotypes in F2 hybrids between M. m. domesticus and M. m. musculus recently identified an additional set of autosomal loci, which are predominantly recessive and thus contribute to sterility in second generation and subsequent hybrids. Genetic architectures of F2 sterility traits are complex, involving a moderate number of loci with a range of phenotypic effect sizes [1].
Genome-wide studies of gene expression in testis of F1 hybrids provide evidence that sterility is associated with disrupted expression [9], [10]. Like sterility phenotypes, expression patterns in hybrids depend on the origins of parental strains, and the direction of the cross. In many cases, testis expression in hybrids is intermediate between parental strains [9]–[11]. However, extensive misexpression (expression outside the range observed in parental strains) has been documented in a few crosses. Comparison of testis gene expression patterns between reciprocal F1 musculus-domesticus hybrids showed that many X-linked genes are overexpressed in sterile but not in fertile F1s [10]. To our knowledge, gene expression patterns in testes from F2 and later generation hybrids have not been described.
Here, we integrate analysis of genome-wide expression in testis from F2 musculus-domesticus hybrids with results from a previous study mapping sterility phenotypes in the same individuals [1]. We show that sterility is associated with large-scale alterations in gene expression in F1s and F2s, and we identify quantitative trait loci (QTL) that cause X chromosome-wide overexpression in hybrids. We report expression quantitative trait loci (eQTL) for a large number of transcripts. We compare the locations of eQTL with sterility QTL, and identify disrupted processes during spermatogenesis based on affected networks. Using a conditional mapping approach, we pinpoint genetic interactions affecting expression. We highlight candidate pathways, processes, and interactions for several loci, which provide insight into the mechanisms underlying their contributions to sterility.
Results
Gene misexpression in testes of F1 and F2 hybrids
We measured levels of misexpression in F1 and F2 hybrids to identify major alterations in gene expression pattern associated with sterility in M. m. domesticus (WSB/EiJ; hereafter domesticusWSB) - M. m. musculus (PWD/PhJ; hereafter musculusPWD) hybrids. Sterility is asymmetric in these crosses: F1 males with musculusPWD mothers (hereafter MxD F1s) are almost always completely sterile whereas F1s with domesticusWSB mothers (hereafter DxM F1s) are fertile [1]. MxD F1 males showed significant differences from both parents for all reproductive traits measured. By contrast, all traits in DxM F1s (except seminiferous tubule area) were within the range observed in the parental lines. Trait measurements in MxD F1s and DxM F1s provide ‘fertile’ and ‘sterile’ examples that are useful for assessing trait distributions in F2s.
Misexpression was markedly higher in testis of MxD F1s (18.8% transcripts; Fig. 1A) than in DxM F1s (1.6%). In both F1s, levels of misexpression were higher for X-linked transcripts than autosomal transcripts. On the X chromosome, the number of overexpressed transcripts in MxD F1s was much higher than the number of underexpressed transcripts (25.9% over, 4.4% under). The level of underexpression was higher on autosomes, but the difference between levels of over - and underexpression was smaller (7.1% over, 11.3% under). These results are consistent with previously reported differences in expression patterns between sterile and fertile F1s [10].

Misexpression in F2s varied from 0.9–39.0% transcripts (median 2.1%; Fig. 1A), encompassing the levels observed in fertile and sterile F1s. There was substantial overlap between transcripts misexpressed in MxD F1s and in >5% of F2s (Fig. 1B) yet a large proportion of transcripts were misexpressed only in F1s or F2s. The relatively continuous distribution of misexpression in F2s and lack of recapitulation of the full F1 misexpression pattern indicates multiple genetic factors contribute to misexpression. Misexpression unique to F2s suggests some contributing loci act recessively.
A large proportion of X-linked transcripts were negatively correlated with testis weight (lower testis weight = higher expression) – opposite of the pattern for autosomal transcripts, a majority of which was positively correlated with testis weight (Fig. 1C). This result suggests that – as in sterile F1s – the X may be broadly overexpressed in sterile F2s.
To determine whether the level of misexpression was consistent throughout spermatogenesis, we compared patterns of expression in F1 and F2 hybrids among genes identified as specific/enriched to different spermatogenic cell types in previous studies [28]. Autosomal transcripts expressed in meiotic and post-meiotic cells are underexpressed in sterile MxD F1s, and transcripts specific to somatic and mitotic cells are overexpressed (Table S1). This pattern is consistent with reduced spermatogenesis, as expected based on sterility phenotypes. The X chromosome is transcriptionally silenced during meiosis (meiotic sex chromosome inactivation MSCI; [29], [30]), and thus lacks transcripts associated with meiotic cells. X-linked transcripts associated with other testis cell types showed patterns consistent with autosomal transcripts; somatic and mitotic transcripts tended to be overexpressed and the few underexpressed transcripts were predominantly postmeiotic. Misexpression patterns across spermatogenic cell types in F2 hybrids were consistent with patterns in sterile F1s.
Misexpression QTL
Our experimental design allowed us to map QTL that contribute to misexpression in F2s. We identified two QTL controlling the number of overexpressed X-linked transcripts on chromosomes 17 (8 cM, 18.46 Mb, 1.5-LOD interval 0–29.85 Mb; Fig. 1D) and X (14.98 cM, 61.02 Mb, 1.5-LOD interval 0–71.69 Mb). There were no significant QTL for the number of misexpressed autosomal transcripts. However, on both chromosomes 17 and X, there were peaks below the significance threshold within the 1.5-LOD intervals of the X-overexpression QTL. Similarity between X - and autosomal patterns suggests these QTL may contribute to misexpression genome-wide.
The overexpression QTL we identified on the X chromosome is in the same region associated with overexpression of a set of X-linked transcripts in a recent study using introgression lines carrying regions of the X chromosome from musculusPWK (closely related to musculusPWD) on a domesticus background [31]. Studies of F1 hybrid sterility have identified a key incompatibility between chromosomes 17 and X [4]. A comparison of X overexpression levels for mice with different two-locus genotypes at the chromosome 17 and X QTL is shown in Figure 1E. Consistent with the pattern in F1s, X overexpression was highest in individuals with a musculusPWD allele on the X that were heterozygous at the chromosome 17 QTL (F5,290 = 11.06, p = 9.2×10⁻¹⁰; t 17het:Xmusculus interaction term = 3.0, p = 0.0031). Interestingly, high levels of overexpression were also observed in individuals with the musculusPWD allele on the X and homozygous for the musculusPWD chromosome 17 allele. These mice had the same genotype as the musculusPWD parental strain at both loci, implying the existence of a domesticusWSB allele elsewhere in the genome involved in a multilocus interaction with the X and 17 QTL.
Interpreting gene expression patterns from whole testis is complicated because differences in measured expression levels reflect changes in the relative cell-type composition of the tissue in addition to changes in per-cell expression levels [10]. Because the number of postmeiotic cells in sterile F2 hybrids was reduced [1], apparent underexpression of postmeiotic genes and overexpression of mitotic genes was expected. Misexpression patterns may be caused by changes in cell composition, changes in gene regulation, or both.
Testis expression quantitative trait loci (eQTL)
Next, we investigated the genetic basis of gene expression variation in individual transcripts. We identified 16,705–36,753 eQTL, depending on the significance criterion (Table 1). We used a permissive threshold, based on permutation of a single transcript, for downstream analyses because our goal was to identify genome-scale patterns. It is important to note that the false-positive rate among individual eQTL identified using this criterion is high, particularly for trans eQTL.
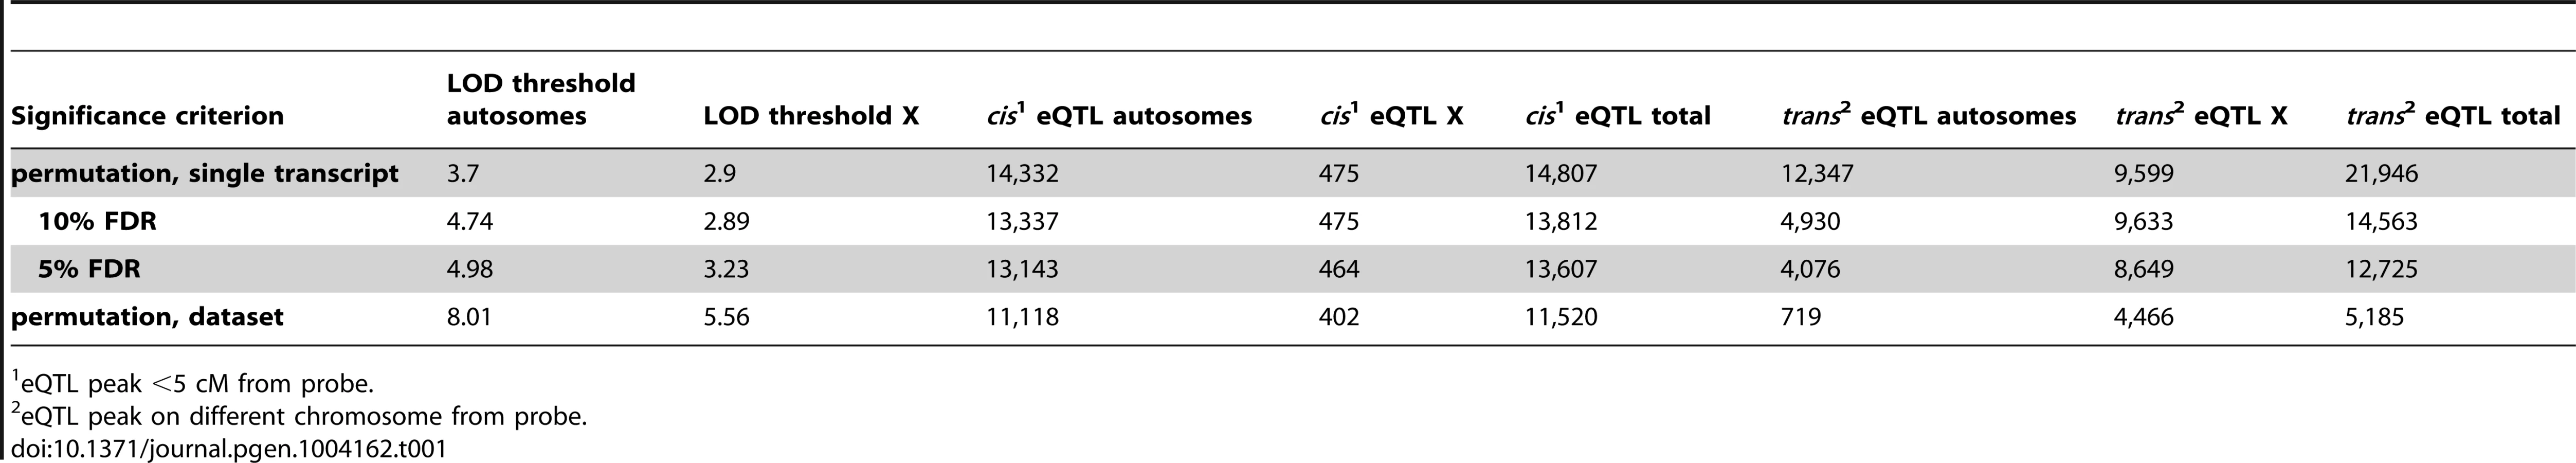
The genomic positions of the eQTL and the affected transcripts are shown in Figure 2. eQTL located near the quantitative trait transcript (QTT) comprise the prominent diagonal stripe, a pattern typical of eQTL studies [32]–[34]. These proximal eQTL are likely to be cis regulatory elements [33], [35]. We refer to proximal eQTL as cis eQTL for convenience, although it is possible that they might not act solely in cis (by regulating alleles only if they are on the same DNA strand). We classified eQTL with peaks within 5 cM of the transcript (probe) position as cis eQTL and eQTL located on a different chromosome from the transcript as trans. We ignored eQTL>5 cM on the same chromosome, because this class might include long-distance cis eQTL in addition to trans eQTL. We identified cis eQTL for 60% of transcripts (14,807; Table 1) and at least one trans eQTL for 56.7% (13,997) transcripts. The number of trans eQTL identified per transcript ranged from one (8,092; 32.8% transcripts) to seven (3; 0.01% transcripts).

We next examined eQTL dominance and effect size. Most cis eQTL (93.8%; Fig. S1A) were additive (mean for heterozygotes is intermediate and >2 standard errors from both homozygous means – see Methods). In contrast, a substantial proportion of trans eQTL were dominant (37.1%), underdominant (9.2%), or overdominant (8.6%). Curiously, musculusPWD alleles were more likely to be dominant among cis (473/859; 55.1%) and trans eQTL (2,850/4,580; 62.2%). We cannot think of an experimental or biological explanation for this bias. The two categories of eQTL differed in effect size (Fig. S1B). The difference in expression level between genotype classes was larger on average for cis eQTL than for trans eQTL (t = 72.3 (d.f. = 15931), P<2.2×10⁻¹⁶). The difference in effect size is also apparent when comparing the peak LOD scores of cis (mean = 25.05) and trans eQTL (mean = 5.94).
We tested for clustering of trans eQTL, which is commonly observed in eQTL analyses [36]–[38]. Some of these ‘trans hotspots’ are visible as vertical bands in the eQTL heatmap (Fig. 2). We identified 12 genomic regions significantly enriched for trans eQTL using a sliding window analysis (P<0.05, permutation test; Table 2). Two adjacent hotspots on chromosome 10 were combined for simplicity in downstream analyses. The most striking pattern was observed for the X chromosome: most of the X was significantly enriched for trans eQTL and 8,286 autosomal transcripts (34.6%) had eQTL mapped to the proximal X hotspot (0–42 cM). We discuss the massive effect of the X on gene expression in detail below, and relate this pattern to the known importance of the X in hybrid male sterility.

The genomic distribution of eQTL we identified, as well as differences in dominance and effect sizes between cis and trans eQTL, are broadly consistent with patterns previously described in eQTL studies performed in a variety of (non-hybrid) organisms (e.g. humans: [37], [39]; C. elegans: [36], [40], [41]; Arabidopsis: [32], mice: [42]. This consistency indicates that misexpression and differences in expression level due to altered cell-composition associated with sterility phenotypes were not so severe that they obscured quantitative expression differences between musculusPWD and domesticusWSB.
Trans eQTL hotspots are related to hybrid sterility
Testis eQTL could be related to hybrid sterility or to subspecific differences in gene expression that are independent of hybrid incompatibilities. To distinguish these possibilities, we repeated the eQTL analysis for a subset of F2s without strong evidence for hybrid sterility, and compared the results to patterns arising when all individuals were included in the mapping. The number of cis eQTL was very similar between samples; we identified 14,501 cis eQTL in the fertile sample and 14,807 cis eQTL using all individuals. By contrast, patterns of trans eQTL showed striking differences between the fertile subset and the full dataset. The number of trans eQTL identified (13,652; 7,812 autosomal; 5,839 X) in fertile mice was much lower than in the complete sample (21,946; 12,347 autosomal; 9,599 X). Moreover, clustering of trans eQTL was dramatically reduced when only fertile individuals were included (Fig. S2). These results suggest trans eQTL, and in particular trans hotspots, are related to sterility whereas cis eQTL largely reflect subspecific/strain differences in expression. Consequently, expression patterns associated with hotspots – like testis weight, sperm count and other traditional reproductive measures – can be treated as sterility phenotypes.
To further investigate associations between trans hotspots and sterility, we inferred a “sterile allele” for each hotspot as the allele matching the sterile MxD F1 pattern and/or showing lower expression of meiotic/postmeiotic transcripts (Table 2). The hotspot on chromosome 17 showed an unusual pattern. A majority of eQTL in the hotspot were over - or underdominant (Fig. 3A) and the heterozygous genotypic class shows evidence for sterility, consistent with the underdominant testis weight QTL at the same position. For additive/dominant eQTL, the musculusPWD genotypic class appeared to be associated with sterility. As we discussed above, both genotypic classes were also associated with overexpression on the X.

The two trans hotspots on the X chromosome showed different patterns. The musculusPWD allele at eQTL in the proximal hotspot was associated with the ‘sterile’ expression pattern (Table 2). For example, a substantial proportion of QTT associated with the X hotspots were misexpressed in sterile MxD F1s (32.5% X-hotspot QTT vs. 17.3% all autosomal transcripts), with the effect of the musculusPWD allele consistent with the direction of misexpression. In contrast, the domesticusWSB allele was associated with the sterile pattern in the distal hotspot. Correlations between expression levels of QTT and relative right testis weight provided further corroboration for the inferred sterile alleles for the X hotspots. We expected that the sterile allele would cause lower expression of QTT that were positively correlated with testis weight (lower expression with lower testis weight) and higher expression of QTT negatively correlated with testis weight (higher expression with lower testis weight). Most QTT (83.2%) with lower expression caused by the musculusPWD allele at eQTL in the proximal hotspot were positively correlated with testis weight, and most eQTL in the distal hotspot showed the opposite pattern (64.0% negatively correlated). The converse was observed for low-expression domesticusWSB alleles (87.9% QTT in proximal hotspot negatively correlated; 74.0% QTT in distal hotspot positively correlated).
Seven of eleven trans hotspots overlapped one or more sterility QTL identified previously in this cross [1] (Table 2; Fig. S2). A total of 99.5 cM was located in a trans hotspot and within the 1.5-LOD interval of a sterility QTL (P = 0.02, 10,000 permutations of trans hotspot positions). For five of seven hotspots overlapping sterility QTL, the sterile allele identified on the basis of expression pattern matched the sterility QTL allele (Table 2), suggesting the underlying causative gene(s) for expression variation and the sterility phenotypes might be shared. One exception is on chromosome 15. The 1.5-LOD interval for a total abnormal sperm QTL overlapped the trans hotspot, however the QTL peak (4 cM) was relatively far from the hotspot (18–38 cM; Fig. S2). The second exception was a sperm head-shape QTL (musculusPWD allele sterile) that overlaps the distal-X hotspot (domesticusWSB allele sterile). This region likely harbors sterility QTL from musculusPWD and domesticusWSB, providing additional evidence that the role of the X in sterility is complex.
For the present study, we focus on the dramatic patterns of trans eQTL and the unexpected association between trans hotspots and sterility. We acknowledge that cis eQTL may play an important role in hybrid sterility and we anticipate they will be useful in future studies to identify and evaluate candidate sterility genes.
Functional annotation of trans eQTL hotspots
Characterizing the QTT affected by each hotspot will provide clues about how the underlying genes disrupt fertility. We used DAVID functional annotation [43], [44] to identify classes of genes enriched among QTT with higher or lower expression in individuals with the sterile genotype at each hotspot. Overall, more gene classes were significantly enriched among QTT with higher expression associated with the sterile allele (Table 3). Many of these classes represent basic cell functions including lipid synthesis and metabolism, mitochondrion, and amino acid metabolism (chromosome 11, 15 proximal, 17, X proximal hotspots). Another general pattern was higher expression of classes related to receptors, signaling (e.g. transmembrane, glycoprotein, protein kinase-C binding) and specific signaling pathways (PPAR signaling pathway, regulation of MAPKKK cascade).

As expected, gene classes with clear links to sterility phenotypes were enriched among QTT with lower expression in sterile genotypic classes. The two hotspots coincident with regions known to have major roles in F1 sterility showed lower expression of broad categories, including spermatogenesis (chromosome 17), sexual reproduction (X 0–42 cM), and fertilization (X 0–42 cM), as well as classes suggesting more specific sterility-related functions, including microtubule organizing center (chromosome 17) and flagellum/microtubule-associated flagellum (X 0–42 cM). The chromosome-10 hotspot is coincident with an abnormal sperm morphology QTL (proximal bent tail; [1]); lower expression of microtubule genes associated with the sterile domesticusWSB allele is a promising lead for identifying specific disruptions in spermatogenesis.
As discussed above, gene expression measures from whole testis reflect both absolute (per-cell) expression variation and relative expression variation caused by differences in cell-type composition. Genes underlying trans hotspots might (1) directly regulate expression of many genes, (2) indirectly affect gene regulation by disrupting an upstream pathway/process, or (3) directly/indirectly cause a change in testis cell composition resulting in altered relative expression of genes from different cell types. We were concerned that many sterility loci might cause similar changes in cell-type composition, in which case annotating hotspots might not be useful for characterizing the function and identify of specific causative genes. If there were a general ‘sterile’ expression pattern we would expect eQTL to be shared across hotspots, particularly for QTT associated with QTL for the same sterility phenotype. In contrast, most QTT with eQTL in hotspots were associated with a single hotspot (8,093/11,904). Variation among QTT associated with different trans hotspots and sterility QTL indicates that annotation of these QTT will be informative about functions of individual sterility genes with effects on gene regulation or cell composition. Candidate genes in each hotspot with known roles in male reproduction and/or gene regulation are listed in Table 4.

Genetic interactions identified by conditional mapping of eQTL
The Dobzhansky-Muller model predicts that each hybrid sterility locus will have one or more interaction partners. Mapping of genetic interactions generally requires sample sizes larger than the 305 F2s analyzed here. To increase power, we treated trans eQTL hotspots as candidate hybrid sterility loci and searched for interactions involving them. We performed conditional mapping of eQTL, using genotypes at candidate loci one at a time as covariates. Genotype covariates included the marker closest to the peak of each of the nine autosomal trans eQTL hotspots, and five markers in the X chromosome trans hotspots (Table 5). For each covariate, mapping was performed twice, including an additive effect or both an additive and interactive effect; eQTL from the full model that showed a significant increase in LOD score over the additive model were classified as significant interaction eQTL.

Clustering of interaction eQTL identified by conditional mapping was even more pronounced than clustering of trans eQTL in the initial (no covariate) eQTL analysis (Fig. S3). We identified ‘interaction hotspots’ using significance thresholds from permutation for each genotype covariate. Integrating results from the conditional mapping analyses reveals a complex epistatic network showing several general patterns (Fig. 4). The large number of interactions involving the X is consistent with its substantive effect on expression pattern and sterility phenotypes. There are many interactions between loci in trans hotspots, and between trans hotspots and sterility QTL, suggesting that some incompatibilities contribute to multiple phenotypes. Overall, a large proportion of interactions are associated with sterility loci. It is important to note that many interactions may be associated with variation in gene expression unrelated to hybrid sterility.

The interactions we identified include X-autosome pairs previously associated with hybrid sterility. We identified interaction hotspots in the proximal region of chromosome 17, which encompasses Prdm9, from conditional mapping using all X-linked genotype covariates; conversely, mapping conditional on Chr17@13 cM identified a hotspot on the proximal X (Fig. S4). Previous mapping of sterility phenotypes conditional on X genotypes revealed interactions between the X and six autosomal regions on four chromosomes (3, 5, 7, 10), contributing to five sperm morphology phenotypes [1]. We found interaction hotspots involving at least one X-linked covariate overlapping each of these autosomal regions.
Each trans hotspot identified in the original analysis overlapped at least one interaction hotspot mapped with an autosomal covariate, indicating autosome-autosome interactions contribute substantially to expression variation. All of these interactions are novel. Interactions between regions with sterile alleles from the same subspecies are prevalent (Fig. 5), suggesting incompatibilities involving more than two loci are common.

Conditional mapping revealed additional associations between gene expression variation and sterility. Some sterility QTL that did not overlap a trans hotspot identified in the original analysis showed evidence for interaction with one or more hotspot regions (Fig. S4). We also found interactions with sterility QTL for each of the trans hotspots that do not overlap sterility QTL. The relative contribution of loci to expression variation with detectable marginal effects versus eQTL identified only when incorporating interactions varied (Table 5). The structure of the interaction network provides additional support for the important roles of chromosomes X and 17, the major players in F1 sterility (Figs. 4; 5). By contrast, the chromosome 6 region plays a prominent role in the interaction network (Fig. 5), which was unanticipated on the basis of relatively modest enrichment of eQTL in the trans hotspot and the lack of sterility phenotype QTL on chromosome 6.
We identified several novel loci that interact with multiple trans hotspots but did not have previous evidence for involvement in sterility (Fig. S4). Regions on chromosomes 7 (50–52 cM; 122.63–125.77 Mb), 13 (32–36 cM; 68.47–75.96 Mb), 14 (40–44 cM; 87.59–97.00 Mb) and 16 (0–4 cM; 11.20–20.02 Mb) had overlapping interaction hotspots identified by mapping with genotype covariates from trans hotspots on at least three chromosomes. These results indicate that some loci in the interaction network have marginal effects undetectable using single-QTL models and permutation thresholds.
Discussion
The Dobzhansky-Muller model of reproductive isolation has been well accepted for decades but relatively few incompatible loci and even fewer interactions are known. Due to the central role of negative epistasis in hybrid defects, disruptions in gene networks are likely to be common in hybrids [45]–[47]. Inspired by recent ‘systems genetics’ studies that integrate phenotype, genotype, and gene expression data to reconstruct gene networks and infer relationships between perturbations in networks and deleterious traits [48], [49], we mapped expression traits in an F2 cross between house mouse subspecies. We combined expression-mapping results with knowledge of QTL for sterility phenotypes in the same cross to identify altered expression patterns reflecting disruptions in networks causing sterility.
The role of gene regulation differences in hybrid sterility
The importance of evolutionary changes in transcriptional regulation for adaptation has long been recognized [e.g. 50]–[53]. Recent studies of gene expression in hybrids suggest regulatory evolution may also be an important cause of reproductive isolation between diverging populations. Misexpression has been reported in hybrids from many animal and plant taxa including Drosophila [8], [12], [54], mice [9]–[11], [55], African clawed frogs [13], [56], whitefish [57], copepods [58], maize [59], ragwort [60] and Arabidopsis [61]. Furthermore, several known hybrid incompatibility genes affect transcription of other genes, including OdsH [12] and the mouse sterility gene Prdm9 [27]. Our expression data from F1 and F2 hybrids show male sterility is associated with major alterations in genome-wide expression patterns. Clustering of trans eQTL is much less pronounced when mapping is restricted to fertile mice (Fig. S2), indicating trans hotspots in particular are associated with sterility. Each of the trans hotspots we identified overlaps a sterility QTL and/or interacts with at least one region containing a sterility QTL. One interpretation of this pattern is that divergent alleles with major effects on expression patterns are likely to cause hybrid incompatibilities. Trans regulators of gene expression must coordinate properly with cis regulators and other trans factors. The number and broad genomic distribution of regulated genes and co-factors provide many potential opportunities for incompatible interactions resulting in deleterious phenotypes in hybrids. Misexpression of a gene could result from a change in the set of positive or negative regulatory factors, or a mismatch in the spatiotemporal availability of these factors and the timing of expression. This hypothesis suggests genes in interacting regions with large cis eQTL and/or major alterations in spatiotemporal expression pattern between subspecies should be prioritized as candidates.
The role of the X chromosome in hybrid male sterility
Numerous studies of F1 hybrid sterility and evidence for reduced gene flow in hybrid zones have shown that the X chromosome plays a central role in hybrid male sterility in house mice [5], [62]–[65]. Our expression mapping results in F2s show that the X has a massive effect on testis gene expression, providing support for an important role of the X beyond the F1 generation. Most of the X chromosome is significantly enriched for QTL affecting expression of autosomal genes.
The musculusPWD allele in the proximal X hotspot (10.16 Mb–101.19 Mb) has effects on expression suggestive of sterility (Table 2), consistent with the well-documented role of the musculus X in F1 sterility. This region harbors the largest-effect QTL identified for testis weight, sperm count, abnormal sperm head morphology, and number of offspring in X introgression experiments [25], [66]. Genes with functions related to fertility (sexual reproduction, fertilization, flagellum) were enriched among the QTT with low expression caused by the musculusPWD allele (Table 3).
By contrast, the distal X hotspot shows little similarity to patterns observed in sterile F1 males. The distal hotspot overlaps several sterility QTL identified in Xmusculus introgression experiments (Supp. Table S2), but the domesticusWSB allele at hotspot eQTL is associated with the sterile expression pattern. These results reveal the presence of at least one novel locus on the X contributing to expression variation and potentially F2 sterility (Tables 2, S2). Fertility of DxM F1s, which carry the domesticusWSB X, and lack of enrichment of the distal hotspot QTT for transcripts misexpressed in F1s, indicate this locus interacts with one or more recessive musculusPWD autosomal loci. DNA-binding genes are enriched among QTT with higher expression, raising the possibility that the distal locus controls expression of regulatory genes, and the role in sterility is indirect.
Variation within the trans hotspots on the X suggests each may harbor more than one sterility gene. The number of eQTL mapped, and the proportions of QTT with sterility-related characteristics, varied within the proximal and distal hotspots (Table S2). Furthermore, comparison of conditional mapping results using different markers on the X as covariates reveals differences in interaction patterns (Fig. S5).
The mechanism of sterility caused by the proximal Xmusculus
Several mechanisms have been proposed for hybrid defects caused by the X. In each case, de-repression of X-linked genes normally transcriptionally silenced during and after meiosis is implicated, but the proposed cause and timing of de-repression differ.
Expression of X - and Y-linked genes is suppressed during meiosis in mice [29], [30]. Meiotic sex chromatin inactivation (MSCI) is essential for spermatogenesis. Mouse models with mutations in MSCI genes show meiotic arrest during the pachytene stage [30]. Overexpression of X-linked genes has been documented in F1 studies involving multiple strains [10], [26]. Good and colleagues [10] proposed that overexpression might be related to disrupted MSCI. Measurement of a subset of the overexpressed genes in enriched populations of different testis cell types showed that overexpression was first observed in primary spermatocytes, consistent with the onset of MSCI [31].
The dramatic overexpression of the X observed in F1 and F2 hybrids documented here is consistent with failed MSCI. We identified QTL on chromosomes 17 and X for the number of overexpressed X-linked transcripts in an individual. The peak of the QTL on chromosome 17 is coincident with the sterility gene Prdm9 and overexpression is caused by heterozygosity at this locus, consistent with maximal sterility effects in individuals heterozygous at Prdm9 [67]. The QTL on the X overlaps the musculus X region with the strongest overexpression effects in introgression lines [68]. The peak in number of trans eQTL we mapped in F2s is coincident with the X-overexpression QTL, suggesting effects on expression of autosomal genes are related to overexpression of the X.
A recent investigation of sterility mechanisms in F1 hybrids harboring the sterile allele of Prdm9 documented extensive asynapsis during meiosis, and subsequent meiotic checkpoint failure and arrest [26]. Analysis of intersubspecific chromosome substitution strains showed that heterospecific chromosome pairing was a preexisting condition of asynapsis. Prdm9 heterozygosity and a musculus X were necessary but not sufficient for the full meiotic arrest phenotype. The authors propose that interaction between these loci regulates the stability of pairing between heterospecific chromosomes. Expression of several sex-linked genes during meiosis in these F1 hybrids indicates MSCI is disrupted. The authors suggest MSCI failure is a consequence of asynapsis.
Asynapsis of heterospecific chromosomes is unlikely to cause failure of MSCI in F2s. Chromosome pairs in F2s harbor both conspecific and heterospecific regions, which should enable synapsis in most cases because only one crossover per chromosome arm is required to maintain pairing [69]. Moreover, complete meiotic arrest was rarely observed in F2s [1], and the most severe arrest phenotype observed in musculusPWD×domesticusB6 F1s was not seen in our MxD F1s. Taken together, results of sterility phenotype and expression mapping in F2s suggest the Prdm9-X interaction contributes to sterility through mechanisms beyond asynapsis.
Many sex-linked genes remain silenced into spermiogenesis. Disruptions in postmeiotic sex chromosome repression (PSCR) have also been associated with male sterility in mice. Derepression is caused by unbalanced copy numbers of multicopy X - and Y-linked regulatory genes [70], [71]. Expansion and increased copy number variation of some of these genes was observed in mice from a natural hybrid zone [72], suggesting unequal recombination in hybrids might exacerbate effects of copy-number imbalance on PSCR.
In contrast to previous F1 studies [10], [31], we did not find evidence for disrupted PSCR: there was no general pattern of overexpression of postmeiotic genes in F1 or F2 hybrids (Table S1). Decoupling of MSCI and PSCR suggests failed PSCR is not a necessary downstream consequence of disrupted MSCI [31]. Lack of disrupted PSCR in F2s is not surprising if Slx/Sly imbalance is the major cause because there is not a mismatch between subspecies in the critical regions; most (293/305) F2s in this study have a musculusPWD Y (because nearly all MxD F1s were sterile) and overexpression/sterility is associated with the musculusPWD allele in the proximal X, which overlaps the positions of Slx/Slxl. Lack of mismatch does not explain lack of PSCR in sterile MxD F1s, however, suggesting there is polymorphism for alleles causing copy number imbalance. QTL for abnormal sperm morphology, similar to phenotypes reported for Sly-deficient males [70], were identified on the X [1], indicating the X harbors multiple loci affecting post-meiotic spermiogenesis.
We propose that an interaction between loci on chromosome 17@13.3 cM (likely Prdm9) and X@15 cM disrupts MSCI, either directly or indirectly. De-repression has a cascading effect on meiotic expression of autosomal genes due to activity of X-linked transcriptional activators/suppressors at stages where they are normally silenced (Fig. 6). This model explains the co-localization of the X-overexpression QTL on the X with thousands of trans eQTL affecting expression of autosomal genes.

Chromosome-17 hotspot reveals novel insights about the role of Prdm9 in sterility
We identified a region on chromosome 17 with major effects on gene expression. Several lines of evidence implicate the known sterility gene Prdm9 as the underlying causative gene. First, the QTL for overexpression of X-linked transcripts (18.46 Mb) and the peak in number of trans eQTL within the chromosome-17 hotspot (14.69 Mb) are near Prdm9 (15.68 Mb; Fig. 3B). Second, eQTL in the chromosome-17 hotspot largely show under - or overdominant effects, in contrast to trans eQTL elsewhere in the genome, which are mostly additive or dominant (Fig. 3A). This pattern is consistent with results from F1 crosses showing the most severe sterility phenotypes occur in males heterozygous at Prdm9 [67]. Finally, we find evidence for interactions between the chromosome-17 region and a musculusPWD allele on the proximal X chromosome, consistent with F1 studies [4].
If Prdm9 is the causative gene, our eQTL results provide novel insights into its role in hybrid sterility and gene regulation. In addition to the known interaction with the X chromosome, we find evidence for interaction with each autosomal locus used as a mapping covariate (Figs. S4; 5). The large number of interacting loci suggests that the DNA-binding function of Prdm9, which regulates recombination hotspots globally [73], [74], might be directly related to its role in sterility. Each Prdm9-binding site represents a potential incompatibility partner. Alternatively, disrupted regulation caused by Prdm9 might have cascading effects resulting in altered expression genome-wide.
Although Prdm9 is predicted to have broad regulatory effects, previous evidence for effects on expression levels was limited to a small set of genes directly regulated by Prdm9 [27]. The combination of eQTL in the chromosome-17 hotspot (without covariates; Table 2) and eQTL dependent on interactions with eight autosomes and the X chromosome (Table 5) identifies 5,467 unique transcripts directly or indirectly affected by the region encompassing Prdm9.
Chromosome 17 harbors a second, more distal sterility locus, Hstws, from musculus [18]. Hstws is necessary, in addition to the sterile Prdm9domesticus allele and the musculus X, to observe complete meiotic arrest, the most severe F1 phenotype [67]. We identified interactions between both the Prdm9 region and a distal chromosome 17 region with chromosomes 2, 5, 10, and X (Fig. S4), suggesting loci on those chromosomes may be involved in the Prdm9 - Hstws incompatibility.
Candidate hybrid sterility genes
Overlap of sterility QTL with trans hotspots and/or interaction hotspots can refine estimates of the QTL position in some cases. For example, the trans hotspot on chromosome 17 is smaller than the coincident QTL for sperm count and testis weight (Fig. 3B). Moreover, the peak in number of trans eQTL is at the position closest to Prdm9. Chromosomes 5 and 10 are cases where trans eQTL and interaction eQTL patterns appear particularly useful in narrowing lists of candidate genes (Fig. S2)
Functional annotation of QTT identifies affected pathways and processes associated with some hotspots, and provide clues about the mechanisms underlying sterility. Chromatin-related genes were overrepresented among QTT with lower expression associated with the sterile domesticusWSB allele at the chromosome 11 hotspot (Table 3). Mouse knockout models for two additional genes with eQTL in this region have spermatogenesis defects that might be related to chromatin; males with null alleles at the transcription factor Crem (cAMP responsive element modulator) showed defective spermiogenesis with aberrant post-meiotic gene expression [75]. Lmna (lamin A) knockouts have severely impaired spermatogenesis associated with failed chromosomal synapsis [76]. These patterns suggest prioritizing genes in the chromosome 11 hotspot with related functions. For example, 42 genes are involved in transcriptional regulation (Table 4). One of these genes (Hils1) is involved in chromatin remodeling during spermatogenesis and has evolved rapidly within rodents [77]. Males with hypomorphic Rad51c alleles are infertile due to arrest of spermatogenesis in early meiotic prophase I related to failed double-strand break repair by recombination [78].
Interactions between novel loci and better-characterized regions point to some promising candidates. For example, the chromosome-10 hotspot interacts with the proximal X and the chromosome-17 region containing Prdm9, the two loci with the most dramatic effects on expression. A gene within the chromosome-10 hotspot, Dnmt3l (DNA methyltransferase 3-like), plays a key role in epigenetic programming during spermatogenesis. Males carrying null alleles at Dnmt3l show phenotypes similar to those documented in F1s associated with the X-17 interaction, including hypogonadism, asynapsis during meiosis, abnormal formation of the sex body, and deregulation of X-linked and autosomal genes [79]–[82]. Dnmt3l does not have methyltransferase activity but shows sequence similarity to Dnmt3a and Dnmt3b, with which it interacts to promote de novo DNA methylation [83]. Misexpression of Dnmt3a was reported previously in sterile F1 hybrids [10]. Prdm9 is a histone methyltransferase; while speculative, an interaction between Dnmt3l and Prdm9 is a promising lead. Dnmt3l is essential for several epigenetic processes occurring at different stages of spermatogenesis, including paternal imprinting, transcriptional regulation, chromatin morphogenesis through meiosis, and the histone-protamine transition during spermiogenesis. Interestingly, Dnmt3l interacts with heterochromatin [80], similar to the Drosophila sterility gene OdsH [84].
Conditional mapping revealed several genomic regions involved in the interaction network that did not have previous evidence for involvement in sterility or expression (Fig. 5), indicating this mapping approach can uncover incompatibility loci without detectable marginal effects. Some of these interaction loci are very small, containing few enough genes that targeted functional evaluation would be feasible. For example interaction hotspots mapped with covariates on chromosomes 2, 5, and X overlap on distal chromosome 7 (Fig. S4). This region spans 3.1 Mb, encompassing 14 characterized RefSeq genes.
We focused here on genome-wide patterns. Detailed characterization of individual loci, and analysis of gene co-expression networks including all related QTT, will yield additional information useful in pinpointing the disrupted pathways causing sterility and prioritizing candidates.
Implications for evolution of reproductive barriers
The rate of accumulation of Dobzhansky-Muller incompatibilities and the evolution of reproductive barriers between incipient species depend on the genetic architecture of isolating traits. Theoretical models of DMI evolution assume that incompatibilities act independently on barrier traits [85], [86]. The complex pattern of interactions we report here violates this assumption: some sterility loci are involved in multiple incompatibilities. This aspect of the network we characterized is most consistent with branched developmental pathways [45] and gene networks models [47]. Theory that incorporates this non-independence as well as other biological characteristics of incompatibilities should continue to be pursued [45]–[47], [87].
Network characteristics are also key determinants in accurate modeling of gene-flow dynamics in zones of hybridization. Non-independence of incompatibilities due to interactions of sterility loci with multiple partners is likely to result in stronger selection and slower introgression at those loci because sterility phenotypes are expressed on a variety of genomic backgrounds. Future cline theory should incorporate epistasis with multiple partner loci.
A network-centered approach to speciation genetics
Remarkable progress in understanding the genetic basis of speciation has emerged from identification of a growing list of hybrid incompatibility genes [6] over the past 20 years. However, identification and functional characterization of hybrid incompatibility genes is feasible in only a few model organisms, and tremendous effort, time and resources are needed to identify a single gene. If this gene-by-gene approach continues as the standard in speciation genetics, it will be a long time before the number of genes and interactions identified is sufficient to reveal generalities of the speciation process. Moreover, general features of incompatibility networks, including the number and dominance of loci, types of interactions, and possibly particular developmental/regulatory pathways, are more likely to be shared among taxa than are specific incompatibility genes.
The house mouse features a rich set of sophisticated genetic tools and resources, which facilitates collection of reliable genome-scale data and ultimately will enable functional characterization of candidate incompatibility genes. Although identification and characterization of reproductive barrier genes is not feasible in most species, the integrated mapping approach we employed is applicable in a broad range of organisms. For species pairs that can be crossed in the laboratory, a similar F2 intercross can be performed and sterility or inviability phenotypes can be measured. Informative marker discovery is straight-forward and relatively low cost using RADseq [88], and RNAseq or custom microarrays can be used to collect expression data from species without commercially available platforms. Functional annotation and nomination of candidate processes/pathways is possible if a genome sequence of the focal species or even a relatively distantly related taxon is available [89]. Even in species with very limited available gene annotation, the number of incompatibility loci and the nature of interactions between them can be estimated. Consequently, we suggest that network-centered approaches are powerful and have promise to substantially advance understanding of speciation.
Materials and Methods
Ethics statement
Mice were maintained at the University of Wisconsin School of Medicine and Public Health mouse facility according to animal care protocols approved by the University of Wisconsin Animal Care and Use Committee.
Sterility phenotype data and tissue collection
Reciprocal crosses of wild-derived inbred strains of M. m. domesticus (WSB/EiJ; domesticusWSB) and M. m. musculus (PWD/PhJ; musculusPWD) were performed to generate F1 hybrids. A total of 305 F2 males were generated by mating F1 siblings (294 from domesticusWSB female×musculusPWD male crosses and 11 from musculusPWD female×domesticusWSB male crosses). Male F2s were euthanized at 70 (±5) days of age. Five sterility phenotypes were quantified: testis weight, sperm count, sperm head shape, proportion of abnormal sperm, and seminiferous tubule area (see White et al 2011 for detailed methods). The left testis was flash-frozen in liquid nitrogen upon dissection and stored at −80°. Testes from musculusPWD (n = 8), domesticusWSB (n = 8), musculusPWD×domesticusWSB F1s (n = 6), and domesticusWSB×musculusPWD F1s (n = 4), were dissected using the same procedure to provide controls for expression analyses. Frozen testis samples were transferred to RNAlater-ICE buffer (Invitrogen, Grand Island, NY, USA), shipped to the Max Planck Institute in Plön and stored at −80° until processing.
Gene expression analysis
RNA sample preparation and microarray hybridization
We used Whole Mouse Genome Microarrays (Agilent, Waldbronn, Germany) to measure genome-wide expression in testis. This array contains 43,379 probes surveying 22,210 transcripts from 21,326 genes. We extracted RNA from testis using RNeasy kits (Qiagen, Hilden, Germany). RNA quality (RIN>8) was verified using RNA 6000 Nano kits (Agilent) on a 2100 Bioanalyzer (Agilent). We used single-color Quick-Amp Labeling Kits (Agilent) to amplify and label RNA. The yield (>2 µg) and specific activity (>9.0 pmol Cy3/µg cRNA) of labeling reactions was verified using a NanoDrop ND-1000 UV-VIS Spectrophotometer (NanoDrop, Wilmington, DE, USA). Arrays were scanned using a High Resolution Microarray Scanner (Agilent) and raw images processed using Feature Extraction Software (Agilent). Raw images and the distribution of non-uniformity outliers were visually inspected for large spatial artifacts (e.g. caused by buffer leakage or dust particles). We used quality control metrics from Feature Extraction protocol GE1_QCMT_Dec08.
Filtering and preprocessing
We mapped the 41,174 non-control probe sequences from the Whole Mouse Genome Microarray to the mouse reference genome (NCBI37, downloaded March 2011) using BLAT ([90]; minScore = 55, default settings for all other options). We excluded probes with multiple perfect matches, more than nine matches, matches to non-coding/intergenic regions only, and matches to more than one gene. A total of 36,323 probes (covering 19,742 Entrez Genes) were retained. Gene expression data have been deposited in the NCBI Gene Expression Omnibus (GSE54089).
Preprocessing of microarray data was performed using the BioConductor package Agi4x44PreProcess [91]. We used the “half” setting, which sets intensities below 0.5 to 0.5 following background subtraction, and an offset value of 50. The background signal was computed in Feature Extraction. This signal incorporates a local background measurement and a spatial detrending surface value. We used quantile normalization to normalize signal between arrays.
During preprocessing, we filtered probes based on flags from Feature Extraction. Probes with signal above background in at least 10% of samples were retained (settings: wellaboveBG = TRUE, isfound = TRUE, wellaboveNEG = TRUE). We used default settings for quality-control flags. Following preprocessing, we removed probes for which the 98th percentile was <2-fold greater than background. The final data set includes 24,675 probes.
Differential expression, misexpression, and dominance
We performed pairwise comparisons of expression levels between musculusPWD, domesticusWSB and reciprocal F1s using t-tests to identify differentially expressed transcripts. To account for multiple comparisons, we used a significance threshold based on the 5% false discovery rate [92]. For F1s, transcripts were classified as misexpressed if expression was lower or higher than both musculusPWD and domesticusWSB and there was a significant difference >0.5 in mean expression level (log2) between the F1 and both parental lines. For F2s, a transcript was classified as misexpressed in an individual if the expression level was greater/lower than both parental means and the difference was >two standard errors and >0.5 (log2) It is important to note that, using these criteria, some transcripts classified as misexpressed do not have aberrant expression patterns due to hybrid defects (e.g. values outside the parental range can result from transgressive segregation) and some transcripts with aberrant expression may fall within the parental range plus arbitrary fold cutoff.
To classify dominance of eQTL, we compared mean expression levels between genotypic classes at the peak marker/pseudomarker position. If the mean for heterozygotes was intermediate and >two standard errors from both homozygote means, the eQTL was classified as additive. If the heterozygous mean was <two standard errors from one homozygote mean and >two standard errors from the other, the eQTL was classified as dominant. If the heterozygous mean was outside the homozygote range and >two standard errors from the extreme homozygote mean, the eQTL was classified as over - or underdominant.
Ascertainment bias
Microarray probes were designed using sequences from a variety of libraries including UCSC mRNA (known genes), RefSeq, and RIKEN cDNA. All sources are based on samples from classical laboratory mouse strains, which have genomes predominantly M. m. domesticus in origin [93]–[95]. M. m. domesticusWSB is more closely related to the classical strains than M. m. musculusPWD, raising the possibility that ascertainment bias will affect expression results. 17,508 probes were differentially expressed between M. m. domesticusWSB and M. m. musculusPWD. More of these probes had higher expression in M. m. musculusPWD (9,265) than in M. m. domesticusWSB (8,243). This pattern is the opposite of what would be expected if ascertainment bias had a substantial effect. To address this issue more directly, we identified 103 probes with SNPs between the strains using the Perlegen phase 4-release of the mouse resequencing project [96]. The number of probes in this subset with higher expression in M. m. musculusPWD (41) was also greater than those with higher expression in M. m. domesticusWSB [35]. This result provides further evidence that ascertainment bias does not substantially affect measures of expression determined from this array in individuals from crosses between these strains.
Quantitative trait locus mapping
Genotyping and genetic map construction
Genotyping and quality control procedures are described in White et al [1]. Briefly, 331 single nucleotide polymorphism (SNP) markers were genotyped using the Sequenom iPLEX MassARRAY system [97]. A total of 198 SNPs was retained for genetic mapping, following a stringent series of quality-control steps that considered parental and F1 controls, segregation ratios, and proportion of missing data [98]. The genetic map was estimated from the genotypes of 553 F2 males and females using a Carter-Falconer mapping function [99], as implemented by the est.map function of R/qtl [100], [101], assuming a genotyping error rate of zero [98].
Interval mapping
For comparison of sterility phenotype QTL and eQTL, we repeated mapping of fertility traits from White et al [1], excluding five F2 individuals (of 310) without gene expression data. Standard interval mapping was performed using the scanone function of R/qtl [100], [101], with identical parameter settings and data transformations as described in White et al [1]. Specifically, standard interval mapping (EM algorithm) was performed for all traits except abnormal sperm phenotypes, which were mapped using the extended Haley-Knott method [102].We determined genome-wide significance thresholds for autosomes from 1000 permutations; permutations for the X (15,855) were performed separately [101], [103], [104].
To identify loci causing large-scale disruptions in gene expression, we performed QTL mapping using quantitative measures of misexpression as phenotypes. Misexpression of X - and autosomal transcripts were mapped separately, on the basis of misexpression patterns in sterile F1 hybrids from this cross and previous studies [10]. Counts of overexpressed and underexpressed transcripts on the X and autosomes were square root transformed to improve fit to the genetic model, which assumes normality. We determined genome-wide significance thresholds for each phenotype as described above.
We mapped eQTL for 24,675 expression traits using scanone and the EM method. Genotype probabilities were estimated at 2 cM intervals, assuming a genotyping error rate of 0.001. We used the normal quantile ranks of gene expression values as phenotypes. The normal quantile rank transformation left all expression traits with a shared distribution, allowing us to determine genome-wide significance thresholds by permutation of a single transcript. We performed 10,000 permutations for autosomes and 158,550 for the X. In addition, we performed 360 permutations of the entire expression dataset to identify a more conservative significance threshold based on the probability of observing a single autosomal or X eQTL by chance when mapping all traits. We permuted animal IDs associated with expression data to preserve the correlation structure among transcripts.
To estimate the experiment-wide false positive rate, we translated the maximum LOD scores for each chromosome for each transcript into P values and determined the FDR and q values using the BioConductor package qvalue with a tuning parameter (λ) estimated by the “smoother” method [92].
To assess which aspects of the eQTL patterns we observed were related to hybrid sterility vs. subspecies differences unrelated to sterility, we repeated mapping eQTL mapping in 229 F2s without strong evidence for sterility. We identified ‘fertile’ individuals by performing a principal component analysis of four sterility phenotypes: relative right testis weight, sperm density, total abnormal sperm and seminiferous tubule area. Data for all four phenotypes were available for 286 F2s. Principal component one explains 99.9% variance. We included individuals >20 percentile for PC1 in the ‘fertile’ mapping analysis. Significance thresholds were 3.61 for autosomes, based on 10,000 single-transcript permutations, and 2.80 for the X chromosome, based on and 158,332 permutations.
Conditional mapping
Genetic interactions (epistasis) are difficult to map using standard approaches because the sample size must accommodate both the number of individuals required to recapitulate affected two-locus genotypes as well as overcome uncertainty introduced by a substantial increase in the number of statistical tests performed. Given the large (24,675) number of traits mapped in this eQTL analysis, standard approaches for identifying interactions (e.g. pair-scan) are expected to be underpowered to the point of futility. However, under the Dobzhansky-Muller model, hybrid sterility phenotypes are generated by negative epistasis, and each sterility locus is expected to interact with one or more additional loci. Thus, interaction partners of a hybrid-sterility QTL can be mapped by conditioning on the genotype at the candidate locus. This hypothesis-driven approach reduces the number of tests performed to the point that meaningful results can be achieved while controlling for multiple testing. Assuming trans hotspots indeed reflect hybrid incompatibilities, we performed conditional mapping of eQTL using genotypes at a set of 14 candidate loci as covariates, including the marker closest to the peak of each of the nine autosomal trans eQTL hotspots, and five markers in X chromosome trans hotspots. We used additional X genotypes as covariates because the large size of the trans hotspots on the X suggests there may be multiple underlying causative genes.
We performed conditional mapping twice for each genotype covariate, first using an additive model including an effect of the covariate, and second using a full model including an effect of the covariate and a QTL x covariate interaction term. Comparison between these models is necessary to distinguish effects of gene-gene interactions from enhanced detection of eQTL due to reduced residual variation by accounting for the effect of the covariate. The LOD score for the interaction (LODi) is the difference between LOD scores under the full (LODf) and additive (LODa) models [101]. For each covariate, we determined genome-wide significance thresholds for LODf, LODa, and LODi by permutation. We used the same seed for permutations (1000 autosomes, 15,855 X) under the full and additive models, enabling calculation of LODi for each permutation. eQTL with both LODf and LODi above significance thresholds have significant evidence for an interaction-eQTL. Significance thresholds for each covariate are listed in Table S3.
Threshold estimates based on permutations of a single transcript for the main eQTL mapping analysis (no covariate) and for models with additive covariates were similar. For simplicity, we used 3.7 (autosomal) and 2.9 (X) as thresholds for these analyses.
Identification of eQTL hotspots and co-localization with sterility QTL
We defined trans eQTL hotspots by permutation. To preserve the distribution of eQTL across transcripts, we randomly assigned the position of each observed trans eQTL to a marker/pseudomarker (2 cM intervals, equal probability for each appropriate marker) on another chromosome 10,000 times for the main eQTL analysis and 1,000 times for analyses with covariates. The maximum eQTL count in each window was recorded for each permutation. Hotspots comprise sliding windows with trans eQTL counts greater than the 95th percentile of counts for sliding windows of the same size calculated from permutations.
We tested for non-random co-localization of trans-eQTL hotspots with sterility phenotype QTL by permuting the positions of the trans hotspots, while keeping sterility QTL positions fixed at observed locations. For each permutation, positions of 12 non-overlapping hotspots of the same sizes (cM) as the observed data were drawn from the markers and pseudomarkers (2 cM step size) used for QTL mapping. Sterility QTL regions included all positions within the 1.5-LOD interval for any QTL for a sterility phenotype identified by single or multiple QTL mapping analyses in White et al (2011). We performed 10,000 permutations, recording the number of hotspots overlapping sterility QTL, the total number of overlapping markers/pseudomarkers, and the combined length of overlapping (cM) regions for each permutation.
Functional annotation and identification of candidate genes
To identify classes of genes enriched among QTT, we used the DAVID functional annotation tool [43], [44], which integrates gene annotation information from several resources. Functionally related genes are clustered based on biological process, cellular compartment, molecular function, sequence features, protein domains, and protein interactions. To account for multiple comparisons, we used a significance threshold based on the false discovery rate (Benjamini) calculated within DAVID.
We identified candidate genes in trans hotspots and among QTT that have roles in male reproduction and/or regulation of gene expression using reviews of male fertility [17] and meiosis [105] and gene ontology (GO) terms related to male reproduction, meiosis, or the regulation of gene expression: 0001059; 0001060; 0001109; 0001121; 0003006; 0006351; 0006352; 0006353; 0006354; 0006355; 0006360; 0006366; 0006383; 0006390; 0006396; 0006412; 0007127; 0007135; 0007140; 0007285; 0009008; 0009299; 0009300; 0009302; 0009304; 0010216; 0010468; 0010608; 0010628; 0010629; 0022414; 0023019; 0030724; 0030726; 0032775; 0032776; 0036206; 0040020; 0040029; 0042793; 0043046; 0043484; 0044030; 0045132; 0045835; 0045836; 0045892; 0045893; 0048133; 0048136; 0048140; 0048515; 0048610; 0050684; 0051037; 0051257; 0051604; 0070192; 0070613; 0070920; 0080188; 0090306; 0097393; 1901148; 1901311; 2000232; 2000235; 2000241; 2000242; 2000243. Many genes identified as candidates in publications were not annotated with related GO terms, highlighting the limitations of gene ontology. Moreover, genes causing sterility might not have functions obviously related to reproduction.
Supporting Information
Zdroje
1. WhiteMA, SteffyB, WiltshireT, PayseurBA (2011) Genetic dissection of a key reproductive barrier between nascent species of house mice. Genetics 189 : 289–304 doi:10.1534/genetics.111.129171
2. WhiteMA, StubbingsM, DumontBL, PayseurBA (2012) Genetics and evolution of hybrid male sterility in house mice. Genetics 191 : 917–934 doi:10.1534/genetics.112.140251
3. MoyleLC, NakazatoT (2008) Comparative genetics of hybrid incompatibility: sterility in two Solanum species crosses. Genetics 179 : 1437–1453 doi:10.1534/genetics.107.083618
4. Dzur-GejdosovaM, SimecekP, GregorovaS, BhattacharyyaT, ForejtJ (2012) Dissecting the genetic architecture of F1 hybrid sterility in house mice. Evolution 66 : 3321–3335 doi:10.1111/j.1558-5646.2012.01684.x
5. GoodJM, HandelMA, NachmanMW (2008) Asymmetry and polymorphism of hybrid male sterility during the early stages of speciation in house mice. Evolution 62 : 50–65.
6. MaheshwariS, BarbashDA (2011) The genetics of hybrid incompatibilities. Annu Rev Genet 45 : 331–355 doi:10.1146/annurev-genet-110410-132514
7. RiesebergLH, WhittonJ, GardnerK (1999) Hybrid zones and the genetic architecture of a barrier to gene flow between two sunflower species. Genetics 152 : 713–727.
8. HaertyW, SinghRS (2006) Gene regulation divergence is a major contributor to the evolution of Dobzhansky-Muller incompatibilities between species of Drosophila. Mol Biol Evol 23 : 1707–1714 doi:10.1093/molbev/msl033
9. RottscheidtR, HarrB (2007) Extensive additivity of gene expression differentiates subspecies of the house mouse. Genetics 177 : 1553–1567.
10. GoodJM, GigerT, DeanMD, NachmanMW (2010) Widespread over-expression of the X chromosome in sterile F1 hybrid mice. PLoS Genet 6 : 1–13.
11. VoolstraC, TautzD, FarbrotherP, EichingerL, HarrB (2007) Contrasting evolution of expression differences in the testis between species and subspecies of the house mouse. Genome Res 17 : 42–49.
12. MichalakP, NoorMAF (2004) Association of misexpression with sterility in hybrids of Drosophila simulans and D. mauritiana. J Mol Evol 59 : 277–282 doi:10.1007/s00239-004-2622-y
13. MaloneJH, ChrzanowskiTH, MichalakP (2007) Sterility and gene expression in hybrid males of Xenopus laevis and X. muelleri. PLoS ONE 2: e781 doi:10.1371/journal.pone.0000781.s008
14. Dobzhansky T (1937) Genetics and the origin of species. New York: Columbia University Press.
15. MullerHJ (1942) Isolating mechanisms, evolution and temperature. Biol Symp 6 : 71–125.
16. Coyne JA, Orr HA (2004) Speciation. Sunderland, Mass.: Sinauer Associates.
17. MatzukMM, LambDJ (2008) The biology of infertility: research advances and clinical challenges. Nat Med 14 : 1197–1213 doi:10.1038/nm.f.1895
18. ForejtJ, IvanyiP (1974) Genetic studies on male sterility of hybrids between laboratory and wild mice (Mus musculus). Genet Res 24 : 189–206.
19. OkaA, MitaA, Sakurai-YamataniN, YamamotoH, TakagiN, et al. (2004) Hybrid breakdown caused by substitution of the X chromosome between two mouse subspecies. Genetics 166 : 913–924.
20. VyskocilovaM, TrachtulecZ, ForejtvJ, PialekJ (2005) Does geography matter in hybrid sterility in house mice? Biol J Linn Soc 84 : 663–674.
21. Britton-DavidianJ, Fel-ClairF, LopezJ, AlibertP, BoursotP (2005) Postzygotic isolation between the two European subspecies of the house mouse: estimates from fertility patterns in wild and laboratory-bred hybrids. Biol J Linn Soc 84 : 379–393.
22. VanlerbergheF, DodB, BoursotP, BellisM, BonhommeF (1986) Absence of Y-chromosome introgression across the hybrid zone between Mus musculus domesticus and Mus musculus musculus. Genet Res 48 : 191–197.
23. TurnerLM, SchwahnDJ, HarrB (2012) Reduced male fertility is common but highly variable in form and severity in a natural house mouse hybrid zone. Evolution 66 : 443–458 doi:10.1111/j.1558-5646.2011.01445.x
24. AlbrechtováJ, AlbrechtT, BairdSJ, MacholanM, RudolfsenG, et al. (2012) Sperm-related phenotypes implicated in both maintenance and breakdown of a natural species barrier in the house mouse. P Roy Soc B-Biol Sci 279 : 4803–4810 doi:10.1371/journal.pbio.1000244
25. GoodJM, DeanMD, NachmanMW (2008) A complex genetic basis to X-linked hybrid male sterility between two species of house mice. Genetics 179 : 2213–2228 doi:10.1534/genetics.107.085340
26. BhattacharyyaT, GregorovaS, MiholaO, AngerM, SebestovaJ, et al. (2013) Mechanistic basis of infertility of mouse intersubspecific hybrids. Proc Natl Acad Sci USA 110: E468–E477 doi:10.1073/pnas.1219126110
27. MiholaO, TrachtulecZ, VlcekC, SchimentiJC, ForejtJ (2009) A mouse speciation gene encodes a meiotic histone H3 methyltransferase. Science 323 : 373–375 doi:10.1126/science.1163601
28. ChalmelF, RollandAD, Niederhauser-WiederkehrC, ChungSSW, DemouginP, et al. (2007) The conserved transcriptome in human and rodent male gametogenesis. Proc Natl Acad Sci USA 104 : 8346–8351 doi:10.1073/pnas.0701883104
29. HandelMA, SchimentiJC (2010) Genetics of mammalian meiosis: regulation, dynamics and impact on fertility. Nat Rev Genet 11 : 124–136 doi:10.1038/nrg2723
30. TurnerJMA (2007) Meiotic sex chromosome inactivation. Development 134 : 1823–1831 doi:10.1242/dev.000018
31. CampbellP, GoodJM, NachmanMW (2013) Meiotic sex chromosome inactivation is disrupted in sterile hybrid male house mice. Genetics 193 : 819–828 doi:10.1534/genetics.112.148635
32. WestMAL, KimK, KliebensteinDJ, van LeeuwenH, MichelmoreRW, et al. (2006) Global eQTL mapping reveals the complex genetic architecture of transcript-level variation in Arabidopsis. Genetics 175 : 1441–1450 doi:10.1534/genetics.106.064972
33. RockmanMV, KruglyakL (2006) Genetics of global gene expression. Nat Rev Genet 7 : 862–872.
34. LanH, ChenM, FlowersJB, YandellBS, StapletonDS, et al. (2006) Combined expression trait correlations and expression quantitative trait locus mapping. PLoS Genet 2: e6 doi:10.1371/journal.pgen.0020006.eor
35. GiladY, RifkinSA, PritchardJK (2008) Revealing the architecture of gene regulation: the promise of eQTL studies. Trends Genet 24 : 408–415 doi:10.1016/j.tig.2008.06.001
36. BremRB, YvertG, ClintonR, KruglyakL (2002) Genetic dissection of transcriptional regulation in budding yeast. Science 296 : 752–755 doi:10.1126/science.1069516
37. DixonAL, LiangL, MoffattMF, ChenW, HeathS, et al. (2007) A genome-wide association study of global gene expression. Nat Genet 39 : 1202–1207 doi:10.1038/ng2109
38. EmilssonV, ThorleifssonG, ZhangB, LeonardsonAS, ZinkF, et al. (2008) Genetics of gene expression and its effect on disease. Nature 452 : 423–U2 doi:10.1038/nature06758
39. PetrettoE, MangionJ, DickensNJ, CookSA, KumaranMK, et al. (2006) Heritability and tissue specificity of expression quantitative trait loci. PLoS Genet 2: e172 doi:10.1371/journal.pgen.0020172.st001
40. BremRB, KruglyakL (2005) The landscape of genetic complexity across 5,700 gene expression traits in yeast. Proc Natl Acad Sci USA 102 : 1572–1577 doi:10.1073/pnas.0408709102
41. LiY, ÁlvarezOA, GuttelingEW, TijstermanM, FuJ, et al. (2006) Mapping determinants of gene expression plasticity by genetical genomics in C. elegans. PLoS Genet 2: e222 doi:10.1371/journal.pgen.0020222.st004
42. MehrabianM, AllayeeH, StocktonJ, LumPY, DrakeTA, et al. (2005) Integrating genotypic and expression data in a segregating mouse population to identify 5-lipoxygenase as a susceptibility gene for obesity and bone traits. Nat Genet 37 : 1224–1233 doi:10.1038/ng1619
43. HuangDW, ShermanBT, LempickiRA (2009) Bioinformatics enrichment tools: paths toward the comprehensive functional analysis of large gene lists. Nucleic Acids Res 37 : 1–13 doi:10.1093/nar/gkn923
44. HuangDW, ShermanBT, LempickiRA (2008) Systematic and integrative analysis of large gene lists using DAVID bioinformatics resources. Nat Protoc 4 : 44–57 doi:10.1038/nprot.2008.211
45. JohnsonNA, PorterAH (2007) Evolution of branched regulatory genetic pathways: directional selection on pleiotropic loci accelerates developmental system drift. Genetica 129 : 57–70 doi:10.1007/s10709-006-0033-2
46. JohnsonNA, PorterAH (2000) Rapid speciation via parallel, directional selection on regulatory genetic pathways. J Theor Biol 205 : 527–542 doi:10.1006/jtbi.2000.2070
47. PalmerME, FeldmanMW (2009) Dynamics of hybrid incompatibility in gene networks in a constant environment. Evolution 63 : 418–431 doi:10.1111/j.1558-5646.2008.00577.x
48. AyrolesJF, CarboneMA, StoneEA, JordanKW, LymanRF, et al. (2009) Systems genetics of complex traits in Drosophila melanogaster. Nat Genet 41 : 299–307 doi:10.1038/ng.332
49. HarbisonST, CarboneMA, AyrolesJF, StoneEA, LymanRF, et al. (2009) Co-regulated transcriptional networks contribute to natural genetic variation in Drosophila sleep. Nat Genet 41 : 371–375 doi:10.1038/ng.330
50. CarrollSB (2000) Endless forms: the evolution of gene regulation and morphological diversity. Cell 101 : 577–580.
51. KingMC, WilsonAC (1975) Evolution at two levels in humans and chimpanzees. Science 188 : 107–116.
52. WrayGA, HahnMW, AbouheifE, BalhoffJP, PizerM, et al. (2003) The evolution of transcriptional regulation in eukaryotes. Mol Biol Evol 20 : 1377–1419.
53. WrayGA (2007) The evolutionary significance of cis-regulatory mutations. Nat Rev Genet 8 : 206–216 doi:10.1038/nrg2063
54. MoehringAJ, TeeterKC, NoorMAF (2006) Genome-wide patterns of expression in Drosophila pure species and hybrid males. ii. examination of multiple-species hybridizations, platforms, and life cycle stages. Mol Biol Evol 24 : 137–145 doi:10.1093/molbev/msl142
55. L'HôteD, SerresC, VeitiaRA, MontagutelliX, OulmoudenA, et al. (2008) Gene expression regulation in the context of mouse interspecific mosaic genomes. Genome Biol 9: R133 doi:10.1186/gb-2008-9-8-r133
56. MaloneJH, MichalakP (2008) Gene expression analysis of the ovary of hybrid females of Xenopus laevis and X. muelleri. BMC Evol Biol 8 : 82 doi:10.1186/1471-2148-8-82
57. RenautS, NolteAW, BernatchezL (2009) Gene expression divergence and hybrid misexpression between lake whitefish species pairs (Coregonus spp. Salmonidae). Mol Biol Evol 26 : 925–936 doi:10.1093/molbev/msp017
58. EllisonCK, BurtonRS (2008) Genotype-dependent variation of mitochondrial transcriptional profiles in interpopulation hybrids. Proc Natl Acad Sci USA 105 : 15831–15836 doi:10.1073/pnas.0804253105
59. AugerDL (2004) Nonadditive gene expression in diploid and triploid hybrids of maize. Genetics 169 : 389–397 doi:10.1534/genetics.104.032987
60. HegartyMJ, BarkerGL, BrennanAC, EdwardsKJ, AbbottRJ, et al. (2009) Extreme changes to gene expression associated with homoploid hybrid speciation. Mol Ecol 18 : 877–889 doi:10.1111/j.1365-294X.2008.04054.x
61. JosefssonC, DilkesB, ComaiL (2006) Parent-dependent loss of gene silencing during interspecies hybridization. Curr Biol 16 : 1322–1328 doi:10.1016/j.cub.2006.05.045
62. PayseurBA, KrenzJG, NachmanMW (2004) Differential patterns of introgression across the X chromosome in a hybrid zone between two species of house mice. Evolution 58 : 2064–2078.
63. TeeterKC, PayseurBA, HarrisLW, BakewellMA, ThibodeauLM, et al. (2008) Genome-wide patterns of gene flow across a house mouse hybrid zone. Genome Res 18 : 67–76.
64. TeeterKC, ThibodeauLM, GompertZ, BuerkleCA, NachmanMW, et al. (2010) The variable genomic architecture of isolation between hybridizing species of house mouse. Evolution 64 : 472–485.
65. MacholanM, MunclingerP, SugerkovaM, DufkovaP, BimovaB, et al. (2007) Genetic analysis of autosomal and X-linked markers across a mouse hybrid zone. Evolution 61 : 746–771.
66. StorchovaR, GregorovaS, BuckiovaD, KyselovaV, DivinaP, et al. (2004) Genetic analysis of X-linked hybrid sterility in the house mouse. Mamm Genome 15 : 515–524.
67. FlachsP, MiholaO, SimecekP, GregorovaS, SchimentiJC, et al. (2012) Interallelic and intergenic incompatibilities of the Prdm9 (Hst1) gene in mouse hybrid sterility. PLoS Genet 8: e1003044 doi:10.1371/journal.pgen.1003044.s007
68. CampbellP, GoodJM, DeanMD, TuckerPK, NachmanMW (2012) The contribution of the Y chromosome to hybrid male sterility in house mice. Genetics 191 : 1271–1281 doi:10.1534/genetics.112.141804
69. JonesGH (1984) The control of chiasma distribution. Symp Soc Exp Biol 38 : 293–320.
70. EllisPJI, ClementeEJ, BallP, ToureA, FergusonL, et al. (2005) Deletions on mouse Yq lead to upregulation of multiple X - and Y-linked transcripts in spermatids. Hum Mol Genet 14 : 2705–2715 doi:10.1093/hmg/ddi304
71. CocquetJ, EllisPJI, YamauchiY, MahadevaiahSK, AffaraNA, et al. (2009) The multicopy gene Sly represses the sex chromosomes in the male mouse germline after meiosis. PLoS Biol 7: e1000244 doi:10.1371/journal.pbio.1000244.s014
72. ScavettaRJ, TautzD (2010) Copy number changes of CNV regions in intersubspecific crosses of the house mouse. Mol Biol Evol 27 : 1845–1856 doi:10.1093/molbev/msq064
73. BaudatF, BuardJ, GreyC, Fledel-AlonA, OberC, et al. (2010) PRDM9 is a major determinant of meiotic recombination hotspots in humans and mice. Science 327 : 836–840 doi:10.1126/science.1183439
74. BergIL, NeumannR, LamKWG, SarbajnaS, Odenthal-HesseL, et al. (2010) PRDM9 variation strongly influences recombination hot-spot activity and meiotic instability in humans. Nat Genet 42 : 859–863 doi:10.1038/ng.658
75. BlendyJA, KaestnerKH, WeinbauerGF, NieschlagE, SchützG (1996) Severe impairment of spermatogenesis in mice lacking the CREM gene. Nature 380 : 162–165 doi:10.1038/380162a0
76. AlsheimerM (2004) Disruption of spermatogenesis in mice lacking A-type lamins. J Cell Sci 117 : 1173–1178 doi:10.1242/jcs.00975
77. TurnerLM, ChuongEB, HoekstraHE (2008) Comparative analysis of testis protein evolution in rodents. Genetics 179 : 2075–2089 doi:10.1534/genetics.107.085902
78. KuznetsovS, PellegriniM, ShudaK, Fernandez-CapetilloO, LiuY, et al. (2007) RAD51C deficiency in mice results in early prophase I arrest in males and sister chromatid separation at metaphase II in females. J Cell Biol 176 : 581–592 doi:10.1083/jcb.200608130
79. KanedaM, OkanoM, HataK, SadoT, TsujimotoN, et al. (2004) Essential role for de novo DNA methyltransferase Dnmt3a in paternal and maternal imprinting. Nature 429 : 900–903 doi:10.1038/nature02633
80. WebsterKE, O'BryanMK, FletcherS, CrewtherPE, AapolaU, et al. (2005) Meiotic and epigenetic defects in Dnmt3L-knockout mouse spermatogenesis. Proc Natl Acad Sci USA 102 : 4068–4073 doi:10.1073/pnas.0500702102
81. Bourc'hisD, BestorTH (2004) Meiotic catastrophe and retrotransposon reactivation in male germ cells lacking Dnmt3l. Nature 431 : 96–99 doi:10.1038/nature02886
82. ZamudioNM, ScottHS, WolskiK, LoC-Y, LawC, et al. (2011) Dnmt3l is a regulator of X chromosome compaction and post-meiotic gene transcription. PLoS ONE 6: e18276 doi:10.1371/journal.pone.0018276.s001
83. LiaoH-F, TaiK-Y, ChenWSC, ChengLCW, HoH-N, et al. (2012) Functions of DNA methyltransferase 3-like in germ cells and beyond. Biol Cell 104 : 571–587 doi:10.1111/boc.201100109
84. BayesJJ, MalikHS (2009) Altered heterochromatin binding by a hybrid sterility protein in Drosophila sibling species. Science 326 : 1538–1541 doi:10.1126/science.1181756
85. OrrHA (1995) The population genetics of speciation: the evolution of hybrid incompatibilities. Genetics 139 : 1805–1813.
86. OrrHAH, TurelliMM (2001) The evolution of postzygotic isolation: accumulating Dobzhansky-Muller incompatibilities. Evolution 55 : 1085–1094 doi:10.2307/2680275
87. PorterAH, JohnsonNA (2002) Speciation despite gene flow when developmental pathways evolve. Evolution 56 : 2103–2111.
88. PetersonBK, WeberJN, KayEH, FisherHS, HoekstraHE (2012) Double digest RADseq: an inexpensive method for de novo SNP discovery and genotyping in model and non-model species. PLoS ONE 7: e37135 doi:10.1371/journal.pone.0037135.s003
89. VijayN, PoelstraJW, KünstnerA, WolfJBW (2012) Challenges and strategies in transcriptome assembly and differential gene expression quantification. A comprehensive in silicoassessment of RNA-seq experiments. Mol Ecol 22 : 620–634 doi:10.1111/mec.12014
90. KentWJ (2002) BLAT—The BLAST-Like Alignment Tool. Genome Res 12 : 656–664 doi:10.1101/gr.229202
91. Lopez-Romero P (2009) Agi4x44PreProcess: PreProcessing of Agilent 4x44 array data. R package version 1.10.0.
92. StoreyJD, TibshiraniR (2003) Statistical Significance for Genome-Wide Experiments. Proc Natl Acad Sci USA 100 : 9440–9445.
93. YangH, BellTA, ChurchillGA, de VillenaFPM (2007) On the subspecific origin of the laboratory mouse. Nat Genet 39 : 1100–1107.
94. YangH, WangJR, DidionJP, BuusRJ, BellTA, et al. (2011) Subspecific origin and haplotype diversity in the laboratory mouse. Nat Genet 43 : 648–655 doi:10.1038/ng.847
95. KeaneTM, GoodstadtL, DanecekP, WhiteMA, WongK, et al. (2012) Mouse genomic variation and its effect on phenotypes and gene regulation. Nature 477 : 289–294 doi:10.1038/nature10413
96. FrazerKA, EskinE, KangHM, BogueMA, HindsDA, et al. (2007) A sequence-based variation map of 8.27 million SNPs in inbred mouse strains. Nature 448 : 1050–1053.
97. Gabriel S, Ziaugra L, Tabbaa D (2009) SNP genotyping using the Sequenom MassARRAY iPLEX platform. Current protocols in human genetics/editorial board, Jonathan L Haines [et al] Chapter 2.
98. DumontBL, PayseurBA (2011) Genetic analysis of genome-scale recombination rate evolution in house mice. PLoS Genet 7: e1002116 doi:10.1371/journal.pgen.1002116
99. BromanKW, RoweLB, ChurchillGA, PaigenK (2002) Crossover interference in the mouse. Genetics 160 : 1123–1131.
100. BromanKW, WuH, SenS, ChurchillGA (2003) R/qtl: QTL mapping in experimental crosses. Bioinformatics 19 : 889–890 doi:10.1093/bioinformatics/btg112
101. Broman KW, Sen S (2009) A Guide to QTL Mapping with R/qtl. New York: Springer.
102. FeenstraB (2006) Mapping quantitative trait loci by an extension of the Haley-Knott regression method using estimating equations. Genetics 173 : 2269–2282 doi:10.1534/genetics.106.058537
103. ChurchillGA, DoergeRW (1994) Empirical threshold values for quantitative trait mapping. Genetics 138 : 963–971.
104. BromanKW, SenS, OwensSE, ManichaikulA, Southard-SmithEM, et al. (2006) The X chromosome in quantitative trait locus mapping. Genetics 174 : 2151–2158 doi:10.1534/genetics.106.061176
105. Bolcun-FilasE, SchimentiJC (2012) Genetics of meiosis and recombination in mice. Int Rev Cell Mol Biol 298 : 179–227 doi:10.1016/B978-0-12-394309-5.00005-5
106. KrzywinskiM, ScheinJ, BirolI, ConnorsJ, GascoyneR, et al. (2009) Circos: An information aesthetic for comparative genomics. Genome Res 19 : 1639–1645 doi:10.1101/gr.092759.109
107. SchultzN, HamraFK, GarbersDL (2003) A multitude of genes expressed solely in meiotic or postmeiotic spermatogenic cells offers a myriad of contraceptive targets. Proc Natl Acad Sci USA 100 : 12201–12206 doi:10.1073/pnas.1635054100
108. ShimaJE, McLeanDJ, McCarreyJR, GriswoldMD (2004) The murine testicular transcriptome: Characterizing gene expression in the testis during the progression of spermatogenesis. Biology of reproduction 71 : 319–330 doi:10.1095/biolreprod.103.026880
109. SmithLB, MilneL, NelsonN, EddieS, BrownP, et al. (2012) KATNAL1 regulation of sertoli cell microtubule dynamics is essential for spermiogenesis and male fertility. PLoS Genet 8: e1002697 doi:10.1371/journal.pgen.1002697.s002
Štítky
Genetika Reprodukční medicínaČlánek vyšel v časopise
PLOS Genetics
2014 Číslo 2
Nejčtenější v tomto čísle
- Genome-Wide Association Study of Metabolic Traits Reveals Novel Gene-Metabolite-Disease Links
- A Cohesin-Independent Role for NIPBL at Promoters Provides Insights in CdLS
- Classic Selective Sweeps Revealed by Massive Sequencing in Cattle
- Arf4 Is Required for Mammalian Development but Dispensable for Ciliary Assembly