
Mechanistically Distinct Mouse Models for -Associated Retinopathy
Cone-rod homeobox (CRX) protein is a “paired-like” homeodomain transcription factor that is essential for regulating rod and cone photoreceptor transcription. Mutations in human CRX are associated with the dominant retinopathies Retinitis Pigmentosa (RP), Cone-Rod Dystrophy (CoRD) and Leber Congenital Amaurosis (LCA), with variable severity. Heterozygous Crx Knock-Out (KO) mice (“+/−”) have normal vision as adults and fail to model the dominant human disease. To investigate how different mutant CRX proteins produce distinct disease pathologies, we generated two Crx Knock-IN (K-IN) mouse models: CrxE168d2 (“E168d2”) and CrxR90W (“R90W”). E168d2 mice carry a frameshift mutation in the CRX activation domain, Glu168del2, which is associated with severe dominant CoRD or LCA in humans. R90W mice carry a substitution mutation in the CRX homeodomain, Arg90Trp, which is associated with dominant mild late-onset CoRD and recessive LCA. As seen in human patients, heterozygous E168d2 (“E168d2/+”) but not R90W (“R90W/+”) mice show severely impaired retinal function, while mice homozygous for either mutation are blind and undergo rapid photoreceptor degeneration. E168d2/+ mice also display abnormal rod/cone morphology, greater impairment of CRX target gene expression than R90W/+ or +/− mice, and undergo progressive photoreceptor degeneration. Surprisingly, E168d2/+ mice express more mutant CRX protein than wild-type CRX. E168d2neo/+, a subline of E168d2 with reduced mutant allele expression, displays a much milder retinal phenotype, demonstrating the impact of Crx expression level on disease severity. Both CRX[E168d2] and CRX[R90W] proteins fail to activate transcription in vitro, but CRX[E168d2] interferes more strongly with the function of wild type (WT) CRX, supporting an antimorphic mechanism. E168d2 and R90W are mechanistically distinct mouse models for CRX-associated disease that will allow the elucidation of molecular mechanisms and testing of novel therapeutic approaches for different forms of CRX-associated disease.
Published in the journal:
. PLoS Genet 10(2): e32767. doi:10.1371/journal.pgen.1004111
Category:
Research Article
doi:
https://doi.org/10.1371/journal.pgen.1004111
Summary
Cone-rod homeobox (CRX) protein is a “paired-like” homeodomain transcription factor that is essential for regulating rod and cone photoreceptor transcription. Mutations in human CRX are associated with the dominant retinopathies Retinitis Pigmentosa (RP), Cone-Rod Dystrophy (CoRD) and Leber Congenital Amaurosis (LCA), with variable severity. Heterozygous Crx Knock-Out (KO) mice (“+/−”) have normal vision as adults and fail to model the dominant human disease. To investigate how different mutant CRX proteins produce distinct disease pathologies, we generated two Crx Knock-IN (K-IN) mouse models: CrxE168d2 (“E168d2”) and CrxR90W (“R90W”). E168d2 mice carry a frameshift mutation in the CRX activation domain, Glu168del2, which is associated with severe dominant CoRD or LCA in humans. R90W mice carry a substitution mutation in the CRX homeodomain, Arg90Trp, which is associated with dominant mild late-onset CoRD and recessive LCA. As seen in human patients, heterozygous E168d2 (“E168d2/+”) but not R90W (“R90W/+”) mice show severely impaired retinal function, while mice homozygous for either mutation are blind and undergo rapid photoreceptor degeneration. E168d2/+ mice also display abnormal rod/cone morphology, greater impairment of CRX target gene expression than R90W/+ or +/− mice, and undergo progressive photoreceptor degeneration. Surprisingly, E168d2/+ mice express more mutant CRX protein than wild-type CRX. E168d2neo/+, a subline of E168d2 with reduced mutant allele expression, displays a much milder retinal phenotype, demonstrating the impact of Crx expression level on disease severity. Both CRX[E168d2] and CRX[R90W] proteins fail to activate transcription in vitro, but CRX[E168d2] interferes more strongly with the function of wild type (WT) CRX, supporting an antimorphic mechanism. E168d2 and R90W are mechanistically distinct mouse models for CRX-associated disease that will allow the elucidation of molecular mechanisms and testing of novel therapeutic approaches for different forms of CRX-associated disease.
Introduction
CRX (Accession: AAH53672.1) is an Otd/OTX-like ‘paired’ homeodomain transcription factor that is preferentially expressed in vertebrate rod and cone photoreceptor cells in the retina and pinealocytes in the brain [1], [2]. CRX plays an essential role in the development and maintenance of functional mammalian rod and cone photoreceptors [3]. Previous studies show that CRX acts as a transcriptional activator [1][4]–[6] by interacting with co-activators, promoting histone acetylation at target gene promoters [7][8] and mediating enhancer/promoter intrachromosomal looping interactions [9] of target photoreceptor genes. Crx encodes a 299 amino acid protein that contains a homeodomain (HD) near its N-terminus that is responsible for DNA binding (Figure 1A) [1][10]. The HD is followed by glutamine rich (Gln), basic, WSP and OTX-tail motifs. The C terminal region of CRX (from the basic to the OTX-tail domains) is required for transactivation activity [4]. CRX interacts with transcription co-regulators including the rod-specific transcription factors NRL (Accession: NP_006168.1) [11][12], NR2E3 (Accession: AAH41421.1) [13][14], and general co-activator proteins GCN5, CBP and p300 (Accessions: AAC50641.1, AAC17736.1, NP_001420.2, respectively) [7] to coordinately control photoreceptor gene expression. In the homozygous Crx Knock-Out mouse (“−/−”), photoreceptors fail to form outer segments (OS), a highly specialized photoreceptor organelle which contains visual pigment opsins and other proteins required for phototransduction [15][16]. As a result, −/ − photoreceptors do not function [3], form abnormal synapses [17], and undergo progressive degeneration [3]. Gene expression profile studies showed that −/ − mice have severely reduced expression of many photoreceptor specific genes [18]–[20]. Most of these genes are direct CRX targets as detected by ChIP-seq analyses of the genomic CRX binding profile in the mouse retina [21].

Mutations in human CRX (NCBI Reference Sequence: NG_008605.1) have been associated with autosomal dominant forms of the retinal degenerative diseases Retinitis Pigmentosa (adRP), Cone-Rod Dystrophy (adCoRD) and Leber Congenital Amaurosis (adLCA), with different ages of onset and severity [12][22]–[45]. CRX is the only gene associated with all three diseases [22][23][26][43], demonstrating its central role in rod and cone integrity. However, null mutations in CRX may not be responsible for severe dominant disease. A null mutation in CRX, P9ins1, was associated with LCA in a heterozygous patient but the patient's father, a carrier of P9ins1, had a normal ocular phenotype suggesting either recessive or multigenic inheritance [44]. The heterozygous Knock-Out mouse (“+/−”), also shows only a slight delay in photoreceptor development and fails to model severe forms of dominant human disease [3]. The phenotypes of the human heterozygous null mutation and the +/ − mouse phenotype suggest that haploinsufficiency is unlikely to underlie the severe forms of dominant CRX-associated disease.
Dominant disease-causing human CRX mutations primarily fall into two classes (Figure 1A): frameshift mutations (blue text) mostly in the transactivation domains and amino acid substitution mutations (black text) mostly within the DNA binding homeodomain. Both classes are expected to produce mutant forms of CRX protein that are pathogenic. Truncated CRX proteins resulting from the frameshift mutations E168d1, E168d2, A196d4 and G217d1 lost the ability to transactivate the promoter of Rhodopsin (Rho) in HEK293 cell transient transfection assays, but are expected to bind DNA normally since CRX 1–107, a complete activation domain truncation mutant, retained CRX target binding activity [4]. It was predicted that these truncated mutant proteins could interfere with the function of WT CRX by an antimorphic mechanism and cause a severe dominant retinal phenotype. Supporting this hypothesis, E168d1, E168d2, G217d1 and several other truncation mutations were linked to early onset (0–20 years) severe adCoRD/adLCA [22]–[33][36]–[40] and A196d4 was associated with adult onset adCoRD [42] . Furthermore, rescue experiments of the otduvi phenotype in Drosophila demonstrate the CRX truncation mutation I138fs48 possessed dominant-negative activity on target gene expression [46], providing experimental evidence for an antimorphic mechanism for this class of CRX mutations.
Four substitution mutations in the homeodomain: R41W, R41Q, R90W [11][45][47], and K88N [12], also reduced the ability of CRX to bind to and transactivate the Rhodopsin promoter. R41Q and R90W both reduced CRX:NRL protein interaction [11], while K88N additionally interfered with basal NRL-mediated transcription [12]. R41W, R41Q, and R90W were predicted to represent hypomorphic alleles associated with either recessive or less severe dominant forms of disease, while K88N was predicted to possess antimorphic activity on NRL function causing a stronger phenotype. Supporting this hypothesis, R41W, R41Q, R90W and several other substitution mutations were associated with late onset (∼40–60 years old) adCoRD [22][23][33][36][42][45], while K88N was associated with adLCA [12]. A patient homozygous for R90W was also diagnosed with autosomal recessive LCA [45]. In contrast, four other substitution mutations E80A [22][23][33][39], A56T [31], A158T and V242M [42] did not lose DNA binding or transactivating activity [47] and were associated with early onset adCoRD/LCA. In vivo rescue experiments in Drosophila also demonstrate that E80A but not R90W or K88N possesses some dominant-negative activity on Rh5 expression [46]. Collectively these experiments support our hypothesis that substitution mutations may cause disease through several distinct mechanisms.
Currently, there is no treatment strategy for CRX-associated diseases. Establishing animal models that accurately recapitulate different disease mechanisms is critical for developing and testing novel therapeutic approaches. Here we report the generation of two mechanistically distinct Knock-IN (K-IN) mouse models, each carrying a different class of CRX mutation, and present a detailed morphological, functional and biochemical characterization of these mouse models. The frameshift mutation E168d2 produces a severe dominant phenotype through an antimorphic mechanism, while the substitution mutation R90W produces a very mild late-onset ‘CoRD-like’ phenotype in heterozygotes and ‘LCA’-like disease in homozygotes. Furthermore, the expression level of a mutant allele can dramatically affect the disease phenotype, providing insight into potential treatment strategies.
Results
Generation of Crx E168d2 and R90W K-IN mutant mouse models
In this study, we have generated two Crx K-IN mouse lines, each carrying a human disease-causing mutation in the mouse allele (Accession: NM_007770.4). CrxE168d2 (“E168d2”) mice carry a 2-bp deletion mutation, Glu168del2, which resulted in a codon frameshift and early truncation of the transactivation domains of CRX protein (Figure 1A–C). CrxR90W (“R90W”) mice carry Arg90Trp, an amino acid substitution mutation in the homeodomain of CRX (Figure 1A–C). An intermediate subline of each (“E168d2neo” and “R90Wneo”) carrying a neomycin (neo) cassette in intron 3–4 was also maintained (Figure 1B), since the neo cassette specifically reduced the expression of the mutant allele (Figure 2). The neo was removed from the germline by crossing E168d2neo and R90Wneo mice to the Sox2-Cre mouse [48] to generate the final E168d2 and R90W mouse lines (Figure 1B). Successful K-IN was confirmed by PCR amplification of neo (Primer set: Neo F/R) and the respective Crx allele (Table S1, Figure S1) and Sanger sequencing of homozygous mice (Figure 1C).

Mutant CRX is overexpressed in E168d2 but not R90W mice
To determine if E168d2 and R90W K-IN mice properly express their respective CRX proteins, immunofluorescence (IF) staining for CRX was performed on paraffin-embedded retinal sagittal sections of P10 mice (Figure 2). The mouse monoclonal CRX antibody M02 (Abnova) used recognizes WT (Accession: NP_031796.1) and both mutant forms of CRX. Slides were immunostained in the same batch and imaged using a common exposure. As reported previously [13][19][49], CRX staining in WT retina (Figure 2A) was predominantly localized to the outer nuclear layer (ONL), comprised of the rod and cone photoreceptor cell bodies. Less intense CRX staining was also seen in the outer portion of the inner nuclear layer (INL), which is comprised of bipolar and horizontal cell bodies. E168d2 homozygous (“E168d2/d2”) and heterozygous (“E168d2/+”) mouse retinas showed higher intensity CRX staining than WT, especially in the ONL (Figure 2B&C). The heterozygous E168d2neo (“E168d2neo/+”) retina on the other hand showed similar intensity CRX staining as WT retina (Figure 2D vs 2A). In contrast, CRX staining in the ONL of R90W homozygous (“R90W/W”) and heterozygous (“R90W/+”) mouse retinas was reduced compared to WT retinas, although a few cells expressing high levels of CRX are scattered across the ONL (Figure 2E&F). This mosaic pattern of variable CRX expression was not seen in WT retinas. Crx Knock-Out (“−/−”) retinas didn't show CRX reactivity in the ONL and served as negative controls (Figure 2G). The positive CRX staining in E168d2/d2 and R90W/W retinas suggests that the CRX[E168d2] and CRX[R90W] mutant proteins were expressed in the appropriate cell layers.
The expression levels of WT CRX and mutant CRX[E168d2], CRX[R90W] proteins were compared and quantified in P10 E168d2 and R90W K-IN retinas using quantitative Western blots assayed with the polyclonal CRX 119b-1 antibody [7], which also recognized all forms of CRX proteins assayed. WT retina extracts showed a ∼37 kD band (Figure 2H, Lane 1). In contrast, a ∼27 kD dublet CRX band was detected in E168d2/d2 (Lane 2) and homozygous E168d2neo (“E168d2neo/d2neo”) (Lane 3) retinas, suggesting that the CRX[E168d2] protein was a truncated CRX protein as predicted by Sanger sequencing and genomic alignment (Figure 1C). Furthermore, the band intensities suggest that the amount of CRX[E168d2] protein in mutant retinas is higher than that of the full-length CRX in WT retinas (Figure 2H, Lanes 2&3 vs. Lane 1). Quantification of CRX protein levels (Figure 2I) revealed a significant genotype difference (p = 0.0002) overall. E168d2/d2 retinas made twice as much total CRX protein as WT retinas, while E168d2neo/d2neo retinas produce similar amounts of CRX protein as WT retinas.
Heterozygous E168d2/+ (Figure 2H, Lane 4) and E168d2neo/+ (Lane 5) mice expressed both full-length WT CRX and truncated CRX[E168d2] protein but in different ratios. Quantification of CRX protein in E168d2/+ retinal extracts (Figure 2I) revealed that the full-length WT CRX protein was present at approximately half of the level in WT retinas, but the level of CRX[E168d2] protein was more than twice that of the WT CRX. As a result, the total CRX protein level in these retinas was significantly increased by 2-fold compared to normal retinas. E168d2neo/+ retinal extracts also expressed WT CRX at approximately half WT levels but expressed less CRX[E168d2] protein than E168d2/+ retinas (Figure 2H, Lane 5 vs. 1&4, Figure 2I). As a result, the total CRX level in E168d2neo/+ was comparable to the WT control levels. These results are consistent with immunostaining results shown in Figure 2B–D and suggest that the E168d2 allele overproduces mutant protein, which was prevented by the presence of the neo cassette in E168d2neo.
CRX expression patterns in R90W mice differed from E168d2. In P10 R90W/W retinal extracts (Figure 2H, Lane 6; Figure 2I), CRX[R90W] was not significantly different from CRX in WT retinal extracts (Figure 2H, Lane 1; Figure 2I), while levels were reduced in R90Wneo/Wneo retinas (Figure 2H, Lane 7; Figure 2I). R90W/+ retinas (Figure 2H, Lane 8; Figure 2I) had normal total CRX protein levels compared to WT mice, although it was not possible to distinguish the quantity of WT CRX vs. CRX[R90W]. As seen with the E168d2 allele, the presence of the neo cassette reduced total CRX protein levels in R90Wneo/Wneo and R90Wneo/+ retinas, compared to corresponding R90W retinas (Figure 2H, Lane 7 vs. 6, Lane 9 vs. 8; Figure 2I). Thus, the presence of the neo cassette similarly affected the expression of both K-IN alleles.
To investigate whether the changes observed in CRX protein levels correlate with altered Crx mRNA transcription, Crx mRNA levels were determined by quantitative real-time reverse transcriptase PCR (qRT-PCR) (Figure 2J). Specific PCR primer pairs were used that selectively amplified sequences from either WT or total (WT+mutant) Crx cDNA (Primer sets: Crx E168WT F/R and Crx R90WT F/R; Table S1). Primer specificity was validated by amplification of WT, E168d2/d2 and R90W/W retinal cDNA preparations. The results show that E168d2/d2 retinas made twice as much total Crx mRNA as WT retinas, consistent with the elevated CRX protein levels in E168d2/d2. Total Crx mRNA levels in E168d2neo/d2neo retinas were lower than E168d2/d2 levels (FDR p = 0.07) but remained elevated relative to the WT (p<0.05) retinas, in contrast to the normal total CRX protein levels observed in these retinas.
E168d2/+ mice also showed moderately elevated total Crx mRNA levels (Figure 2J). Similar to protein levels, E168d2 mRNA levels (deduced from Total - WT) were much higher than WT levels (∼2∶1 ratio). By comparison, E168d2neo/+ mice expressed slightly elevated levels of total Crx mRNA that were lower than E168d2/+. WT and E168d2 alleles were evenly expressed in these retinas. These results are consistent with the differences in CRX protein levels, supporting an RNA-based mechanism for CRX[E168d2] overexpression, which was partially reversed in E168d2neo/+ mice.
R90W mice showed a distinct pattern of mRNA expression compared to E168d2. R90W/W retinas had normal Crx mRNA levels (Figure 2I), in contrast to their reduced CRX protein levels. This suggests a post-transcriptional mechanism either in the production or degradation of CRX[R90W] protein is likely responsible. Crx mRNA levels in R90Wneo/R90Wneo mice were substantially reduced in comparison to WT (p<0.05) and R90W/R90W mice (FDR p = 0.07). The R90W/+ and R90Wneo/+ mice showed essentially normal levels of total Crx mRNA, contributed either by both alleles equally (in R90W/+) or the WT allele predominantly (in R90Wneo/+). Together, our results suggest that E168d2 and R90W mRNA and corresponding proteins are produced in K-IN mouse retinas, but expression levels are differentially regulated. The mechanism of differential expression appears to be determined by features intrinsic to each mutant allele.
Homozygous E168d2 and R90W mice undergo rapid photoreceptor degeneration and are blind
To determine the effect of E168d2 and R90W mutations on retinal morphology, paraffin embedded retinal sections from E168d2/d2 and R90W/W mice at P14, 1 month (mo) and 3 mo were stained with hematoxylin and eosin (H&E), imaged by light microscopy and compared to sections from WT and −/− mice [3][17]. Cell specification in WT retina is complete by P14 and three distinct neuronal layers are present: the ONL, INL and the ganglion cell layer (GCL) (Figure 3A). At P14 E168d2/d2, R90W/W and −/− retinas all had established normal cellular lamination (Figure 3B–D). Quantitative morphometric measures across the sagittal plane of the retina presented by ‘spider graphs’ (Figure 3M) did not show a genotype*distance interaction (the statistical threshold required to make individual comparisons when analyzing data with two-way ANOVA) (p = 0.15) at P14. These results support previous finding that CRX is not required for retinal cell fate specification [3], including rod photoreceptors, which constitute the majority of cells in the ONL. However, unlike WT retinas none of the mutant ONL cells had begun to form OS's at this age (Figure 3B, C, D vs. A). This OS defect persisted through 1–3 mo when OS's were fully formed in WT retina (Figure 3F, G, H vs. E; J, K, L vs. I). By 1 mo, loss of ONL nuclei was evident in all mutant retinas (Figure 3F–H). In comparison to the ∼12 rows of ONL nuclei seen in WT retinas, E168d2/d2 had only ∼3–4 rows, and R90W/W and −/− had ∼7–9 rows (Figure 3F, G, H vs. E). Quantification of ONL thickness shows photoreceptor degeneration occurred evenly across the sagittal plane of all mutant retinas (Figure 3N, red, green & blue lines vs. black). While R90W/W and −/− mice had similarly reduced ONL thickness (green and blue line, respectively), E168d2/d2 retinas showed greater ONL thinning at 1 mo (red line vs. green & blue), suggesting that degeneration was accelerated in these retinas. At 3 mo, all models exhibited greatly reduced ONL thickness (Figure 3O) with only ∼2–3 rows of ONL cells remaining (Figure 3J, K, L vs. I), suggesting ONL degeneration is progressive and extensive in all homozygous mutant mice.

To determine if ONL thinning is mediated by programmed cell death, “terminal deoxynucleotidyl transferase dUTP nick end labeling” (TUNEL) analysis was performed on P21 and P35 sagittal retinal sections (Figure S2). At P21 (Figure S2A–E), E168d2/d2, R90W/W and −/− mice all had significantly increased TUNEL+ cells present, almost exclusively in the ONL, E168d2/d2 exhibited the highest number of TUNEL+ cells (∼34 fold over WT). At P35 (Figure S2F–J), TUNEL+ cells remained elevated in the ONL of all mutant models but E168d2/d2 mice showed fewer TUNEL+ cells compared to R90W/W and −/− mice. There was no increase in TUNEL+ cells in other retinal layers of any of the mutant mice. These timecourse analyses suggest that the peak of ONL degeneration is earlier in E168d2/d2 mice compared to R90W/W and −/− mice, corresponding with the earlier ONL thinning observed in morphometric analyses.
To assess the consequence of these morphological changes on retinal function, electroretinograms (ERG) were performed under various light intensities on WT, E168d2/d2 and R90W/W mice at 1 month of age [50]. E168d2/d2 and R90W/W mice did not show any detectable dark-adapted or light-adapted responses (Figure S3). These results suggest E168d2/d2 and R90W/W mice are blind at young ages, similar to the phenotype reported for −/− mice [3]. The functional deficits of rod and cone photoreceptors in E168d2/d2 and R90W/W mice are consistent with the necessity of photoreceptor OS's for phototransduction [15][16] and suggest defective development of photoreceptor function in the homozygous mutant mice, similar to deficits in retinal function in LCA patients.
In spite of reduced Crx expression levels, homozygous mice from the sublines of each strain that carry a neo cassette (E168d2neo/d2neo, R90Wneo/Wneo) displayed retinal morphology and function (data not shown) that was indistinguishable from the respective neo-deleted line. Thus, in homozygous mice lacking WT alleles, the onset and rate of photoreceptor degeneration was not greatly affected by mutant protein expression level.
Heterozygous E168d2/+ mice, but not R90W/+, develop progressive rod dystrophy
To determine the inheritance of E168d2 and R90W-associated phenotypes, retinal morphology of heterozygous E168d2/+, E168d2neo/+ and R90W/+ mice was assessed by histology and morphometry. Paraffin embedded sagittal retina sections of heterozygous mutant mice at P14, 1 mo, 3 mo and 6 mo were stained with H&E, imaged by light microscopy and compared to WT sections (Figure 4A–P). At P14, all retinas of heterozygous mutant mice displayed normal cellular lamination (Figure 4B–D vs. A). However, morphometric measurements of the ONL thickness showed that E168d2/+ had increased thickness at the two points most proximal to the optic nerve head (ON) (Figure 4Q, colored lines vs. black). E168d2/+ retinas also showed shortened rod OS's compared to WT (Figure 4B vs. A). The OS defect in E168d2/+ retinas remained at 1 mo (Figure 4F vs. E), 3 mo (Figure 4J vs. I) and 6 mo (Figure 4N vs. M). At 1 mo and 3 mo (Figure 4E–L, R–S), morphometric measurements of ONL thickness did not identify a significant genotype*distance interaction overall, therefore differences at each distance were not tested. However, at 3 mo, E168d2/+ had fewer rows of ONL cells ∼6–8 and had reduced mean ONL thickness at each distance. By 6 mo, most of E168d2/+ ONL cells had degenerated with only ∼2–3 rows of nuclei remaining (Figure 4N vs. M; Figure 4T, red vs. black line). By morphometric analyses, E168d2/+ exhibited reduced ONL thickness at all distances. These results suggest that E168d2/+ retinas undergo progressive rod photoreceptor degeneration through 6 mo of age. Consistent with this observation, TUNEL analysis showed at P35 E168d2/+ mice had 15-fold more TUNEL+ cells than WT all of which were located in the ONL (Figure S2L vs. K; Figure S2O), consistent with the observed photoreceptor degeneration phenotype. These results suggest that the E168d2 mutation causes dominant rod photoreceptor morphological defects and degeneration.

To determine if mice expressing lower levels of CRX[E168d2] protein have a less severe retinal phenotype, the morphology of E168d2neo/+ retinas was compared with that of E168d2/+ retinas. At P14, similar to E168d2/+ (Figure 4B), the OS's of E168d2neo/+ mice appeared shorter than in WT mice (Figure 4C vs. A). However, unlike E168d2/+, E168d2neo/+ formed fully elongated outer segments by 1 mo (Figure 4G vs. F), which were well maintained at 3 mo (Figure 4K vs. J) and 6 mo (Figure 4O vs. M). These results suggest that, despite a delay in maturation, E168d2neo/+ mice had less disrupted rod photoreceptor structure than E168d2/+. Furthermore, E168d2neo/+ did not show significant thinning of the ONL through 6 mo (Figure 4S&T, blue vs. black line) or elevated TUNEL+ cells compared to WT (Figure S2M vs. K; Figure S2O). Overall, the rod photoreceptor phenotype of E168d2neo/+ mice is mild compared to E168d2/+ mice, suggesting that E168d2 disease severity was influenced by the expression level of the mutant allele in heterozygous mice, consistent with E168d2 being an antimorphic mutation.
To further reveal morphological defects in E168d2 photoreceptors at the ultra-structural level, transmission electron microscopy (TEM) imaging analyses were performed on the retinas of P21 E168d2/+, E168d2neo/+ and WT mice (Figure 4U–W; Figure S4). Images were randomly coded for blinded data analysis. Compared to the morphology of WT OS's (Figure 4U), E168d2/+ mice (Figure 4V) exhibited severely shortened and disordered OS's including the presence of ‘wave-like’ disc patterns (white ‘*’s), ectopic vesicle formation (white ‘+’s), and improper stacking of OS discs including vertically oriented discs (white triangles). OS morphology was largely normal in E168d2neo/+ mice (Figure 4W); although minor ‘wave-like’ disc patterns and ectopic vesicle formation were occasionally seen.
Rod nuclei in P21 WT retina adopt a characteristic nuclear architecture with large areas of highly electron dense heterochromatin in the center and smaller regions of translucent euchromatin in the nuclear periphery [51] (Figure S4A&D). The chromatin pattern of E168d2/+ rods, however, appeared less condensed than WT (Figure S4B&E vs. A&D). This did not occur in E168d2neo/+ mice (Figure S4C&F vs. A&D). To quantify these changes, the percentage of the nuclear area comprised of condensed heterochromatin was measured in randomly selected WT, E168d2/+ and E168d2neo/+ rod nuclei. Figure S4G shows that the mean area of heterochromatin in E168d2/+ rods was significantly reduced by 8% compared to WT. This reduction in rod heterochromatin territory was not seen in E168d2neo/+ mice, suggesting more normal rod nuclear architecture. In addition, photoreceptor degeneration in E168d2/+ and E168d2neo/+ mice was evidenced by the presence of highly electron dense nuclei corresponding to pyknotic photoreceptor cells undergoing cell death, which were not observed in WT retinas (Figure S4E&F vs. G, white pentagon).
Unlike E168d2/+, R90W/+ mice had normal retinal morphology at all ages (Figure 4D, H, L&P), comparable to +/− mice [3]. They formed and maintained full-length OS's and normal ONL thickness (Figure 4H, L&P) through 6 mo of age. No increase in TUNEL+ cells over WT was detected (Figure S2N&O). These results suggest rod photoreceptor development and maintenance are normal in R90W/+ mice. This is consistent with clinical evaluations for heterozygous R90W carriers in human cases [22][23][33][42][45].
Heterozygous E168d2/+ mice develop early-onset cone dystrophy
Mislocalization of cone nuclei
Cone photoreceptors comprise only ∼3% of ONL cells in mouse retina and their integrity could not be accurately assessed by light microscopy-based histology alone. However, cone nuclei were identified in TEM micrographs by their distinct decondensed chromatin patterns [51] and their nuclear position near the outer edge of the ONL (Figure S4A, white arrows). In the retinas of P21 E168d2/+ mice, few cone nuclei were identifiable in the ONL (Figure S4B&E). The majority of nuclei with ‘cone-like’ decondensed chromatin were misplaced to the inner regions of the ONL adjacent to the OPL (Figure S4E, white arrows).
The number of identifiable cone nuclei in E168d2neo/+ mice was greatly increased compared to E168d2/+, but nuclei were frequently mislocalized to the middle and inner ONL (Figure S4F, white arrows). Thus, cone formation/survival is improved in E168d2neo/+ mice but cone nuclear localization remains abnormal. Taken together, the ultra-structural analyses suggest that rod and cone photoreceptor morphology is highly disrupted in E168d2/+ mice, and less so in E168d2neo/+ mice.
To determine whether the scattered nuclei with decondensed ‘cone-like’ chromatin in E168d2/+ and E168d2neo/+ were indicative of mislocalized cone nuclei, cone specific markers were used to further assess the cell population. Paraffin-embedded retinal sections were immunostained for cone arrestin (CARR, Accession: Q9EQP6.1) (antibody: rabbit polyclonal α-mCARR, Millipore), which stained the cone cell body from the inner segment to the synaptic terminal (Figure 5A–D). Normal cones undergo nuclear migration during development, reaching their final position at the apical ONL by P12 [52][53]. Retinal sagittal sections immunostained with CARR were analyzed to determine cone nuclear position in WT and mutant retinas (Figure 5A–D). Nuclei were assigned to three zones: Inner (IONL), Mid (MONL) or Outer ONL (OONL) (Figure 5A). At P14, while most WT cone nuclei were positioned in the OONL, cone nuclei in E168d2/+ were mostly (>70%) positioned in the IONL and the majority of E168d2neo/+ cone nuclei (∼70%) were mislocalized in the MONL (Figure 5E, Figure S5A). At 1 mo, E168d2/+ cone nuclei remained highly scattered (Figure 5B, white arrow) with less than 20% localized to OONL (Figure 5F), while most E168d2neo/+ cone nuclei (∼80%) had migrated to the OONL although a significant number (11%) remained in the MONL (Figure 5C white arrows; Figure 5F; Figure S5B). Thus, cone nuclear migration was largely ablated in E168d2/+ mice, while this phenotype was less severe in E168d2neo/+ mice. In contrast, cone nuclei localization in R90W/+ retina was mildly affected at P14 (∼17% in MONL) (Figure 5E) but was normal at 1 mo of age (Figure 5D&F).

Progressive cone degeneration
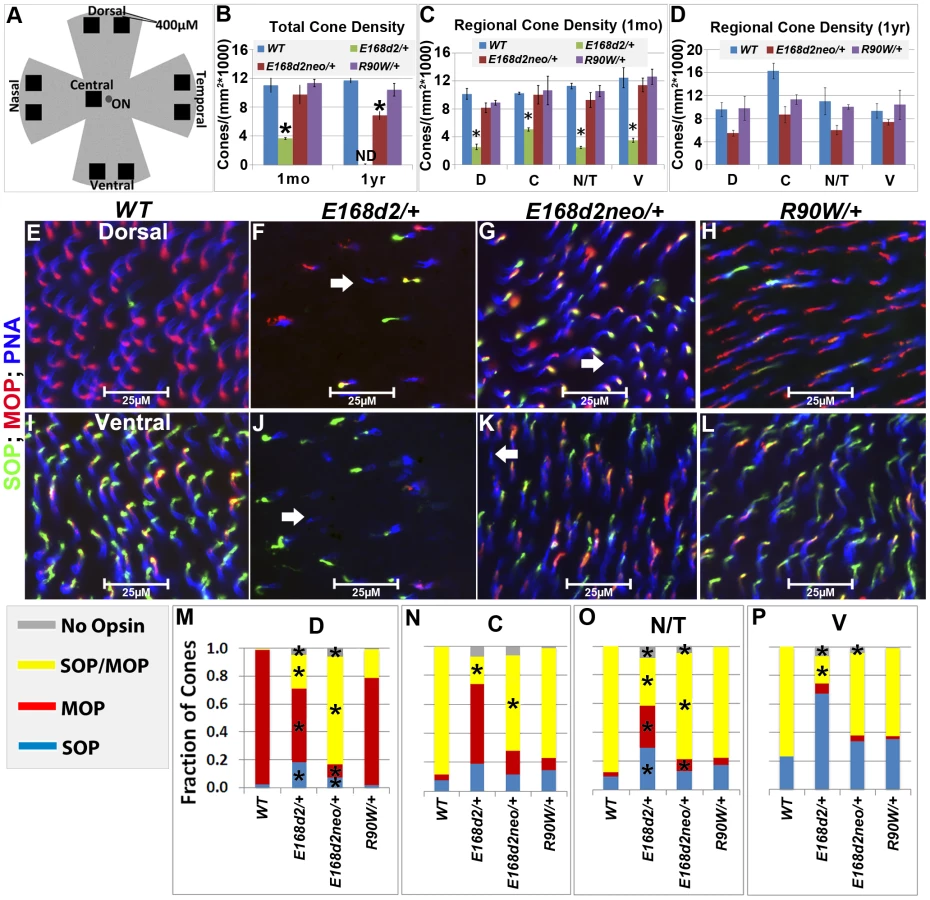
The numbers of CARR+ cones in P14 and 1 mo E168d2/+ retina sections were noticeably reduced compared to WT retina (Figure 5B). This could have been caused by either missing cone photoreceptors or aberrant CARR expression. Indeed, the expression of CARR was previously shown to be CRX-dependent [3] and was reduced in E168d2/+ and E168d2neo/+ retinas (see below). To accurately determine the integrity of the cone population in heterozygous mutant retinas, another pan cone marker, peanut agglutinin conjugated to Rhodamine (PNA, Vector labs) was used in immunofluorescence staining of whole-mount retinas (Figure 6). Unlike CARR, PNA reactivity was independent of CRX's regulatory function and marked the membrane sheath of all cones [54], thus allowing for the accurate assessment of cone density in mutant retinas. Whole-mount retina preparations of 1 mo and 1 year (yr) old heterozygous K-IN mice were stained with PNA (Figure 6E–L, blue stain). 40× fluorescent images were taken of the dorsal (D), ventral (V), nasal/temporal (N/T) and central (C) retina (diagrammed in Figure 6A), and cone density from each region was determined by counting PNA+ cells. At 1 mo, total cone density from E168d2/+ retinas over all regions was reduced by 67.7±1.3% (Figure 6B&C, green vs. blue bars), suggesting a cone deficit prior to rod degeneration. Cone density in 1 yr old E168d2/+ retinas was not determined because ONL degeneration was already extensive by 6 mo (Figure 4N). Cone density was preserved in E168d2neo/+ mice at 1 mo but was reduced by 39.6±5.3% at 1 yr (Figure 6B, red vs. blue bar in each age group). Further comparing the cone density in different regions of E168d2neo/+ retina showed that cone density was normal in all regions at 1 mo (Figure 6C, red vs. blue bars) and in the ventral retina at 1 yr of age, but was reduced in all other regions (Figure 6D, red vs. blue bars). These results suggest that E168d2/+ mice had early cone deficits, while cones were maintained longer in E168d2neo/+ retinas. In contrast, R90W/+ mice had normal overall cone density through 1 yr (Figure 6B&C, purple vs. blue bars), despite modestly reduced cone density in the central region with age.
Malformation of M/S cone opsin gradient
Mouse cones consist of three subtypes defined by which cone opsins they express: OPN1MW (MOP, Accession: NP_032132.1), OPN1SW (SOP, Accession: NP_031564.1) or both opsins. In normal mouse retina, MOP and SOP are expressed in opposing gradients along the dorsal-ventral axis [55]. In the dorsal retina, a high percentage of cones express MOP, a few cones express SOP and no cones express both. Moving towards the central and ventral retina, there is an increase in SOP and MOP/SOP co-expressing cones [56]. The formation of the cone opsin gradient in Crx mutant retinas was assessed by IF staining of whole-mount retinas with polyclonal rabbit anti-red/green opsin (Millipore), polyclonal goat anti-OPN1SW (Santa Cruz) antibodies and PNA. Fluorescence images acquired in the regions diagrammed in Figure 6A of control WT retinas showed the clear formation of the cone opsin gradient as expected (Figure 6E&I).
At 1 mo, E168d2/+ mice had low levels of the cone opsins in their outer segments and did not establish the M/S opsin gradient properly (Figure 6F&J). This conclusion was confirmed by quantification of the fraction of cones (PNA+) expressing MOP, SOP, both opsins or no opsin in tested regions (Figure 6M–P). E168d2/+ dorsal retina showed a reduction in the proportion of cones expressing MOP only, but an increase in cones expressing SOP or both opsins (Figure 6F&M, E168d2/+ vs. WT). In contrast, E168d2/+ ventral retina showed a large decrease in the percentage of MOP/SOP co-expressing cones and an increase in cones expressing SOP only (Figure 6J&P, E168d2/+ vs. WT). Changes in M/S opsin patterns in central and nasal/temporal regions were also seen in E168d2/+ mice (Figure 6N&O, E168d2/+ vs. WT). Overall, E168d2/+ mice had a lower percentage of co-expressing cones and failed to properly regulate opsin expression across the dorsal-ventral axis. In addition, the levels of opsin on individual cone outer segments were highly variable in E168d2/+ retinas, and some PNA+ cells did not have any detectable opsin (Figure 6F&J, white arrows). These results suggest that cone opsin expression, trafficking, or both were affected in E168d2/+ retina.
In contrast, the levels of MOP and SOP were closer to normal in E168d2neo/+ cones but the opsin gradient remained highly disrupted (Figure 6G&K vs. E&I). As shown in the bar graphs, the percentage of cones co-expressing MOP/SOP was increased dramatically in E168d2neo/+ dorsal retina (Figure 6M, E168d2neo/+ vs. WT), while the percentage of co-expressing cones was decreased in the central, nasal/temporal and ventral retina (Figure 6N–P, E168d2neo/+ vs. WT). These results suggested that in E168d2neo/+ retinas, despite having normal cone numbers at 1 mo, the cone opsin gradient was not properly established, which may have contributed to the deficits in cone function (see below) and long-term survival.
By comparison, R90W/+ mice showed largely normal M/S opsin expression and gradient formation across the dorsal to ventral retina (Figure 6H&L vs. E&I). Quantification did not reveal any significant differences in the fraction of cones expressing each opsin in any of the regions surveyed (Figure 6M–P, R90W/+ vs. WT).
Taken together, assessment of the cone photoreceptor population in mutant mice reveals that cones do not develop properly in E168d2/+ retinas and cone defects arise earlier and are more severe than rod defects. E168d2neo/+ retinas showed more normal cone photoreceptor development and morphology and slower cone degeneration than E168d2/+ retinas. However, cone subtype specification remained disrupted in E168d2neo/+ retinas. Reduction in the number of cones in E168d2/+ and E168d2neo/+ before rod degeneration was consistent with a ‘cone-centric’ phenotype. In contrast, R90W/+ mice had largely normal cone morphology, did not exhibit any significant cone subtype differences and no changes in overall cone density through 1 yr.
Functional defects in heterozygous E168d2/+ and R90W/+ mice
Heterozygous E168d2 mice show severe rod/cone functional deficits
To determine if rod and cone photoreceptor morphological abnormalities and degeneration correspond with impaired retinal function, ERG's were performed on E168d2/+, E168d2neo/+, R90W/+, and +/− mice at 1 mo, 3 mo and 6 mo (Figure 7). First, ERG analyses were carried out on dark-adapted animals to assess rod-driven function. The responses to light flashes of increasing intensities were recorded, and the amplitudes of the A-waves (arising from the hyperpolarization of photoreceptors) and B-waves (arising from the activity of the photoreceptor-driven inner retina) [50] were measured. The results were plotted as average peak amplitudes of A and B-waves, against serial log scale light intensities (Figure 7A, B, D, E, G&H, black line). Next, ERGs were performed after 10 minutes of light adaptation to measure cone-driven responses. The average peak amplitudes of light-adapted B-waves were plotted against log scale light intensity (Figure 7C, F&I, black line). A significant genotype*light flash intensity interaction (by two-way ANOVA, p<0.05) was detected at every time point for both dark and light-adapted tests. At 1 mo, both dark-adapted A and B-waves were detectable in E168d2/+ mice particularly in high light intensities, but the peak amplitudes were significantly reduced compared to WT controls (Figure 7A&B, green vs. black line), indicating impaired “rod-driven” function. E168d2/+ rod function declined further with age, as the peak amplitudes became progressively smaller at 3 mo and 6 mo (Figure 7D, G vs. A; E, H vs. B, green line), corresponding with rod degeneration. For illustrative purposes, the progressive nature of rod functional deficits was demonstrated by the mean percent reductions of dark-adapted A and B-wave amplitudes (Table 1, E168d2/+ columns). Percent reduction for both A and B-waves increased from 1 mo to 6 mo suggesting further deviation from WT function.


Cone-driven light-adapted B-wave peak amplitudes were barely detectable in E168d2/+ at 1 mo (Figure 7C, green line) and all later ages tested (Figure 7F&I, green line), corresponding with the early reduction of cone number. The mean percent reductions in light-adapted B-wave amplitudes were more severe than those seen in dark-adapted A or B-wave amplitudes (Table 1, E168d2/+ columns), suggesting that cone function was more severely affected than rod function in E168d2/+ mice.
Compared to E168d2/+, E168d2neo/+ mice show significantly less impaired dark-adapted A and B-wave peak amplitudes for most light intensities at all the ages tested (Figure 7A, B, D, E, G&H, red line vs. green line). E168d2neo/+ mice only had minor ‘rod-driven’ functional deficits compared to WT mice (red line vs. black line). These findings are summarized in Table 1. The average percent reductions of the dark-adapted A and B-waves in E168d2neo/+ mice were much less than E168d2/+ for all three ages tested. More importantly, the minor deficits in E168d2neo/+ ‘rod-driven’ function did not progress with age, consistent with improved rod survival. Light-adapted B-waves were also significantly more robust in E168d2neo/+ mice, compared to E168d2/+ mice (Figure 7C, F&I, red vs. green line), but remained significantly reduced, compared to WT mice (red vs. black line). E168d2neo/+ cone deficits were more severe than rod deficits as shown by higher percent reductions in light-adapted B-waves than dark-adapted B-waves (Table 1, E168d2neo/+ columns). These defects were first detected at 1 mo and persist through 6 mo. Thus, while E168d2/+ mice had severely impaired rod and cone function resembling an ‘LCA’ phenotype, E168d2neo/+ mice had ‘cone-centric’ deficits in retinal function, modeling a ‘CoRD’ phenotype. The ‘cone-centric’ morphological and functional deficits of E168d2neo/+ mice, together with the early cone deficits in E168d2/+ mice, suggest that cones may be more sensitive than rods to the antimorphic effect of CRX[E168d2] protein.
Heterozygous R90W mice show minor late-onset cone functional deficits
Previous studies report subtle ERG deficits in +/ − mice [3], but in our studies R90W/+ and +/ − mice did not show significant ERG deficits at 1 mo or 3 mo (Figure 7A–F, blue and orange line, respectively). At 6 mo, R90W/+ mice exhibit minor light-adapted B-wave deficits at the 1.88, 2.39 and 2.82 cdS/m2 flash intensities (Figure 7I, blue vs. black line), while +/ − were functionally normal, suggesting late-stage cone defects in R90W/+ mice. The difference between our studies and previous studies on +/ − could have been due to mouse strain background, since the original Crx KO characterization was performed on a mixed background of 129Sv×C57BL/6 [3]. All experiments in this paper were performed on a congenic C57BL/6J background. Nevertheless, the R90W mutation produced only a mild late-stage cone functional phenotype in heterozygous mice, while the E168d2 mutation in heterozygous mice caused an early-onset severe impairment of rod and cone function that depended on the expression level of the E168d2 allele relative to WT.
E168d2 mutation impairs target gene expression more severely than null, while R90W mutation produces a hypomorphic effect
Gene expression changes in homozygous mutants
To understand the molecular mechanisms underlying the observed morphological and functional deficits in K-IN mutant retinas, we compared retinal transcription profiles of homozygous E168d2neo and R90Wneo mice with WT and −/ − controls to determine the effects of mutant CRX protein on target gene expression. We chose to use homozygous mice from the neo+ sublines, which express the mutant protein at lower levels than the final lines, for the gene profiling analyses to avoid alterations in gene expression that could arise strictly from mutant CRX overexpression. Unlike subline differences observed in heterozygous mutant mice, morphological and functional characterization demonstrated that the phenotypes of homozygous mice from neo+ and final neo - sublines were indistinguishable. Expression profiling results were validated by qRT-PCR for several genes in all sublines. RNA from sex-matched pairs of P10 retinas for each genotype was reverse transcribed into cDNA, which was hybridized onto Illumina mouse Ref6 expression microarrays. Microarray analyses showed a high degree of overlap of differentially expressed genes in homozygous E168d2neo, R90Wneo and −/− mice (Figure 8A&B). The complete list of differentially expressed genes is available in Tables S2 and Table S3, and the raw datasets are available at NCBI GEO website (http://www.ncbi.nlm.nih.gov/gds, access number: GSE51184). For downregulated genes: 70.6% of E168d2neo and 93.5% of R90Wneo genes were shared with −/− (Figure 8A). For upregulated genes: 59.8% of E168d2neo and 75% of R90Wneo genes were shared with −/− (Figure 8B).

To determine which differentially expressed genes were directly bound by CRX, datasets from chromatin immunoprecipitation sequencing (ChIP-Seq) of WT CRX protein in WT and Nrl Knock-Out mice [21] were compared with target genes identified by microarray. Downregulated genes in E168d2neo, R90Wneo and −/− mice showed a high correlation of direct CRX targets (76.8% E168d2neo, 83.0% R90Wneo, 84.37% of shared genes), compared to upregulated genes (46.7% E168d2neo, 41.7% R90Wneo, 66.7% of shared genes) suggesting that mutation or loss of CRX is mainly associated with reduced expression of direct CRX target genes (Figure 8C). However, upregulated genes were more frequently bound by CRX than binding genome-wide (22.6%), suggesting that mutation or loss of CRX also affects expression of genes directly repressed by CRX.
While E168d2neo, R90Wneo and −/− mutations affected similar sets of genes, distinct degrees of gene expression changes were observed. Heat map analysis showed the majority of shared downregulated genes were more strongly reduced in E168d2neo and −/− compared to R90Wneo (Figure 8D). The less reduced expression of downregulated CRX target genes in R90Wneo mice suggests that R90Wneo retains some weak ability to promote transcription. E168d2neo and −/− had similar heat map profiles but several key photoreceptor genes were lower in E168d2neo including: Rho, Arr3, Ramp3, Drd4, Cpm, and Pde6c (Accessions: NM_145383.1, NM_133205.3, NM_019511.3, NM_007878.2, NM_027468.1, AF411063.1, respectively). The more severe reduction in gene expression in E168d2 is consistent with its accelerated photoreceptor degeneration compared to R90W and −/−. It is notable that many shared downregulated genes encode proteins in the phototransduction and visual cycle pathways essential for establishing vision (Figure 8E), including: Opn1sw, Opn1mw, Gnat1, Gnat2, Rcvrn, Pde6a, Pde6g, (Accessions: NM_007538.3, NM_008106.2, NM_008140.2, NM_008141.2, NM_009038.2, NM_146086.2, NM_012065.2, respectively) Rho, Arr3, and Pde6c. Other downregulated genes encode proteins with function in key cellular processes, including metabolism and mitochondrial function, membrane stability/function, synaptic function, intercellular transport, and transcription/translation (Figure 8E), which likely contribute to the morphological and functional defects. Furthermore, many downregulated genes were associated with the human diseases RP, LCA and CoRD (Table S4, https://sph.uth.edu/retnet/), overlapping with those reported for CRX mutations.
To confirm graded changes in target gene expression, levels of several key CRX target genes were validated in homozygous mice of all mutant lines using IF staining (Figure 8F–I) and/or qRT-PCR analyses (Figure 8J–M, Table S5, Table S6). IF staining showed that homozygous E168d2neo retinas failed to produce rhodopsin (RHO) in contrast to −/− which still made a low amount of RHO (Figure 8G vs. I). This suggests that CRX[E168d2] protein has an inhibitory effect on Rho expression beyond complete loss of CRX protein. Homozygous R90Wneo retinas, on the other hand, produced RHO at a level higher than −/− but much lower than WT retinas (Figure 8H vs. F&I). Expression changes of a number of genes in the retinas of homozygous mutants from the neo+ and final neo - lines were validated using qRT-PCR, including the rod gene Rho and the cone genes Arr3, Opn1sw and Opn1mw (Figure 8J–M, Table S5). The results, presented as fold change (FC) relative to WT, from P10 homozygous mice of the ‘low expression’ subline and final line of each mutation were compared (Figure 8J–M). Rho expression was essentially abolished in both E168d2 and E168d2neo mice. In contrast, R90W and R90Wneo mice expressed Rho at levels slightly higher than −/− (Figure 8J). These results are consistent with the microarray and IF results described above. Expression of the cone gene Arr3 was not detectable in E168d2 or E168d2neo mice, while residual amounts were detected in R90W, R90Wneo and −/− mice (Figure 8K). Opn1sw and Opn1mw were strongly downregulated in homozygous mice of all models. The loss of expression of genes involved in rod/cone phototransduction explains the loss of visual function in these mice. Together, our results suggest that the E168d2 mutation produced a direct antimorphic effect on photoreceptor gene expression beyond CRX deficiency, while R90W is a hypomorph mutation, resulting in a CRX protein with impaired residual transcriptional regulatory function.
Gene expression changes in heterozygous mutants
To determine if gene expression changes in heterozygous mice followed the same trend as homozygous mutants, expression of the selected CRX target genes, Rho, Arr3, Opn1sw and Opn1mw, was evaluated in heterozygous mutants using IF staining of retinal sections at 1 mo of age (Figure 9A–D) and/or qRT-PCR at P10 and P21 (Figure 9E–H, Table S5, Table S6). IF staining for RHO at 1 mo showed that E168d2/+ mice displayed low intensity of RHO staining, some of which was mislocalized to the ONL (Figure 9B vs. A), suggesting impaired RHO trafficking. This phenotype was not seen in E168d2neo/+ and R90W/+ retinas (Figure 9C, D vs. B). qRT-PCR analyses showed that E168d2/+ mice exhibited persistent downregulation of all genes tested in both P10 and P21, despite some degree of recovery at P21 (Figure 9E–H, Table S5, Table S6). Expression of these genes was also decreased in E168d2neo/+ mice, but significant improvements were seen for Rho and Opn1mw, compared to E168d2/+ mice. The more severe impairment of gene expression in E168d2/+ compared to E168d2neo/+ demonstrates the dosage effect of CRX[E168d2] mutant protein. In contrast, R90W/+ and +/ − mice exhibited reduction in the expression of some genes at P10 but normal expression was observed at P21. The degree of expression changes in individual mutants varied from gene to gene. These results suggest that CRX[E168d2] mutant protein actively impaired CRX target gene transcription in the presence of WT protein, consistent with an antimorphic mechanism. This antimorphic effect depends on CRX[E168d2] protein dosage and can be reduced by decreasing CRX[E168d2] expression. In contrast, R90W/+ essentially phenocopied the phenotype of +/−, suggesting that CRX[R90W] protein did not severely interfere with the function of WT CRX in vivo, which allowed for normal photoreceptor gene expression by P21.

CRX[E168d2] protein binds target DNA and interferes with WT CRX function, while CRX[R90W] protein retains marginal DNA binding and transactivating activity
To determine how mutant forms of CRX protein affect target gene transcription, we assessed their ability to bind to DNA and transactivate transcription. First, electrophoretic mobility shift assays (EMSA) were used to measure DNA binding activity of CRX WT, CRX[E168d2] and CRX[R90W] protein expressed in HEK293 cells on the rhodopsin promoter target site BAT-1 [1] (Figure 10A). To compare relative binding affinity, the amount of CRX in each nuclear extract was quantified using Western blots and equalized between transfections (Figure 10B). EMSA was then performed on a 2-fold dilution series of nuclear extracts of each CRX protein. Following incubation with BAT-1 probe, WT CRX extract produced a single species of specific band shift (marked as ‘WT’) with a concentration-dependent intensity. This shifted band represented specific binding of the indicated CRX protein to BAT-1 CRX sites, as it is absent in the lane receiving the GFP control extract and when the probe contains mutated CRX binding sites (BAT-1 Mut AB). CRX[E168d2] nuclear extract also produced a specific band shift (marked ‘E168d2’), which migrated much faster than the full-length CRX band as expected for a truncated protein. The intensity of the E168d2 band was comparable to the WT full-length band at each corresponding concentration, suggesting that CRX[E168d2] binds target sites with similar efficiency as WT CRX, providing a basis for competition binding to common targets. In contrast, CRX[R90W] nuclear extract produced a faint band with the same mobility as WT (Figure 10A), but significantly reduced intensity (∼69% lower than WT). Reduced but not abolished DNA binding activity was also reported for bacterially expressed CRX homeodomain peptides carrying the R90W mutation [47]. These results support the hypothesis that CRX[E168d2] protein maintains normal DNA binding ability, while CRX[R90W] protein has reduced DNA binding ability.
![CRX<sup>[E168d2]</sup> and CRX<sup>[R90W]</sup> affect target gene transcription through distinct molecular mechanisms.](https://pl-master.mdcdn.cz/media/cache/media_object_image_large/media/image/c8bc49e9731a054010c75953c74b1564.png)
To determine if in vitro DNA binding activity of each mutant reflected ability to associate with target chromatin in vivo, the association of WT CRX, CRX[E168d2] and CRX[R90W] protein with target gene promoter regions was examined using chromatin immunoprecipitation (ChIP) assays. ChIP was performed on P10 mouse retinas of WT, E168d2/d2, R90W/W and −/− mice using the CRX 119b-1 antibody [7]. As expected, enrichment of CRX[E168d2] protein was detected on the promoter of genes expressed in rods (Rho, Gnat1), cones (Arr3, Opn1mw, Opn1sw) and both rods/cones (Crx, Rbp3 (Accession: AJ294749.1)) (Figure 10C, red bars). Despite reduced DNA binding activity in vitro, CRX[R90W] protein was found on the promoter of all candidate genes tested (Figure 10C, green bars). The mechanism by which CRX[R90W], which has reduced DNA-binding ability, is recruited to target gene chromatin in vivo remains to be determined. However, these results are consistent with R90W's hypomorphic effect on target gene expression in the retina (Figure 8, Figure 9).
The ability of CRX[E168d2] and CRX[R90W] proteins to transactivate target promoters, either alone or in combination with WT CRX, was assessed by dual-luciferase reporter assays in transiently transfected HEK293 cells. Consistent with a previous report [47], WT CRX was able to cooperate with NRL to activate a Rhodopsin promoter-driven luciferase reporter, BR130 (Figure 10D). However, CRX[E168d2] failed to increase transactivation above NRL alone, suggesting that CRX[E168d2] was unable to form functional interactions with transcription co-activators despite its normal DNA binding ability. In contrast, CRX[R90W] weakly promoted NRL-mediated transactivation, consistent with CRX[R90W]'s weak ability to bind target DNA (Figure 10A) and interact with NRL [11] in vitro to promote low levels of gene expression in the retinas of homozygous R90W mice (Figure 8). To test the effect of mutant protein on WT CRX function, E168d2 and R90W expression vectors were each co-transfected at increasing concentrations with WT CRX. CRX[E168d2] protein significantly impaired WT CRX function when the ratio of E168d2:WT vector reached 2∶1 or higher, suggesting CRX[E168d2] actively interfered with WT CRX via an antimorphic mechanism, consistent with the dose-dependent toxicity observed in E168d2/+ and E168d2neo/+ mice. In contrast, at the same mutant:WT vector ratios, CRX[R90W] protein did not disrupt WT protein function, consistent with the hypomorphic effect of R90W in mice.
The Crx promoter is another known CRX direct target. It contains two CRX consensus binding sites within a 500-bp upstream region that is required for CRX auto-activation [57]. However, unlike Rhodopsin, which is downregulated, Crx was overexpressed in E168d2 mice (Figure 2). To determine if Crx overexpression resulted from the direct action of CRX[E168d2] protein on the Crx promoter, dual-luciferase reporter assays using the 0.5K Crx promoter were performed (Figure 10E). As expected, WT CRX protein transactivated this in a concentration-dependent manner (Figure 10E), while CRX[E168d2] and CRX[R90W] at the highest concentration did not transactivate. When both WT and mutant proteins were present, CRX[E168d2] interfered with the transactivation activity of WT CRX, even at a 1∶2 mutant:WT vector ratio. CRX[R90W] protein also reduced WT CRX transactivation activity, though less strongly, at the 1∶1 and 2∶1 mutant:WT vector ratios. These results suggest that both CRX[E168d2] and CRX[R90W] proteins 1) are less effective than WT CRX at activating target promoters, and 2) interfere with WT CRX autoactivation.
Taken together, functional analyses of CRX[E168d2] and CRX[R90W] proteins revealed that they affected target gene transcription via distinct mechanisms. While CRX[E168d2] bind DNA equally well as WT CRX, it fails to activate transcription and interferes with WT CRX function, resulting in a dose-dependent antimorphic effect. In contrast, CRX[R90W] has reduced ability to bind target DNA and regulate transcription, qualifying CRX[R90W] as a hypomorphic protein.
Discussion
E168d2 and R90W mouse lines accurately model the corresponding human diseases
E168d2 mice model dominant ‘LCA’ or severe early-onset ‘CoRD’
While all homozygous K-IN mice assessed in this paper demonstrated ‘LCA’-like phenotypes, only E168d2/+ mice presented with dominantly inherited retinopathy characteristic of ‘LCA’ or severe early-onset ‘CoRD’. Rods and cones of E168d2/+ mice were strongly functionally impaired from 1 mo, exhibited abnormal nuclear and OS morphology and degenerated rapidly within the first 6 mo of life (Summarized in Table 2). Importantly, the cone deficits were more severe and occurred earlier than rod deficits. Cone nuclei were mislocalized to the inner ONL at P14 and 1 mo (Figure 5E&F) and the number of cones was decreased (32.3% of WT) in E168d2/+ mice at 1 mo (Figure 6B). In addition, the cone opsin gradient [56] was highly disrupted in E168d2/+ and E168d2neo/+ mice (Figure 6M–P). Misregulation of this gradient could arise either from inability of mutant CRX proteins to properly interact with co-factors to cooperatively regulate opsin expression, or as a result of impaired cone subtype specification. The cone opsin gradient is regulated by multiple transcription factors including RXRγ (Accession: AAH13709.1) [58] and TRβ2 (Accession: NP_033406.1) [59]. Expression of Rxrγ and Trβ2 in E168d2/+ or E168d2neo/+ retinas at P21 was normal as measured by qRT-PCR (Table S6), although Rxrγ expression was elevated at P10 (Table S5). While these data suggest terminal differentiation of cones in E168d2/+ retina may have been compromised, it is unclear if cone deficits were due to impaired cell fate specification, survival, or both. The accurate quantification of cone number was not possible in E168d2/+ retina at P14 or earlier due to reduced expression of cone markers including cone opsins. Future experiments tracing the cone lineage in developing E168d2/+ retinas are needed to distinguish these possibilities.

In summary, the E168d2/+ mouse phenotype closely matched the clinical features of patients diagnosed with LCA who carry the E168d2 mutation. These patients showed severe vision loss detectable within the first few months of life, including markedly reduced ERG responses [24][31][41]. Several pieces of evidence suggest that the E168d2/+ mouse also models human disease associated with other mutations within the class of frameshift truncation mutations. First, several other frameshift and deletion mutations in human CRX caused similar clinical phenotypes [22]–[33][36]–[40]. Second, in vitro functional analyses showed that these mutations resulted in defects in target gene transactivation similar to those we see with E168d2 [12][47]. Third, the recently-identified feline model Rdy, which also carries a frameshift truncation mutation in Crx [60], has severely reduced visual function and progressive photoreceptor degeneration that closely matches the E168d2/+ phenotype [61]. Rdy cats carry a spontaneous single base-pair deletion n.546delC producing a truncated CRX protein just 14 amino acids longer than the CRX[E168d2] protein [60]. Thus, a common pathogenic mechanism is likely responsible for these similar phenotypes in different mammalian species, for which the E168d2 mouse serves as an appropriate small-animal model.
E168d2neo reveals that expression levels of mutant CRX correlate with disease severity
CRX-associated dominant diseases vary in age of onset and severity, even with similar mutations [22][23]. The factors responsible for these phenotype variations have not yet been identified, but comparing findings from E168d2 and E168d2neo mice revealed one possible mechanism. The E168d2neo mouse, which had reduced expression of CRX[E168d2], showed a less severe phenotype than E168d2, resembling later-onset dominant ‘CoRD’. Characterization of the low expression subline E168d2neo/+ (which expressed 30% less mutant protein) in parallel with E168d2/+ revealed that mutant allele expression level significantly impacted phenotype severity. In young E168d2neo/+ mice, the rod phenotype was almost fully rescued and the cone phenotype was significantly improved by all measures performed, including rod and cone morphology (Figures 4–6), function (Figure 7, Table 1), survival (Figure S2) and gene expression (Figure 9, Table S5, Table S6). While older E168d2neo/+ mice did show impaired cone function and degeneration, disease progression was much slower compared to E168d2/+. Thus, while the E168d2 mouse represented the most accurate disease model for the human CRXE168d2 phenotype, the E168d2neo/+ mouse modeled less severe forms of ‘CoRD’. The expression level-dependent phenotypes of the E168d2 mouse lines have several implications: 1) These findings support an antimorphic activity for CRX[E168d2] protein; 2) In human patients carrying similar CRX mutations, features intrinsic to the mutation allele and/or genetic background may affect CRX expression, which could impact disease severity; 3) Consequently, therapy directed at shifting the ratio of WT to mutant CRX protein might be effective at improving vision in patients.
Overexpression of CRX[E168d2] protein in E168d2 mice is caused by unknown mechanism
E168d2 mice overexpressed both Crx mRNA and protein in an allele specific manner (Figure 2H–J), indicating Crx misregulation occurred at the RNA level, either in the synthesis or degradation of the mRNA transcript. Transient transfection assays (Figure 10E) showed that while WT CRX was able to transactivate its own promoter, CRX[E168d2] had lost transactivation activity and interfered with WT CRX autoregulation. Thus, overexpression of the E168d2 allele in vivo was unlikely due to the direct action of CRX[E168d2] protein on the Crx promoter. Other possible mechanisms for E168d2 allele-specific overexpression in vivo include suppression of a negative feedback regulation, changes in transcription efficiency of the E168d2 allele, or stability of the E168d2 transcript. Expression of a known regulator of Crx expression, Otx2 (Accession: NM_144841.3), was altered in E168d2 mice. Otx2 is required for induction of Crx expression during development [49][62] but is normally turned off in differentiated photoreceptors when CRX expression reaches high levels. Otx2 was upregulated at P21 in E168d2/+ retinas (Table S5, Table S6), suggesting that the feedback network was affected in the mutants. A more comprehensive investigation of the network regulating Crx's transcription is required. Alternatively, since the level of RNA made by the mutant allele was much higher than that of the WT allele in E168d2/+ retinas, it is plausible that changes in Crx E168d2 mRNA stability may be involved. More importantly, since this mutant allele-specific overexpression was shared by anther frameshift mutation, I138fs48 in Drosophila [12][46], the underlying molecular mechanism could be conserved for this type of CRX mutation.
R90W mice model mild late-onset dominant ‘CoRD’
While homozygous R90W mice displayed a ‘LCA-like’ phenotype, heterozygous R90W/+ mice didn't exhibit changes in photoreceptor morphology, gene expression or degeneration at the early ages tested (Table 2). However, minor changes in cone function were detectable at 6 mo (Figure 7I), suggesting R90W/+ has a mild dominant phenotype. The R90W/+ phenotype closely resembled the clinical features of a pedigree where the equivalent human R90W mutation was identified [45]: A proband homozygous for R90W had almost complete loss of vision and was diagnosed with autosomal recessive LCA. Her parents, each of whom carried one R90W allele, had mild cone functional defects and reduced color discrimination ability by middle age (40's). It is unknown if the cone functional defects reported for the human carriers are related to misregulation of cone gene expression or cone degeneration. Several other substitution mutations were similarly associated with mild late-onset dominant disease in humans [12][22][23][33][36][42][45]. Overall, reduced numbers of rods or cones were not observed in R90W/+ mice up to one year of age, but disease may appear at later ages. The mild dominant phenotype of R90W/+, not observed in +/− mice, as well as the CRX promoter-driven luciferase assay results (Figure 10E) suggest CRX[R90W] possesses some minor disruptive effects on WT CRX function. Overall, however, unlike E168d2 and E168d2neo, there were no major phenotypic differences observed between R90W and R90Wneo, consistent with CRX[R90W] being predominantly a hypomorphic protein. It is unknown how genetic background or environmental interactions contribute to the substitution mutation disease phenotype. The R90W mouse line provides a valid small animal model for investigating this subset of milder CRX-related diseases.
CRX[E168d2] and CRX[R90W] protein cause disease through distinct mechanisms
Several pieces of evidence support that CRX[E168d2] and CRX[R90W] protein cause disease via different mechanisms, as illustrated in Figure 11. CRX[E168d2] protein bound to DNA, interfered with the function of CRX WT and impaired the expression of CRX target genes, classifying it as an antimorphic protein with dominant-negative activity (Figure 11B). All of our results suggest that CRX[E168d2]'s activity was largely restricted to CRX target genes. Of the 82 uniquely downregulated genes identified in homozygous E168d2neo mice, most (76.8%) also exhibited direct CRX binding. The average fold change of these distinct genes was less dramatic than genes shared between E168d2 and −/−, suggesting they were likely to be similarly affected in −/ − but failed to pass the significance threshold. Many shared genes including: Rho, Arr3, Ramp3, Drd4, Cpm, and Pde6c were more strongly downregulated in homozygous E168d2neo than −/ − mice (Figure 8D). This suggests CRX[E168d2] protein had an antimorphic effect on the expression of these genes even in the complete absence of WT CRX, possibly by interfering with other co-factors like the homeodomain transcription factor OTX2. Supporting this hypothesis, removal of one allele of Otx2 from the −/ − mouse produced a severe phenotype similar to homozygous E168d2 mice [63]. Since OTX2 and CRX have overlapping spatial and temporal roles in retinal development and share DNA binding domain homology, it is possible that CRX[E168d2] interfered with OTX2 activity, resulting in a stronger phenotype than −/−. This antimorphic effect is unlikely to involve interference with NRL function, since NRL expression was comparable in all homozygous models (Table S5), CRX[E168d2] did not interfere with NRL transactivation (Figure 10D) and a similar truncation mutation in bovine CRX C160 (1–160) maintained interaction with NRL [11]. qRT-PCR analysis of CRX target gene expression showed downregulation that correlated with mutant CRX expression level (Figure 9), supporting the conclusion that CRX[E168d2] is an antimorphic mutant protein with dominant negative activity. The E168d2 mouse model thus demonstrates the effects of an antimorphic truncated CRX protein associated with human disease.
![Models for CRX<sup>[E168d2]</sup> and CRX<sup>[R90W]</sup> mechanisms of pathogenesis in <i>K-IN</i> mice.](https://pl-master.mdcdn.cz/media/cache/media_object_image_large/media/image/8c9218d052bbfb80af6763b1551985d9.png)
The CRX[R90W] protein had reduced DNA binding and weakly promoted transcription in vitro, classifying CRX[R90W] as a hypomorphic protein (Figure 11C&F). Although binding of CRX[R90W] to the BAT-1 oligo in vitro was reduced (Figure 10A), CRX[R90W] associated with CRX target DNA in vivo (Figure 10C), suggesting co-factors may anchor CRX[R90W] to target DNA. CRX[R90W] weakly promoted NRL-mediated transactivation of the Rho promoter in vitro (Figure 10D), consistent with early findings that CRX[R90W] protein reduced the physical interaction with NRL [11]. Thus, even though CRX[R90W] was associated with target promoters in vivo, it may have lost specific interactions with co-factors, therefore reducing its function. Indeed, despite being present on target promoters, CRX[R90W] only weakly promoted target gene expression in vivo, as shown by reduced expression of many CRX target genes in homozygous R90W retinas as detected by microarray (Figure 8A–E) and qRT-PCR (Figure 8J–M). However, target gene expression in R90W retinas was less reduced compared to −/ − retinas (Figure 8D, J–M), suggesting CRX[R90W] possessed some residual transcriptional activation activity. In Drosophila, human R90W was able to partially rescue the otduvi phenotype, consistent with a hypomorphic mechanism [46]. Taken together, our results show that CRX[R90W] is a predominantly hypomorphic mutant CRX protein, representative of substitution mutations associated with mild forms of CRX disease.
Mechanistically distinct mutations underlie CRX-associated disease
The molecular functions of several CRX mutations associated with human retinopathy have been investigated in vitro [12][45][47] and in vivo in Drosophila [46]. Such studies indicate that mutant CRX proteins have distinct molecular functions, which could in part explain the variation in CRX-disease phenotypes. The distinct phenotypes of mice carrying E168d2, an antimorphic frameshift mutation, and R90W, a hypomorphic substitution mutation, further expand our understanding of the impact of mutation type on disease pathology and closely match the functions and associated phenotypes of other similar type mutations. This suggests that E168d2 and R90W K-IN mice are representative animal models for two larger groups of disease causing mutations, increasing their utility as research tools for studying pathology and developing therapies. There are likely additional mechanisms of CRX-associated disease yet to be modeled in vivo, such as substitution mutations that do not affect DNA-binding but are nonetheless associated with dominant disease [12][45][47]. Collectively, these studies demonstrate the diversity of molecular defects mediating CRX-associated disease and highlight the value of having multiple small-animal models to understand them.
Crx E168d2, E168d2neo and R90W provide distinct models for therapy development
Currently, there are no treatment strategies for CRX-associated diseases. Since CRX influences many cellular processes, designing targeted therapy is exceptionally difficult. The availability of phenotypically and mechanistically distinct models for CRX-associated disease will greatly improve our ability to develop novel therapies. E168d2, E168d2neo and R90W present unique mechanistic challenges for therapy to address. Stem cell based therapies have previously been shown to restore function in the −/ − mouse [64]. Like −/ − mice, E168d2/+, E168d2/d2 and R90W/W mice all have highly abnormal photoreceptor morphology and undergo rapid degeneration, which may restrict the time course and effectiveness of treatment. The improved phenotype of E168d2neo/+ mice, compared to E168d2/+, provides evidence that gene replacement strategies that shift the ratio of WT to mutant CRX could be effective at improving vision and promoting rod and cone survival in cases were a mutant protein is toxic and/or overexpressed. Previous studies have shown this strategy to be effective in treating a dominant-negative adRP RHO animal model [65][66]. Lastly, the similarity of the E168d2/+ mouse and the Rdy/+ cat provide excellently matched small and large animal models. Therapies that are proven to be effective in the E168d2/+ mouse can immediately be tested in the Rdy/+ cat, which improves our ability to develop translational therapies.
In summary, Crx E168d2 and R90W are mechanistically distinct mouse models for CRX-associated disease, demonstrating how different classes of CRX mutations yield drastically different retinal phenotypes. E168d2 and R90W accurately recapitulate human diseases caused by distinct classes of human mutations and have greatly improved our understanding of disease pathobiology. The availability of these stratified mouse models for CRX-associated disease is an invaluable resource for developing effective mechanism based therapies.
Materials and Methods
Ethics statement
All procedures involving mice were approved by the Animal Studies Committee of Washington University in St. Louis, and performed under Protocols # 20090359 and 20120246 (to SC). Experiments were carried out in strict accordance with recommendations in the Guide for the Care and Use of Laboratory Animals of the National Institutes of Health (Bethesda, MD), the Washington University Policy on the Use of Animals in Research; and the Guidelines for the Use of Animals in Visual Research of the Association for Research in Ophthalmology and Visual Science (http://www.arvo.org/animals/). Every effort was made to minimize the animals' suffering, anxiety, and discomfort.
Mice
Mice were housed in a barrier facility operated and maintained by the Division of Comparative Medicine of Washington University School of Medicine. All mice used for experiments were backcrossed to C57BL6/J mice obtained from Jackson Laboratories (Bar Harbor, ME, Stock number 000664) for at least 5 generations. Knock-IN of E168d2neo and R90Wneo were generated by the Mouse Genetics Core, Department of Ophthalmology and Visual Sciences, Washington University (Saint Louis, MO). E168d2neo and R90Wneo constructs were transfected into 129Sv/J SCC#10 (ATCC SCRC-1020) embryonic stem cells and Knock-IN was achieved by homologous recombination into the endogenous mCrx locus and selected by neomycin. The targeted ES cells were injected into C57BL6/J blastocysts to form chimeric Knock-IN E168d2neo and R90Wneo mice. Germline transmission of E168d2neo and R90Wneo was identified by PCR genotyping and Sanger sequencing of genomic DNA from F1 mice (Figure 1, Figure S1, Table S1). Crx−/− mice were provided by Dr. Constance Cepko, Harvard University (Boston, MA).
PCR genotyping
Genomic DNA was prepared from mouse tail tissue using the Gentra Puregene Tissue Kit (Qiagen). PCR amplification was performed using Jumpstart RedTaq (Sigma-Aldrich). Primer sets (Table S1) are as follows: For all mice: neo (Neo-F/R) and Crx (Total Crx-F/R); for E168d2 colony: WT Crx allele (E168d2 WT-F, E168d2-R), E168d2 allele (E168d2 Mut-F, E168d2-R); for R90W colony: WT Crx allele (R90W WT-R, R90W-R), R90W allele (R90W Mut-F, R90W-R).
Sanger sequencing of genomic DNA
Genomic DNA was prepared from mouse tail tissue using the Gentra Puregene Tissue Kit (Qiagen). mCrx DNA was amplified by PCR using the Genomic mCrx Int/Ex4-F/R primer pair (Table S1). Sanger sequencing was performed by the Protein and Nucleic Acid Chemistry Laboratory (Washington University, Saint Louis, MO) using the Sequencing primers E168 and R90W (Table S1) and Big Dye V3.1 (Advanced Biotechnologies).
Electroretinogram
At least 5 mice of each genotype were tested for ERG at 1 mo, 3 mo, or 6 mo of age. Bilateral flash ERG measurements were performed using a UTAS-E3000 Visual Electrodiagnostic System running EM for Windows (LKC Technologies, Inc., Gaithersburg, MD) and recordings from the higher amplitude eye were used for analysis. Mice were dark-adapted overnight, then anesthetized with 80 mg/kg ketamine and 15 mg/kg xylazine under dim red illumination for electrode placement and testing. Body temperature was maintained at 37±0.5°C with a heating pad controlled by a rectal temperature probe (FHC Inc., Bowdoin, ME). The mouse's head was positioned just inside the opening of the Ganzfeld dome and pupils were dilated with 1.0% atropine sulfate (Bausch & Lomb, Tampa, FL). The recording electrode was a platinum loop 2.0 mm in diameter, positioned in a drop of 1.25% hydroxypropyl methylcellulose (GONAK; Akorn Inc., Buffalo Grove, IL) on the corneal surface of each eye. The reference needle electrode was inserted under the skin at the vertex of the skull. The ground electrode was inserted under the skin of the mouse's back or tail. The stimulus (trial) consisted of a brief, full-field flash (10 µs) either in darkness, or in the presence of dim (29.2 cd/mm) background illumination after 10 minutes adaptation time to the background light. The initiation of the flash was taken as time zero. The response was recorded over 250 ms plus 25 ms of pre-trial baseline. Responses from several trials were averaged. For complete test parameters see Table S7. The log light intensity (log [cd*s/m2]) was calculated based on the manufacturer's calibrations. The mean amplitudes (in microvolts) of the averaged dark-adapted A and B-waves and light-adapted B-waves were measured and quantified for comparison. The between-group differences in peak amplitude were determined by testing genotype*flash intensity interactions (p<0.05, n≥5) at each age were compared using two-way ANOVA for repeated measurement data to account for potential correlations among readings from the same mice. If the overall genotype*flash intensity interaction was significant, post-hoc multiple comparisons for differences between each genotype and the control group at each light intensity level were performed. All the tests were two-tailed, significance: p<0.05. The statistical analysis was performed using SAS 9.3 (SAS Institutes, Cary, NC). p-values were adjusted for multiple comparisons by a permutation test using the default parameters provided in the LSMestimate statement in Proc Mixed. Average percent reductions for each wave form were calculated by normalizing the peak amplitude of the mutant to WT and results were averaged for the flashes listed in Table 1; ±STDEV.
Immunohistochemistry and microscopy
For retinal sections: eyes were enucleated by removing the cornea and lens and fixed in 4% paraformaldehyde for 24 hrs at 4°C. A small corneal tag on the superior portion of the eye was used for orientation. Eyes were embedded in paraffin and 5 µM sagittal retinal sections were cut using a Leica RM 2255 microtome as previously described [67]. Hemotoxylin and eosin immunohistochemistry was performed on sections for histology. Fluorescent antibody immunostaining was performed using as previously described using 1% BSA/0.1% Triton X in 1× PBS for blocking and antigen retrieval for all samples [13][67].
For whole flat-mounted retinas: eyes were enucleated by removing the cornea and lens and fixed in 4% paraformaldehyde for 1 hr at 4°C. Retinas were then dissected from the eye cup and 4 evenly spaced relief lines were cut (Figure 6A). A scleral tag was left on the superior retina for orientation. Retinas were mounted on poly-D lysine coated slides (Thermo Scientific), blocked with 1% BSA/0.1% Triton X in 1× PBS and immunostained as previous.
Primary antibodies and dilutions used as follows: Mouse monoclonal anti-CRX M02 (1∶200, Abova), rabbit anti-CRX 261 (1∶200), rabbit anti-cone arrestin (CARR) (1∶1000, Millipore), Rabbit anti-Opsin Red/Green (MOP) (1∶1000, Millipore), Goat anti-OPN1SW (N-20) (SOP) (1∶500, Santa Cruz), Mouse anti-Rhodopsin RET-P1 (RHO)(1∶400, Chemicon), Peanut Agglutanin conjugated to Rhodamine (PNA)(1∶500, Vector Labs). Secondary Antibodies (1∶400): Goat anti-rabbit or mouse IgG antibodies coupled to Alexa Fluor A488, Rhodamine 568 or Cy2 647 (Molecular Probes) and Chicken anti-goat IgG (Molecular Probes). All slides were counterstained with hard set DAPI (Vectashield), except when using Cy2 secondary, which were counterstained with Slow Fade Gold DAPI (Invitrogen). All brightfield and fluorescent imaging was performed using an Olympus BX51 microscope and Spot RT3 Cooled Color Digital camera (Diagnostic instruments inc.).
TUNEL analysis was performed using the Apoptag Fluorescein in situ Apoptosis Detection Kit (Millipore) per kit instructions. TUNEL+ cells were counted in retinal sagittal sections of P21 and P35 mice. Significant differences from WT control (p<0.05) were determined by the Kruskal-Wallis rank order test, which was used to protect against departures from the normal distribution assumption.
Morphometric ONL and cone analyses
For ONL morphometry, 20× retinal composites of hematoxylin and eosin (H&E) stained sagittal sections were analyzed using Image J software (http://rsb.info.nih.gov/ij/). The distance from the Optic Nerve (ON) was determined by drawing a curved line along the outer limiting membrane. The ONL thickness was measured at 100 µM, 500 µM, 1000 µM, and 1500 µM from the ON and 200 µM from the peripheral edge on both the superior and inferior retina. Results are presented by ‘spider graph’. The between-group differences in ONL thickness were determined by testing overall genotype*distance interactions (p<0.05, n≥3) at each age were tested using two-way ANOVA for repeated measurement data, followed by a post-hoc test to adjust p-value for multiple comparisons between each genotype and the WT control group at each distance using SAS 9.3 (SAS Institutes, Cary, NC), as above.
Cone nuclear localization was determined by immunostaining retinal sections with CARR. The ONL was divided into 3 equally sized zones (OONL, MONL, IONL; Figure 5A) on 20× retinal composite images using Image J software (http://rsb.info.nih.gov/ij/) and the cone nuclei within in each zone from three sections for each mouse were counted. Significant differences from WT for each zone were determined by Kruskal-Wallis rank order test (p<0.05, n≥3)
For cone density and opsin expression assessment, 10 images at 40× magnification of whole flat-mounted retinas were taken in the zones specified in Figure 6A. All peripheral images were taken ∼400 µM from the edge of the retina and the central image was taken ∼250 µM from the ON along the lateral axis. Cones were counted within a 200×200 µM square grid for each image using Image J software and the density of cones/(mm2*1000) was calculated. The between-group differences in cone density were determined by testing overall genotype*retinal region interactions (p<0.05, n≥3) at each age were tested using two-way ANOVA for repeated measurement data, followed by a post-hoc test to adjust p-value for multiple comparisons between each genotype and the WT control group in each retinal region using SAS 9.3 (SAS Institutes, Cary, NC), as above. For regional cone opsin expression analysis (Figure 6E–P), differences in the fraction of cones expressing SOP, MOP, SOP/MOP or no opsin was tested in each region using a Kruskal-Wallis rank order test (p<0.05).
Transmission electron microscopy (TEM)
For TEM studies, eyes were enucleated by removing the cornea and lens and fixed in 2% paraformaldehyde/3% gluteraldehyde in 0.1 M phosphate buffer (pH 7.35) for 24 hrs, post-fixed in 1% osmium tetroxide for 1 hr and stained en bloc with 1% uranyl acetate in 0.1 M acetate buffer for 1 hr. Blocks were then dehydrated in a graded series of acetones and embedded in Araldite 6005/EMbed 812 resin (Electron Microscopy Sciences). Semi-thin sections (0.5–1 µm) were cut through the entire retina at the level of the optic nerve and stained with toluidine blue, post-stained with uranyl acetate and lead citrate, viewed on a Hitachi H7500 electron microscope and documented in digital images. Three retinas for each genotype were sampled at P21 at 800–1200 µM from the optic nerve. ≥10 images of four key features were collected by random sampling: OS-RPE (10000×), OS-IS (12000×), ONL (5000×), OPL (10000×). Images were analyzed in a blinded manner using Image J software.
The nuclear percent area of heterochromatin was measured using Image J software in a randomized blinded analysis. For each genotype, 10 5000× images of the ONL were taken for three mouse retinas. For each image, 10 rod nuclei were randomly selected for analysis. The rod nucleus was outlined using the segmented polygon tool, electron dense regions of the nuclei associated with heterochromatin were thresholded and the percentage of the area above the threshold was measured. Thresholding was variably adjusted to accommodate for differences in brightness and contrast. The between-group differences were compared using one-way ANOVA for repeated measurement data, to account for potential correlations among photos from the same mouse. All the tests were two-tailed, significance: p<0.05 (n = 3). The statistical analysis was performed using SAS 9.3 (SAS Institutes, Cary, NC). The overall test for genotype difference was statistically significant (p = 0.02), therefore E168d2/+ and E168d2neo/+ were compared to WT (Figure S2).
Transient transfection assays
HEK293 cells (ATCC CRL-11268) were cultured on 60 mm plates in Dulbucco's minimum essential media (DMEM) with 10% fetal bovine serum and Penicillin/Streptomycin. Cells in 60% confluence were transfected with pCAGIG-NRL and pCAGIG-hCRX WT, E168d2 and R90W either alone or in combination using CaCl (0.25 M) and Boric Acid Buffered Saline (1×) pH 6.75 as previously described [13]. Cells were harvested 48 hours post transfection for either RNA (PerfectPure RNA tissue kit, 5Prime), protein (NePER nuclear and cytoplasmic extractions reagents, Thermo Scientific), or Dual-luciferase assays. Dual-luciferase assays were performed as previously described [13]. Significant differences from pcDNA3.1hisc control were determined by Kruskall-Wallis rank order test (p<0.05; n = 3). Post-hoc comparisons (Figure 10 D&E; indicated by brackets) were tested using a less conservative FDR p-value method for multiple comparisons using PROC Multtest of SAS (V9.3). FDR p<0.09 was considered marginally significant.
Western blot assays
Whole retina protein lysates were prepared by homogenization of four genotype-matched isolated whole retinas from P10 mice and lysis in 1× RIPA buffer (Sigma) for 10 min with protease inhibitors (Aprotinin, Leupeptin, peptistatin, 0.1 mM Phenylmethaneslfonyl fluoride). Nuclear lysates were prepared using NE-PER Nuclear and Cytoplasmic Extraction Reagants (Thermo Scientific) with protease inhibitors. Either 30 µg of whole protein lysate or 5 µg of nuclear protein lysate was boiled for 10 min. Samples were run on a 4–11% SDS-PAGE gel and transferred onto Transblot Turbo nitrocellulose membranes (Bio-Rad) using the Transblot Turbo system (Bio-Rad). Membranes were probed with Rabbit anti-CRX 119b1 (1∶750) and Mouse anti-β-Actin (Sigma)(1∶1000). Goat anti-Mouse IRDye 680LT and Goat anti-Rabbit IRDye 800CW (LI-COR) were used as secondary antibodies. Signal was detected and quantified using the Odyssey Infrared Imager (LI-COR) and associated manufactory software. Kruskal-Wallis rank order test (Proc Npar1way of SAS, V9.3) was used to test for an overall difference among genotypes (p = 0.0002), then each genotype was compared to WT control (p<0.05). Post-hoc analyses were performeded using FDR p methods for multiple comparisons using PROC Multtest of SAS (V9.3) (FDR p<0.09) (n≥3).
qRT-PCR
RNA was extracted from whole retinas of one male and one female mouse at either P10 or P21 for each biological replicate using the PerfectPure RNA tissue kit (5Prime). RNA was quantified using a NanoDrop ND-1000 spectrophotometer (NanoDrop Technologies, Wilmington, DE). cDNA was synthesized from 1 µg of RNA using the Transcriptor First Strand cDNA Synthesis kit (Roche Applied Science). A 10 µl QRT-PCR reaction mixture containing 1× EvaGreen with Low Rox reaction mix (BioRad), 1 µM primer mix, and diluted cDNA was prepared and run on a two-step 40 cycle amplification protocol with melt curve determination on a BioRad CFX thermocycler in triplicate. The Cq's of technical replicates were averaged and the results were analyzed using the Delta Cq method in QBase software (Biogazelle). Primer sets (Table S1) were designed using MacVector software and synthesized by IDT DNA technologies. For mCrx allele specific amplification the following primers were used: for E168d2 and E168d2neo mice: WT allele specific - Crx E168d2 WT RTF/R, total - Crx R90W WT-RTF/R; for R90W and R90Wneo mice: WT allele specific - Crx R90W WT-RTF/R, total Crx E168d2 WT RTF/R (Figure 2J), Relative gene expression was normalized to Ubb and Tuba1b. Kruskal-Wallis rank order test (Proc Npar1way of SAS, V9.3) was used to test for an overall difference among genotypes (p<0.05; n≥3). Post hoc analyses were adjusted for multiple comparisons using FDR p methods, as above (FDR p≤0.09).
Microarray
Triplicate RNA samples were prepared from 4 pooled retinas from 1 male and 1 female mouse at P10 for WT and homozygous E168d2neo, R90Wneo and −/ − mice. The RNA was fluorescent labeled and hybridized to MouseWG-6 v2.0 Expression Beadchips (Illumina) by Washington University Genome Technology Access Center (GTAC). The raw microarray datasets are available at the NCBI GRO website (http://www.ncbi.nlm.nih.gov/gds, access number: GSE51184). Microarray data were analyzed using significance analysis of microarrays (SAM) following background subtraction and quantile normalization in Illumina Genome Studio platform. Control probes and probes with detection p-value <0.05 across all samples were removed prior to any analysis. Candidate probes with 2.0-fold disregulation at false discovery rate ≤0.05 from each comparison were chosen for further analysis. Cellular processes associated with differentially expressed genes were assigned based on gene ontology provided by Mouse Genome Informatics (http://www.informatics.jax.org/).
Electrophoretic mobility shift assays (EMSA)
BAT-1 and BAT-1 mutated AB probes 5′ end-labeled with 700 IRDye were synthesized by Integrated DNA Technologies (IDT). Nuclear protein extracts from HEK293 cells (∼1×10⁸ cells) transfected with pCAGIG-hCRX, pCAGIG-hCRX E168d2, or pCAGIG-hCRX R90W were prepared following NE-PER kit instructions (Thermo Scientific). Nuclear extracts were tested for CRX expression by running on a Western Blot as above (Figure 10B). CRX levels were quantified by normalizing to β-Actin (Sigma) and a 2-fold dilution series of equivalent amounts of CRX WT, CRX[E168d2] and CRX[R90W] protein were used for binding reactions. Binding reactions were performed using the Odyssey Infrared EMSA kit (LI-COR), per kit instructions using 1 µg of nuclear protein extract and 50 nM IRDye labeled oligo. Samples were run on a native 5% polyacrylamide; 0.5× Tris/Borate/Ethylenediaminetetraacetic acid (EDTA) buffered gel and imaged on the Odyssey Infrared Imager (LI-COR).
Chromatin immunoprecipitation (ChIP) assays
ChIP was performed as previously described [7][13][68]. Basically, 6 retinas per sample were dissected and chromatin was cross-linked with 1% formaldehyde in PBS for one minute at room temperature. After cell lysis and chromatin fragmentation by sonication, chromatin fragments were immunoprecipitated with the CRX 119b-1 antibody [7] or normal rabbit IgG (Santa Cruz) bound to Protein A beads (GE Healthcare Life Sciences, Piscataway, NJ). After extensive washing, the immunoprecipitated chromatin was eluted with 50 mM NaHCO3 1% SDS, heated to 67°C to reverse the cross-links, the DNA purified by ethanol precipitation and analyzed by PCR with gene-specific primers (Table S1) (n≥3). Fold enrichment was determined by quantitative ChIP PCR. Critical threshold (Ct) values for CRX and IgG immunoprecipitation (IP) were normalized to input and mock subtracted. The fold enrichment of CRX:IgG was calculated based on the formula shown below. Significant enrichment was determined by testing overall promoter*genotype interactions by two-way ANOVA for repeated measures using SAS 9.3 (SAS Institutes, Cary, NC) (p<0.05, n = 3), as above.
ΔCt = (Ct[CRX or IgG]-Ct[Input])
ΔΔCt = ΔCt[CRX or IgG] - ΔCt[mock]
Fold enrichment = ((2−ΔΔCt CRX)/(2−ΔΔCt IgG)
Supporting Information
Zdroje
1. ChenS, WangQL, NieZ, SunH, LennonG, et al. (1997) Crx, a novel Otx-like paired-homeodomain protein, binds to and transactivates photoreceptor cell-specific genes. Neuron 19(5): 1017–30.
2. FurukawaT, MorrowEM, CepkoCL (1997) Crx, a novel otx-like homeobox gene, shows photoreceptor-specific expression and regulates photoreceptor differentiation. Cell 91 : 531–541.
3. FurukawaT, MorrowEM, LiT, DavisFC, CepkoCL (1999) Retinopathy and attenuated circadian entrainment in Crx-deficient mice. Nat Genet 23(4): 466–470.
4. ChauKY, ChenS, ZackDJ, OnoSJ (2000) Functional domains of the cone-rod homeobox (CRX) transcription factor. The Journal of biological chemistry 275(47): 37264–70.
5. KimuraA, SinghD, WawrousekE, KikuchiM, NakamuraM, et al. (2000) Both PCE-1/RX and OTX/CRX Interactions Are Necessary for Photoreceptor-specific Gene Expression. J Biol Chem 275 : 1152–1160.
6. LangmannT, LaiCCL, WeigeltK, TamBM, Warneke-WittstockR, et al. (2008) CRX controls retinal expression of the X-linked juvenile retinoschisis (RS1) gene. Nucleic acids research 36(20): 6523–34.
7. PengGH, ChenS (2007) Crx activates opsin transcription by recruiting HAT-containing co-activators and promoting histone acetylation. Hum Mol Genet 16(20): 2433–2452.
8. HennigAK, PengGH, ChenS (2008) Regulation of photoreceptor gene expression by Crx-associated transcription factor network. Brain Res 1192 : 114–133.
9. PengGH, ChenS (2011) Active opsin loci adopt intrachromosomal loops that depend on the photoreceptor transcription factor network. Proc Natl Acad Sci USA 108(43): 17821–6.
10. FeiY, HughesTE (2000) Nuclear trafficking of photoreceptor protein crx: the targeting sequence and pathologic implications. Investigative ophthalmology & visual science 41(10): 2849–56.
11. MittonKP, SwainPK, ChenS, XuS, ZackDJ, et al. (2000) The leucine zipper of NRL interacts with the CRX homeodomain. A possible mechanism of transcriptional synergy in rhodopsin regulation. J Biol Chem 275(38): 29794–9.
12. NicholsLL, AlurRP, BoobalanE, SergeevYV, CarusoRC, et al. (2010) Two novel CRX mutant proteins causing autosomal dominant Leber congenital amaurosis interact differently with NRL. Human mutation 31(6): E1472–83.
13. PengGH, AhmadO, AhmadF, LiuJ, ChenS (2005) The photoreceptor-specific nuclear receptor Nr2e3 interacts with Crx and exerts opposing effects on the transcription of rod versus cone genes. Hum Mol Genet 14 : 747–764.
14. RoduitR, EscherP, SchorderetDF (2009) Mutations in the DNA-binding domain of NR2E3 affect in vivo dimerization and interaction with CRX. PLoS ONE 4(10): e7379.
15. SanyalS, JansenHG (1981) Absence of receptor outer segments in the retina of rds mutant mice. Neurosci Lett 21 : 23–26.
16. HumphriesMH, RancourtD, FarrarGJ, KennaP, HazelM, et al. (1997) Retinopathy induced in mice by targeted disruption of the rhodopsin gene. Nature Genet 15 : 216–219.
17. MorrowEM, FurukawaT, RaviolaE, CepkoCL (2005) Synaptogenesis and outer segment formation are perturbed in the neural retina of Crx mutant mice. BMC Neurosci 6 : 5.
18. LiveseyFJ, FurukawaT, SteffenMA, ChurchGM, CepkoCL (2000) Microarray analysis of the transcriptional network controlled by the photoreceptor homeobox gene Crx. Curr Biol 10(6): 301–310.
19. HsiauTH, DiaconuC, MyersCA, LeeJ, CepkoCL, et al. (2007) The cis-regulatory logic of the mammalian photoreceptor transcriptional network. PLoS ONE 2(7): 2e643.
20. BlackshawS, FraioliRE, FurukawaT, CepkoCL (2001) Comprehensive analysis of photoreceptor gene expression and the identification of candidate retinal disease genes. Cell 107(5): 579–589.
21. CorboJC, LawrenceKA, KarlstetterM, MyersCA, AbdelazizM, et al. (2010) CRX ChIP-seq reveals the cis-regulatory architecture of mouse photoreceptors. Genome Research 20(11): 1512–1525.
22. RivoltaC, BersonEL, DryjaTP (2001) Dominant Leber congenital amaurosis, cone-rod degeneration, and retinitis pigmentosa caused by mutant versions of the transcription factor CRX. Human mutation 18(6): 488–98.
23. SohockiMM, SullivanLS, Mintz-HittnerHA, BirchD, HeckenlivelyJR, et al. (1998) A range of clinical phenotypes associated with mutations in CRX, a photoreceptor transcription-factor gene. Am J Hum Genet 63(5): 1307–1315.
24. JacobsonSG, CideciyanAV, HuangY, HannaDB, FreundCL, et al. (1998) Retinal degenerations with truncation mutations in the cone-rod homeobox (CRX) gene. Invest Ophthalmol Vis Sci 39(12): 2417–2426.
25. HaneinS, PerraultI, GerberS, TanguyG, BarbetF, et al. (2004) Leber congenital amaurosis: comprehensive survey of the genetic heterogeneity, refinement of the clinical definition, and genotype-phenotype correlations as a strategy for molecular diagnosis. Human mutation 23 : 306–317.
26. DharmarajSR, SilvaER, Pina aL, LiYY, YangJM, et al. (2000) Mutational analysis and clinical correlation in Leber congenital amaurosis. Ophthalmic genetics 21 : 135–150.
27. GalvinJA, FishmanGA, StoneEM, KoenekoopRK (2005) Evaluation of genotype-phenotype associations in Leber Congenital Amaurosis. Retina 25(7): 919–29.
28. PerraultI, HaneinS, GerberS, BarbetF, DufierJL, et al. (2003) Evidence of autosomal dominant Leber congenital amaurosis (LCA) underlain by a CRX heterozygous null allele. J Med Genet 40(7): e90.
29. NakamuraM, ItoS, MiyakeY (1998) Novel De Novo Mutation in CRX Gene in a Japanese Patient with Leber Congenital Amaurosis. American Journal of Ophthalmology 24 : 465–467.
30. ZhangQ, LiS, GuoX, GuoL, XiaoX, et al. (2001) Screening for CRX gene mutations in Chinese patients with Leber congenital amaurosis and mutational phenotype. Ophthalmic Genet 22 : 89–96.
31. LoteryAJ, NamperumalsamyP, JacobsonSG, WeleberRG, FishmanGA, et al. (2000) Mutation analysis of 3 genes in patients with Leber congenital amaurosis. Archives of ophthalmology 118(4): 538–43.
32. WangP, GuoX, ZhangQ (2007) Further evidence of autosomal-dominant Leber congenital amaurosis caused by heterozygous CRX mutation. Graefe's archive for clinical and experimental ophthalmology 245 : 1401–1402.
33. HuangL, XiaoX, LiS, JiaX, WangP, et al. (2012) CRX variants in cone-rod dystrophy and mutation overview. Biochemical and biophysical research communications 426(4): 498–503.
34. TzekovRT, LiuY, SohockiMM, ZackDJ, DaigerSP, et al. (2001) Autosomal dominant retinal degeneration and bone loss in patients with a 12-bp deletion in the CRX gene. Investigative ophthalmology & visual science 42 : 1319–1327.
35. KoenekoopRK, LoyerM, DembinskaO, BeneishR (2002) Mutation report Visual improvement in Leber congenital amaurosis and the CRX genotype. Ophthalmic Genet 23 : 49–60.
36. PaunescuK, PreisingMN, JankeB, WissingerB, LorenzB (2007) Genotype-phenotype correlation in a German family with a novel complex CRX mutation extending the open reading frame. Ophthalmology 114 : 1348–1357.e1.
37. TzekovRT, SohockiMM, DaigerSP, BirchDG (2000) Visual phenotype in patients with Arg41Gln and ala196+1 bp mutations in the CRX gene. Ophthalmic genetics 21(2): 89–99.
38. WaliaS, FishmanGA, JacobsonSG, AlemanTS, KoenekoopRK, et al. (2010) Visual acuity in patients with Leber's congenital amaurosis and early childhood-onset retinitis pigmentosa. Ophthalmology 117 : 1190–1198.
39. den HollanderAI, RoepmanR, KoenekoopRK, CremersFPM (2008) Leber congenital amaurosis: genes, proteins and disease mechanisms. Progress in retinal and eye research 27 : 391–419.
40. FreundCL, Gregory-EvansCY, FurukawaT, PapaioannouM, LooserJ, et al. (1997) Cone-rod dystrophy due to mutations in a novel photoreceptor-specific homeobox gene (CRX) essential for maintenance of the photoreceptor. Cell 91(4): 543–553.
41. FreundC, WangQL, ChenS, MuskatB, WilesC, et al. (1998) De novo mutations in the CRX homeobox gene associated with Leber congenital amaurosis. Nature genetics 18(4): 311–312.
42. SwainPK, ChenS, WangQL, AffatigatoLM, CoatsCL, et al. (1997) Mutations in the cone-rod homeobox gene are associated with the cone-rod dystrophy photoreceptor degeneration. Neuron 19(6): 1329–36.
43. BergerW, Kloeckener-GruissemB, NeidhardtJ (2010) The molecular basis of human retinal and vitreoretinal diseases. Progress in retinal and eye research 29(5): 335–75.
44. SilvaE, YangJM, LiY, DarmarajS, OhS, et al. (2000) A CRX null mutation is associated with both Leber congenital amaurosis and a normal ocular phenotype. Invest Ophthalmol Vis Sci 41 : 2076–2079.
45. SwaroopA, WangQL, WuW, CookJ, CoatsC, et al. (1999) Leber congenital amaurosis caused by a homozygous mutation (R90W) in the homeodomain of the retinal transcription factor CRX: direct evidence for the involvement of CRX in the development of photoreceptor function. Hum Mol Genet 8(2): 299–305.
46. TerrellD, XieB, WorkmanM, MahatoS, ZelhofA, et al. (2012) OTX2 and CRX rescue overlapping and photoreceptor-specific functions in the Drosophila eye. Developmental dynamics: an official publication of the American Association of Anatomists 241 : 215–228.
47. ChenS, WangQL, XuS, LiuI, LiL, et al. (2002) Functional analysis of cone-rod homeobox (CRX) mutations associated with retinal dystrophy. Hum Mol Genet 11(8): 873–884.
48. HayashiS, LewisP, PevnyL, McMahonAP (2002) Efficient gene modulation in mouse epiblast using a Sox2Cre transgenic mouse strain. Mech Dev (Suppl 1): S97–S101.
49. NishidaA, FurukawaA, KoikeC, TanoY, AizawaS, et al. (2003) Homeobox gene controls retinal photoreceptor cell fate and pineal gland development. Nature Neuroscience 6(12): 1255–1263.
50. PeacheyNS, BallSL (2003) Electrophysiological analysis of visual function in mutant mice. Documenta ophthalmologica. Advances in ophthalmology 107(1): 13–36.
51. Carter-DawsonLD, LaVailMM (1979) Rods and Cones in the Mouse Retina. Journal of Comparative Neurology 188(2): 245–262.
52. ChiquetC, Dkhissi-BenyahyaO, ChounlamountriN, SzelA, DegripWJ, et al. (2002) Characterization of calbindin-positive cones in primates. Neuroscience 115(4): 1323–33.
53. RichKA, ZhanY, BlanksJC (1997) Migration and synaptogenesis of cone photoreceptors in the developing mouse retina. The Journal of comparative neurology 388(1): 47–63.
54. MieziewskaKE, Van VeenT, MurrayJM, AguirreGD (1991) Rod and cone specific domains in the interphotoreceptor matrix. The Journal of Comparative Neurology 308(3): 371–80.
55. SzélA, RöhlichP, CafféAR, Van VeenT (1996) Distribution of cone photoreceptors in the mammalian retina. Microscopy research and technique 35(6): 445–62.
56. AppleburyML, AntochMP, BaxterLC, ChunLL, FalkJD, et al. (2000) The murine cone photoreceptor: a single cone type expresses both S and M opsins with retinal spatial patterning. Neuron 27 : 513–523.
57. FurukawaA, KoikeC, LippincottP, CepkoCL, FurukawaT (2002) The mouse Crx 5′-upstream transgene sequence directs cell-specific and developmentally regulated expression in retinal photoreceptor cells. The Journal of Neuroscience 22(5): 1640–7.
58. RobertsMR, HendricksonA, McGuireCR, RehTA (2005) Retinoid X receptor (gamma) is necessary to establish the S-opsin gradient in cone photoreceptors of the developing mouse retina. Investigative ophthalmology & visual science 46(8): 2897–904.
59. RobertsMR, SrinivasM, ForrestD, Morreale de EscobarG, RehTA (2006) Making the gradient: thyroid hormone regulates cone opsin expression in the developing mouse retina. Proc Natl Acad Sci USA 103(16): 6218–23.
60. Menotti-RaymondM, DeckmanKH, DavidVA, MyrkaloJ, O'BrienSJ, et al. (2010) Mutation discovered in a feline model of human congenital retinal blinding disease. Invest Ophthalmol Vis Sci 51(6): 2852–9.
61. CurtisR, BarnettK, LeonA (1987) An Early-Onset Retinal Dystrophy With Dominant Inheritance in the Abyssinian Cat. IOVS 28 : 131–139.
62. OmoriY, KatohK, SatoS, MuranishiY, ChayaT, et al. (2011) Analysis of transcriptional regulatory pathways of photoreceptor genes by expression profiling of the Otx2-deficient retina. PloS one 6(5): e19685.
63. KoikeC, NishidaA, UenoS, SaitoH, SanukiR, et al. (2007) Functional roles of Otx2 transcription factor in postnatal mouse retinal development. Mol Cell Biol 27(23): 8318–8329.
64. LambaDA, GustJ, RehTA (2009) Transplantation of human embryonic stem cell-derived photoreceptors restores some visual function in Crx-deficient mice. Cell stem cell 4(1): 73–9.
65. ChaddertonN, Millington-WardS, PalfiA, O'ReillyM, TuohyG, et al. (2009) Improved retinal function in a mouse model of dominant retinitis pigmentosa following AAV-delivered gene therapy. Molecular therapy: the journal of the American Society of Gene Therapy 17(4): 593–9.
66. O'ReillyM, PalfiA, ChaddertonN, Millington-WardS, AderM, et al. (2007) RNA interference-mediated suppression and replacement of human rhodopsin in vivo. American journal of human genetics 81(1): 127–35.
67. WangX, XuS, RivoltaC, LiLY, PengGH, et al. (2002) Barrier to autointegration factor interacts with the cone-rod homeobox and represses its transactivation function. The Journal of Biological Chemistry 277(45): 43288–300.
68. ChenS, PengGH, WangX, SmithAC, GroteSK, et al. (2004) Interference of Crx-dependent transcription by ataxin-7 involves interaction between the glutamine regions and requires the ataxin-7 carboxy-terminal region for nuclear localization. Hum Molec Genet 13 : 53–67.
Štítky
Genetika Reprodukční medicínaČlánek vyšel v časopise
PLOS Genetics
2014 Číslo 2
Nejčtenější v tomto čísle
- Genome-Wide Association Study of Metabolic Traits Reveals Novel Gene-Metabolite-Disease Links
- A Cohesin-Independent Role for NIPBL at Promoters Provides Insights in CdLS
- Classic Selective Sweeps Revealed by Massive Sequencing in Cattle
- Arf4 Is Required for Mammalian Development but Dispensable for Ciliary Assembly