
Background Selection as Baseline for Nucleotide Variation across the Genome
The removal of deleterious mutations from natural populations has potential consequences on patterns of variation across genomes. Population genetic analyses, however, often assume that such effects are negligible across recombining regions of species like Drosophila. We use simple models of purifying selection and current knowledge of recombination rates and gene distribution across the genome to obtain a baseline of variation predicted by the constant input and removal of deleterious mutations. We find that purifying selection alone can explain a major fraction of the observed variance in nucleotide diversity across the genome. The use of a baseline of variation predicted by linkage to deleterious mutations as null expectation exposes genomic regions under other selective regimes, including more regions showing the signature of balancing selection than would be evident when using traditional approaches. Our study also indicates that most, if not all, nucleotides across the D. melanogaster genome are significantly influenced by the removal of deleterious mutations, even when located in the middle of highly recombining regions and distant from genes. Additionally, the study of rates of protein evolution confirms previous analyses suggesting that the recombination landscape across the genome has changed in the recent history of D. melanogaster. All these reported factors can skew current analyses designed to capture demographic events or estimate the strength and frequency of adaptive mutations, and illustrate the need for new and more realistic theoretical and modeling approaches to study naturally occurring genetic variation.
Published in the journal:
. PLoS Genet 10(6): e32767. doi:10.1371/journal.pgen.1004434
Category:
Research Article
doi:
https://doi.org/10.1371/journal.pgen.1004434
Summary
The removal of deleterious mutations from natural populations has potential consequences on patterns of variation across genomes. Population genetic analyses, however, often assume that such effects are negligible across recombining regions of species like Drosophila. We use simple models of purifying selection and current knowledge of recombination rates and gene distribution across the genome to obtain a baseline of variation predicted by the constant input and removal of deleterious mutations. We find that purifying selection alone can explain a major fraction of the observed variance in nucleotide diversity across the genome. The use of a baseline of variation predicted by linkage to deleterious mutations as null expectation exposes genomic regions under other selective regimes, including more regions showing the signature of balancing selection than would be evident when using traditional approaches. Our study also indicates that most, if not all, nucleotides across the D. melanogaster genome are significantly influenced by the removal of deleterious mutations, even when located in the middle of highly recombining regions and distant from genes. Additionally, the study of rates of protein evolution confirms previous analyses suggesting that the recombination landscape across the genome has changed in the recent history of D. melanogaster. All these reported factors can skew current analyses designed to capture demographic events or estimate the strength and frequency of adaptive mutations, and illustrate the need for new and more realistic theoretical and modeling approaches to study naturally occurring genetic variation.
Introduction
The causes of the variation observed within natural populations have been a long-standing question in evolutionary and genetic studies. Particular insight into these causes can be gained by analyzing the distribution of nucleotide diversity across genomes, where species - and population-specific parameters such as the number of individuals, environmental factors, or demography are constant. A number of population genetics models have been put forward to explain this intra-genomic variation in diversity, often including the predicted consequences that selection acting at a genomic site impinges on genetically linked sites, either neutral or under selection themselves (i.e., models of ‘selection at linked sites’; [1]–[4] and references therein). Although there is general agreement that selection at linked sites can play a role shaping levels of variation, there is still intense debate and research on the selective nature of the mutations causing such effects (e.g., beneficial or deleterious) and whether the same causes can be applied to different species [4]–[6].
Strongly beneficial mutations rise rapidly to fixation and hitchhike adjacent sites, causing a fingerprint of reduced intra-specific variation around the selected site known as a ‘selective sweep’ (the HHss model; [2], [3], [7]–[11]). A qualitatively similar outcome can be generated by another model of selection and hitchhiking effects at genetically linked sites without requiring adaptive changes, just as a result of the continuous input of strongly deleterious mutations and their removal by natural selection (the background selection (BGS) model [1], [4], [12]–[16]). Both models also predict that the consequences of selection removing adjacent diversity diminish when genetic recombination increases, a general pattern that has been observed in many species when comparing genomic regions with high and low (or zero) recombination rates (reviewed in [1], [3]–[5]).
The magnitude and distribution of recombination rates across genomes play key roles in predicting the consequences of selection on adjacent variation. In humans, for instance, the presence of large recombination cold spots raised the possibility that BGS could reduce polymorphism levels at specific genomic regions. In agreement, recent analyses using models of purifying selection rather than purely neutral ones suggest that patterns of nucleotide diversity across the human genome are consistent with BGS predictions [17]–[21]. In the model system D. melanogaster, low-resolution recombination maps described limited or absent recombination near sub-telomeric and –centromeric regions whereas recombination outside these sub-telomeric and –centromeric regions (i.e., across trimmed chromosome arms) has been often assumed to be both high and homogeneously distributed. As a consequence, variation in nucleotide diversity across trimmed chromosome arms has been mostly attributed to positive selection and selective sweeps ([4], [5], [22]–[29]; but see [30]).
There are, however, several reasons to believe that BGS effects could be significant in D. melanogaster as well. First, compared with humans, D. melanogaster has a more compact genome and a larger effective population size (Ne), predicting tighter genetic linkage between genes and stronger purifying selection, respectively, and both factors forecast greater BGS effects. Second, recent whole-genome studies of recombination rates in D. melanogaster exposed extensive heterogeneity in the distribution of crossover rates even after removing sub-telomeric and centromeric regions [31]. This high degree of variation in recombination rates across D. melanogaster chromosomes is observed when recombination is obtained from a single cross of two specific strains [31], [32] as well as when analyzing a species' average obtained from combining genetic maps from crosses of several natural strains [31]. The presence of coldspots of recombination embedded in chromosomal regions assumed to have high recombination rates, therefore, provides the opportunity for BGS to play a more significant role across broader genomic regions than previously anticipated [31]. Finally, Charlesworth [33] has recently showed that BGS effects are predicted to be detectable in the middle of recombining chromosome arms in D. melanogaster.
The consequences of BGS at a given nucleotide position in the genome (focal point) can be described by the predicted level of neutral nucleotide diversity when selection at linked sites is allowed (π) relative to the level of diversity under complete neutrality and free recombination between sites (π0), with B = π/π0 [12]–[15]. Therefore, B∼1 would indicate negligible BGS effects whereas B<<1 would suggest very strong BGS and a substantial reduction in levels of neutral diversity. B can also be understood in terms of a reduction in Ne, and variation in B forecasts differences in levels of diversity within species but also differences in the efficacy of selection, which can be approximated by the product of Ne and the selection coefficient s. Note, however, that the prediction about reduced efficacy of selection is a qualitative one since there is no simple scalar transformation of Ne influenced by selection at linked sites that allows estimating probabilities of fixation of selected mutations [34], [35]. Thus, a comprehensive study of the predictive power of BGS to explain natural variation across genomes needs to show that, 1) conditions exists across a genome to generate significant overall effects reducing B, 2) B varies across the genome, and 3) regions with reduced B are associated with reduced levels of polymorphism and efficacy of selection (e.g., detectable on rates of protein evolution).
Here, we investigated what is the fraction of the D. melanogaster genome that is influenced by BGS and how much of the observed variance in patterns of intra-specific variation and rates of evolution across this genome can be explained by BGS alone. Importantly, to obtain a sensible BGS baseline that could be used to test for positive selection and other departures from neutrality, we investigated BGS models that are purposely simple and independent of nucleotide variation data. Additionally, we studied whether our conclusions are sensitive to parameters of the BGS model. To this end, we expanded approaches previously applied to investigate human diversity [17], [18] to now estimate BGS effects across the D. melanogaster genome.
In all, we generated a detailed description of the consequences of purifying selection on linked sites at every 1 kb along D. melanogaster chromosomes under a variety of BGS models. Our results show that BGS likely plays a detectable role across the entire genome and that purifying selection alone can explain a very large fraction of the observed patterns of nucleotide diversity in this species. Notably, we show that these conclusions are robust to different parameters in the BGS models. The use of a BGS baseline also uncovers the presence of regions with the signature of a recent selective sweep and, less expected, numerous instances of balancing selection. Furthermore, analyses of rates of protein evolution suggest that the recombination landscape has changed recently along the D. melanogaster lineage thus generating disparity between short - and long-term Ne at many genomic positions. We discuss the advantages of incorporating BGS predictions across chromosomes and the potential consequences of temporal variation in recombination landscapes when estimating demographic and selective events.
Results
BGS models
BGS expectations (i.e., estimates of B) were obtained for every 1-kb region across the whole genome as the cumulative effects caused by deleterious mutations at any other site along the same chromosome (see Materials and Methods for details). These estimates of B were based on BGS models that include our current knowledge of genome annotation at every nucleotide site of the genome and high-resolution recombination landscapes in D. melanogaster that distinguish between crossover and gene conversion rates [31]. These models also incorporate the possibility that strongly deleterious mutations occur at sites that alter amino acid composition as well as at a fraction of sites in noncoding sequences. The inclusion of deleterious mutations in noncoding sequences allows taking into account the existence of regulatory and other non-translated functional sequences, either in introns and 5′ - and 3′-flanking UTRs, or in intergenic regions [22], [33], [36]–[38]. For each category of selected sites (nonsynonymous, intronic, UTR, or intergenic) we used the proportion of constrained sites (cs) estimated for D. melanogaster [22], [37], [38] as the fraction of sites with deleterious fitness consequences when mutated [33]. In terms of recombination rates, we studied BGS predictions following the standard approach of including crossover as the sole source of recombination (hereafter models MCO) and also when combining the effects of crossover and gene conversion events (models MCO+GC) to better quantify the true degree of linkage between sites in natural populations.
The distribution of deleterious fitness effects (DDFE) and the diploid rate of deleterious mutations per generation (U) are parameters that have direct implications on estimates of B but are more difficult to establish experimentally. Although a gamma distribution has been proposed a number of times for deleterious mutations [39]–[44], a log-normal DDFE allows capturing the existence of lethal mutations and fits better D. melanogaster polymorphism data [45], [46]. Additionally, a log-normal DDFE predicts a higher fraction of mutations with minimal consequences removing linked variation than a gamma DDFE and, ultimately, weaker BGS effects (see Materials and Methods). Therefore, the use of a log-normal DDFE can be taken as a conservative approach when inferring the magnitude of BGS effects.
Direct estimations of deleterious mutation rates are still fairly limited. In D. melanogaster, initial analyses of mutation accumulation lines estimated a mutation rate for point mutations and small indels (u) of ∼8.4×10⁻⁹/bp/generation and a diploid rate of deleterious mutations per generation (U) of ∼1.2 [47]. Nevertheless, one of the lines used in this study had an unusually high mutation rate [48] and more recent studies suggest u∼4–5×10⁻⁹ (U∼0.6) for point mutations and small indels [48]–[50]. These lower estimates, however, do not include the possible presence in natural populations of genotypes with high mutation rates or the deleterious consequences of transposable element (TE) insertions. In fact, TEs are very abundant in natural populations of D. melanogaster [51]–[60] and have been proposed to be an important source of BGS in this species [30]. Therefore, U∼0.6 represents a lower boundary for the deleterious mutation rate when inferring the consequences of BGS. To include the consequences of TE insertion in our BGS models, we obtained an approximate diploid insertion rate of UTE≥0.6 based on a detailed description of TE distribution in D. melanogaster [60] and mutation-selection balance predictions (see Materials and Methods for details). Thus, a genome-wide diploid deleterious mutation rate of ∼1.2 per generation is a reasonable approximation that captures the consequences of point mutations, small indels and the insertion of transposable elements.
To assess how robust our results and conclusions are to the parameters of the BGS model, we obtained genome-wide landscapes for B under eight different models, with DDFE following a log-normal or a gamma distribution (models MLN and MG, respectively), with deleterious mutations rates that include or not TE insertions (models MStdMut and MLowMut, respectively), and with recombination taking into account crossover and gene conversion events or only crossovers (models MCO+GC and MCO, respectively). Unless specifically noted, we report results based on the BGS model that is most consistent with our current knowledge of gene distribution across the genome, a log-normal DDFE, a genome-wide diploid deleterious mutation rate of U = 1.2, and recombination rates that include crossover and gene conversion events (i.e., our default model is MLN,StdMut,CO+GC). Table S1 summarizes the results from the BGS models and Table S2 provides the full distribution of B estimates across all chromosomes.
Patterns of BGS across the D. melanogaster genome
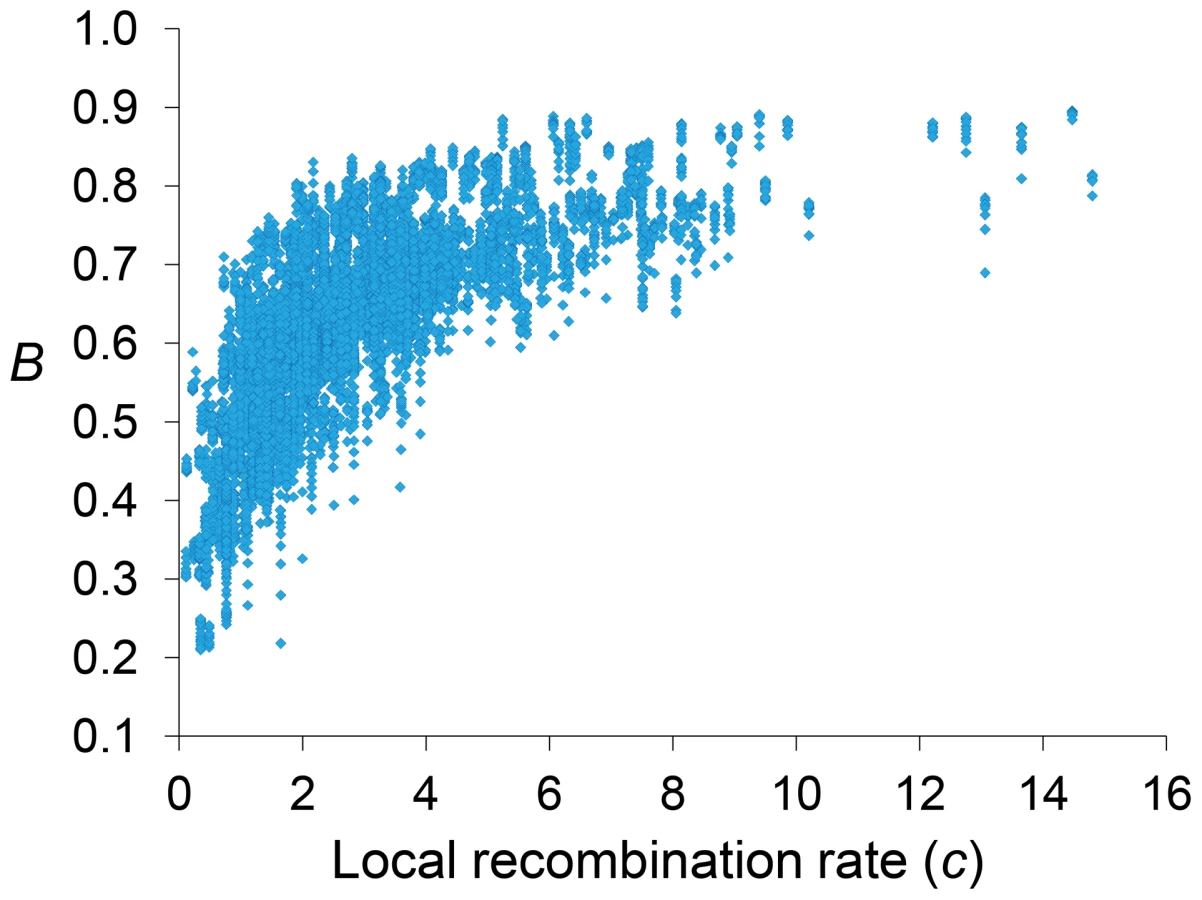
Genome-wide estimates of B show a median of 0.591 and indicate that the predicted influence of BGS across the D. melanogaster genome would reduce the overall Ne substantially relative to levels predicted by evolutionary models with free recombination (see Figure 1A). The study of the distribution of B along chromosomes shows that the reduction in neutral diversity is severe in a large fraction of the genome, with 19% of all 1-kb regions with B<0.25 and a lower 90% CI for B of 0.005 (Figure 1B and Figure 2). Importantly, the distribution of B across trimmed chromosomes is also highly heterogeneous. As expected, estimates of B are strongly influenced by variation in local crossover rates (c), with a Spearman's rank correlation coefficients (ρ) between B and c of 0.792 for trimmed chromosomes. As shown in Figure 3, however, there is detectable variance in B for a given local c that exposes the additional effects of long-range distribution of recombination rates and genes when estimating B at a focal point.


Median B across trimmed chromosome arms is 0.643, with a minimum estimate of 0.19. Significant and variable BGS effects are, therefore, expected in D. melanogaster not only due to sub-telomeric and -centromeric regions but also across trimmed chromosomes (see also [33]). This general conclusion does not vary qualitatively when considering BGS models with other parameters (Table S1). As expected, a model with a DDFE following a gamma distribution (MG) predicts stronger BGS effects and lower estimates of B across the genome than when the DDFE follows a log-normal (as in our default model). Under model MG,CO+GC the median B is 0.428 and the lower 90% CI for B is 0.001 (median B across trimmed chromosomes is 0.493, with a minimum estimate of 0.007). Also anticipated, models with a lower deleterious mutation rate (models MLowMut) generate higher estimates of B than when TE insertions are taken into account (models MStdMut). For instance, median B increases from 0.591(MLN,StdMut,CO+GC) to 0.769 (MLN,LowMut,CO+GC), and from 0.428 (MG,StdMut,CO+GC) to 0.654 (MG,LowMut,CO+GC). In addition, the comparison of predictions under models with and without gene conversion shows that the standard approach of considering crossover as the only source of recombination between sites would overestimate linkage effects. Median estimates of B are 20 and 21% lower for models MLN,CO and MG,CO than for MLN,CO+GC and MG,CO+GC, respectively. The use of only crossover rates in BGS models skews estimates of B particularly in regions with intermediate rates (∼0.2–2 cM/Mb), mostly across trimmed chromosomes. Both crossover and gene conversion data, therefore, need to be considered to obtain accurate estimates of the consequences of selection on linked sites and, in this case, the magnitude of BGS effects.
Finally, it is worth noting that although the different BGS models predict different point estimates and ranges of B across the chromosomes, all models generate B estimates across the genome that have virtually the same relative ranking (i.e., monotonically related; Table S3). Pairwise Spearman's ρ between estimates of B from different BGS models range between ρ = 0.9856 (comparing the two most distinct models MLN,StdMut,CO and MG,LowMut,CO+GC) and ρ>0.9999 (for the four comparisons between models differing in the deleterious mutation rate).
No BGS-free regions in the D. melanogaster genome
The upper end of the distribution of B across the genome is also informative and relevant for population genetic analyses of selection and demography that benefit from using regions evolving not only under neutrality but also free of linkage effects. The upper 90% CI for B is 0.80 across the whole genome and 0.814 across the trimmed genome (Figures 1 and 2 and Table S1). Out of 119,027 1-kb regions investigated across the genome, the highest B is 0.897 and is located in a genomic region with very low density of genes and high crossover rate: position 5.027 Mb of the X chromosome, in the middle of a large 50-kb region with a single and short CDS and a crossover rate of c ∼14 cM/Mb. The 1-kb autosomal region with the least BGS effects shows B = 0.822. BGS, therefore, plays a significant role across the entire genome, including long introns and intergenic sequences distant from genes in the middle of regions with high recombination rates. This conclusion is unlikely to be influenced by the parameters of the BGS model. As indicated, MG models predict stronger BGS effects and lower B and, accordingly, we observe an upper 90% CI for B of 0.707 and a maximum estimate of 0.87. On the other hand, models with lower deleterious mutation rates generate higher B, but even these models predict detectable BGS across the whole genome. MLowMut models generate upper 90% CIs for B ranging between 0.811(MG,LowMut,CO) and 0.895(MLN,LowMut,CO+GC), and the highest 1-kb estimate of B obtained by any of our MLowMut models is 0.947 (see Table S1 and Figure S1). That is, these results strongly suggest that while there may be a fraction of sites free of selective constraints across the D. melanogaster genome, all sites might be, nonetheless, under the influence of selection at linked sites and BGS in particular.
Autosomes show stronger BGS effects than the X chromosome
The X chromosome in D. melanogaster recombines at a higher rate than autosomes, caused by a higher median crossover rate per female meiosis (2.48 vs. 1.74 cM/Mb for X and autosomes, respectively), and the fact that the X chromosome spends less time than autosomes in males (that do not recombine during meiosis). This higher recombination, in turn, forecasts weaker BGS in the X [30], [61]. In agreement, Charlesworth [33] predicted weaker BGS effects (higher B) in the middle of the X chromosome than in the middle of an autosome under a number of models. Our study shows the same trend (see Figure 1A and Table S1), with median B of 0.559 and 0.736 for autosomes and the X chromosome, respectively (0.619 and 0.761 for trimmed autosomes and the X chromosome, respectively). The direct comparison of all 1-kb regions reveals that this higher B in the X chromosome relative to autosomes is highly significant (Mann-Whitney U Test, P<1×10⁻¹² for complete and trimmed chromosomes), with all BGS models generating the same trend and level of significance.
The ratio of neutral diversity for the X and autosomes (X/A) predicted by our default BGS model is 0.99 and 0.92 for complete and trimmed chromosomes, respectively. Therefore, differences in BGS effects at the X and autosomes can, at least in part, explain the observation that the X/A ratio of neutral diversity in several D. melanogaster populations is higher than the 0.75 predicted by most neutral models and a 1∶1 sex ratio (see [33]). Note that X/A ratios would be overestimated if gene conversion events were not taken into account, with X/A ratios of 1.12 and 0.99 for complete and trimmed chromosomes, respectively.
The genomic units of BGS in D. melanogaster
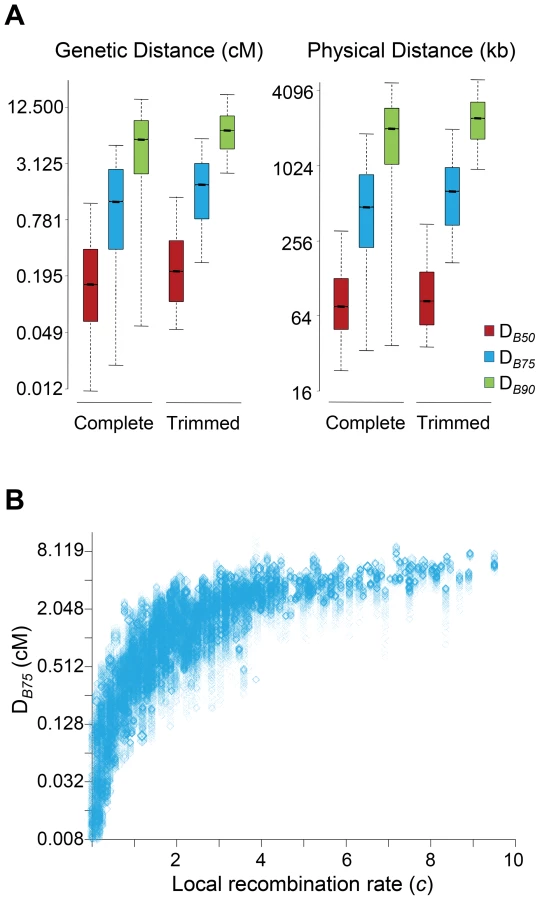
In this study, all sites along a chromosome were allowed to potentially play a role adding up BGS effects at any focal region of the same chromosome. To investigate the size of the genomic region causing detectable BGS effects in D. melanogaster, we estimated the size of the region surrounding a focal 1-kb needed to generate 90% of the total BGS effect obtained when considering the complete chromosome (DB90 in either genetic or physical units). Equivalently, we also obtained DB75 and DB50 as the size of the genomic region needed to generate 75 and 50%, respectively, of the total BGS effect obtained when considering the whole chromosome.
The study of complete chromosomes shows a median genetic DB90, DB75 and DB50 of 5.5, 1.2 and 0.15 cM, respectively. In terms of physical distance, the median DB90, DB75 and DB50 is 2024, 477 and 76 kb, respectively (Figure 4A). Although the overall effects of BGS are reduced along trimmed chromosomes compared to whole chromosomes, the size of the region playing a significant role in the final magnitude of B at a focal point is fairly equivalent, with 6.9, 1.8 and 0.21 cM for DB90, DB75 and DB50, respectively (2,412, 640 and 84 kb for DB90, DB75 and DB50, respectively). This genetic and physical scale, moreover, increases with crossover rates (Figure 4B). This analysis, therefore, suggests that the extent of BGS at most genes and intergenic sites across the D. melanogaster genome is influenced by the cumulative effects of many sites and include numerous other genes. Thus, accurate estimates of B in D. melanogaster require the study of genomic regions at the cM or Mb scale, ideally full chromosomes. Otherwise, BGS can be severely underestimated, and inferences about demographic events or other types of selection may be unwarranted. These results are also in agreement with the previous observation that all intergenic sequences and introns across the genome are predicted to be influenced by BGS.
Estimates of B are a very strong predictor of nucleotide diversity across the whole D. melanogaster genome
A second goal of this study was to estimate how much of the observed levels of neutral diversity across the D. melanogaster genome can be explained by a BGS landscape obtained independently from variation data. A strong positive correlation would not only indicate that BGS should not be ignored in population genetic analyses but also that our estimates of B are likely suitable as baseline to infer additional types of selection and/or demographic events. Because our best experimentally-obtained whole-genome recombination maps for crossover and gene conversion have a maximum resolution and accuracy at the scale of 100-kb [31], the predictive nature of the B baseline was first investigated at this physical scale.
To obtain levels of neutral diversity across the D. melanogaster genome, nucleotide diversity per bp (πsil) at introns and intergenic sequences was estimated from a sub-Saharan African population (Rwanda RG population [62]; see Materials and Methods for details). The comparison of estimates of B generated by our BGS models and levels of πsil across the genome reveals a strikingly positive association (Table 1 and Figure 5). For autosomes, the correlation between B and πsil is ρ = 0.770 (965 non-overlapping 100-kb regions, P<1×10⁻¹²), and increases up to ρ = 0.836 (P<1×10⁻¹²) along individual autosome arms. Equivalent results are obtained when silent diversity is analyzed separately at intergenic and intronic sites, with ρ = 0.736 between B and πintergenic, and ρ = 0.741 between B and πintron (P<1×10⁻¹² in both cases). The study of individual autosome arms shows a positive association up to ρ = 0.799 and 0.800 for intergenic and intronic sites, respectively (P<1×10⁻¹² in both cases).
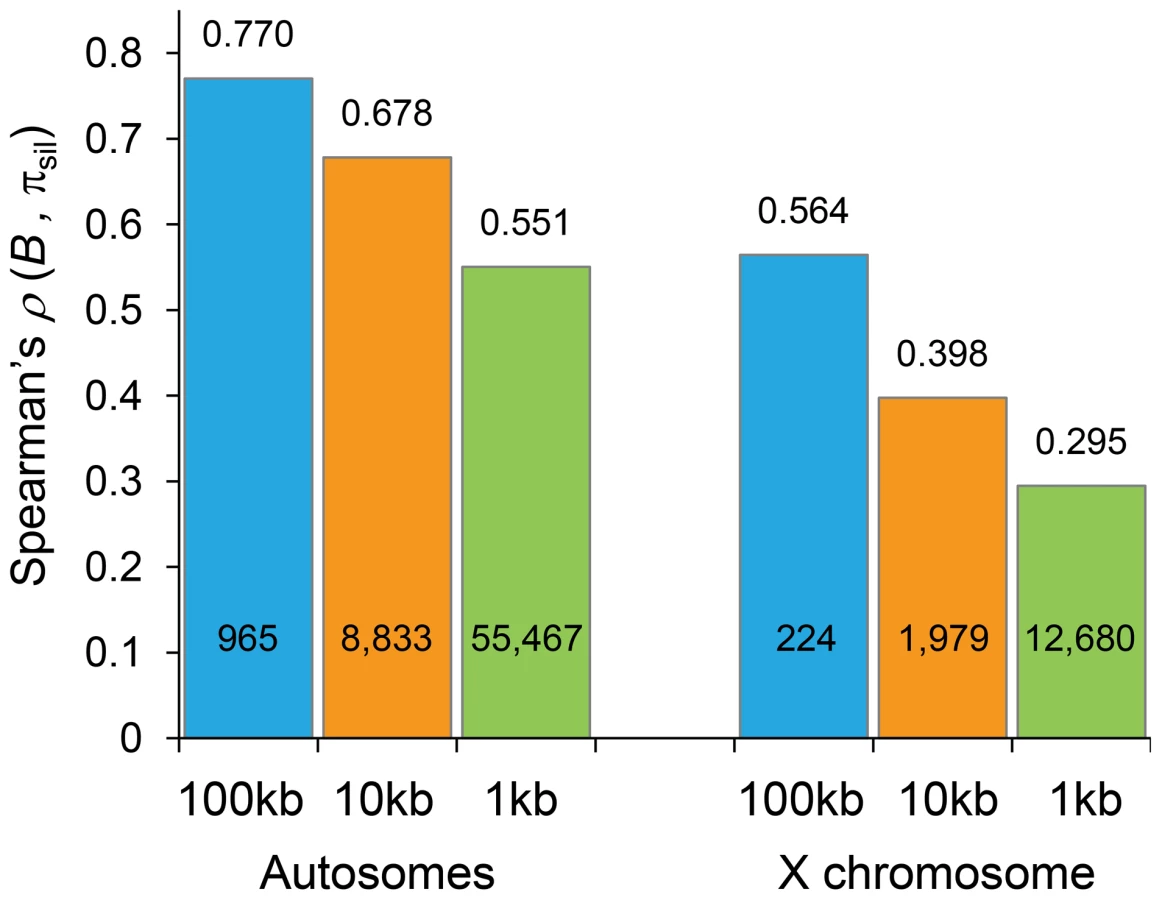

The predictive nature of the B landscape in D. melanogaster remains remarkably high along trimmed autosomes where BGS has been often assumed to play a minor role explaining variation in levels of polymorphism. The correlation between B and πsil is ρ = 0.529, ranging up to ρ = 0.655 when trimmed chromosome arms are analyzed separately (P<1×10⁻¹² in all cases). Additionally, the BGS models investigated generate a stronger association between B and πsil than between estimates of local crossover (c) and πsil, particularly along trimmed chromosomes (ρ = 0.677 and ρ = 0.397 for complete and trimmed autosomes, respectively). This last result exposes the limitations of using local c as an estimate of the overall strength of linked selection at a given genomic position, and highlights the importance of including long-range information of recombination rates and gene structures. Altogether, these results show the high predictive value of simple BGS models, with almost 60% of the observed variance in πsil across 100-kb autosomal regions explained by BGS, a percentage that is as high as ∼70% when investigating variation in nucleotide diversity along individual chromosome arms (see Table 1).
Robustness to different BGS parameters
The results presented above suggest that BGS could explain a very large fraction of the observed variation in diversity across the genome under the model that fits better our current selection and mutation data in D. melanogaster (model MLN,StdMut). Importantly, BGS models using different DDFEs (MG instead of MLN) and/or a lower deleterious mutation rate (MLowMut instead of MStdMut) generate equivalent results. Table 1 shows ρ between B and πsil for the different BGS models investigated: ρ between B and πsil ranges between 0.749 and 0.773 for complete autosomes, and between 0.514 and 0.531 for trimmed autosomes (P<1×10⁻¹² in all cases). The study of intergenic and intronic sites separately generates similar outcomes, with ρ between B and πintergenic ranging between 0.736 and 0.739, and ρ between B and πintron ranging between 0.741 and 0.744 for the different models (P<1×10⁻¹² in all cases). The similarity of outcomes should not be surprising based on the very high pairwise rank correlations between estimates of B generated by the different BGS models described above (Table S3). Taken together, these results emphasize the robustness of the approach to generate genome-wide baselines of B to study variation in nucleotide diversity along chromosomes.
The X chromosome
Langley et al. (2012) [26] recently showed that the correlation between crossover rates and levels of polymorphism is weaker along the X chromosome than in autosomes. In agreement, we also observe that the association between B and πsil along the X chromosome is weaker than in autosomes, although it is still highly significant. Estimates of ρ between B and πsil range between 0.564 and 0.568 for the different BGS models (P<1×10⁻¹² in all cases), and between 0.366 (P = 4×10⁻⁷) and 0.373 (P = 2×10⁻⁷) for the trimmed X chromosome. Moreover, πsil shows a weaker correlation with crossover rates than with B also along the X: ρ between πsil and c is 0.526 (P<1×10⁻¹²) and 0.322 (P = 9.1×10⁻⁶) for the complete and trimmed X chromosome, respectively. These results are consistent with BGS playing a weaker role along the X chromosome due to higher recombination rates (see above and [26], [30], [33], [61]). As discussed below, however, additional causes might be influencing X-linked extant variation, and include higher effectiveness of selection relative to autosomes.
Candidate regions for recent selective sweeps or balancing selection using BGS predictions as baseline
The robustness and high predictive power of the BGS models to explain qualitative trends of nucleotide diversity across the genome, suggest that we can investigate the presence of other forms of selection by searching for regions that depart from BGS expectations. We, therefore, compared observed πsil and levels of diversity predicted by B, and parameterized departures by using studentized residuals (πsil-R; see Material and Methods). Overall, the distribution of πsil-R does not show a significant departure from normality (χ2 = 28.9, d.f. = 23, P = 0.183) thus validating the approach. Nevertheless, there are 58 outlier regions with nominal P<0.05, 24 regions with significantly negative πsil-R (revealing a deficit in πsil relative to BGS expectations) and 34 regions with significantly high πsil-R (revealing a relative excess of πsil).
Regions with a relative deficit of πsil are candidate regions for recent adaptive events [2], [8], [63] and our data confirms the presence of several regions with the fingerprints of a recent selective sweep across the D. melanogaster genome [22], [23], [25], [26], [29]. The strongest signal of selection at this 100-kb scale, and the only region that shows a departure that remains significant after correction for multiple tests [P<1.6×10⁻⁶, with false discovery rate (FDR) q-value<0.10], suggests a recent selective sweep at position 8.0–8.1 Mb along chromosome arm 2R. This genomic region includes gene Cyp6g1 and also showed the strongest signal of directional selection and selective sweep in large-scale population genetic analyses of North American [26] and Australian D. melanogaster [64] populations. Not all regions with a severe reduction in πsil across the trimmed genome, however, may need recent adaptive explanations. A number of regions with πsil much smaller than the median (e.g., 0.002 relative to a median of 0.008; see Figure 6A) also show estimates of B of 0.25 or smaller and, thus, the observed πsil would be close to the predicted level of neutral diversity when a BGS context is taken into account.

Uncovering the signature of balancing selection
Numerous regions show an excess of πsil relative to the BGS baseline and are, therefore, candidates for containing sequences experiencing balancing selection. Importantly, many of the regions showing significantly higher πsil-R would not stand out unless when compared to region-specific BGS predictions. At this scale, for instance, the second strongest departure from BGS expectations is located at position 18.4–18.5 Mb along chromosome arm 3L (P = 1×10⁻⁴), with a πsil of 0.0093 that would not be noticeably high using the standard approach of comparing it to genome-wide expectations (Figure 6A). Another candidate region under balancing selection is located in cytological location 38A, showing a level of diversity also close to the average along autosomes but almost three-fold higher than the level predicted by B (P = 0.002). This candidate genomic region with a relative excess of πsil is within a QTL detected for variation in life span and proposed to be maintained by balancing selection in D. melanogaster [65]–[67]. Certainly, the detection of many regions with a relative excess of πsil based on BGS expectations opens the possibility that molecular signatures of balancing selection may have been masked by BGS effects when compared to purely neutral expectations without linkage effects, and thus be more prevalent than currently appreciated.
Analyses of BGS effects and outliers of diversity at 10-kb and 1-kb scales
Because the genome-wide recombination maps used in this study were generated to have good accuracy at the scale of 100-kb, our BGS models assumed homogeneous rates within each 100-kb region. Notably, these models predict variation in B across 100-kb regions due to the heterogeneous location of genes and exons within these regions and the differential effects of proximal and distal flanking regions. Nevertheless, detailed analyses of a few small genomic regions have revealed recombination rate variation at a smaller scale in Drosophila [32], [68]. Therefore, outliers from BGS expectations at scales smaller than 100-kb can reveal the localized fingerprints of other types of selection (directional or balancing selection) but the possibility of uncharacterized heterogeneity in recombination within these regions cannot be formally ruled out. That said, the study of the relevant size of the genomic region adding up BGS effects at a given focal point (with DB75>200 kb; see above) suggests that very local recombination variation may play a limited role influencing B at a focal point. With these caveats and considerations in mind, we investigated the presence of outliers at the scale of 10 and 1-kb to identify candidate regions under positive or balancing selection using the approach discussed for 100-kb regions.
The strong relationship between B and the observed level of silent diversity is maintained when analyzing smaller regions (Figure 5). At 10-kb scale, B remains a very good predictor of πsil along complete autosomes (ρ = 0.678, 8,883 regions; Figure 6B) whereas ρ is 0.551 (55,467 regions) at the finest scale of 1-kb (P<1×10⁻¹² in both cases). The use of BGS models with different parameters (MG,StdMut, MG,LowMut or MLN,LowMut) generate virtually equivalent results, with ρ between estimates of B and πsil ranging between 0.678 and 0.682 for analyses at the 10-kb scale, and with ρ ranging between and 0.551 and 0.554 for analyses at the 1-kb scale. As observed before, B along the X chromosome shows reduced association with πsil than for autosomes also at 10 - and 1-kb resolution. For X-linked regions, the correlation between B and πsil is ρ = 0.397 (1,979 regions) and 0.295 (12,680 regions) for 10 - and 1-kb regions, respectively (P<1×10⁻¹² in both cases).
Outliers at 10-kb scale
Among the 10,812 regions under analysis, 208 depart from expectations with nominal P<0.01, 20 showing a relative deficit of πsil and 188 with a relative excess of πsil. Nine of these regions remain significant after correction for multiple tests (FDR q-value<0.10), and all of them show an excess of πsil (Figure 6B). Among the candidate regions for a recent selective sweep (relative deficit of πsil), we detect 3 genomic regions with clusters of several 10-kb regions with nominal P<0.01. In agreement with the analyses at 100-kb scale, 10 consecutive 10-kb regions show significant deficit of variation, near gene Cyp6g1 (see above and [26], [64]). A second cluster of six 10-kb regions with reduced variation within a 120-kb interval is detected in chromosome arm 2R, with a peak signal centered at gene Dll (Distal-less), a transcription factor that plays a role in larval and adult appendage development. A third region with two adjacent 10-kb regions showing a relative deficit of πsil is located in the X chromosome, centered at gene CG32783 (a protein-encoding gene with no known orthologs outside the melanogaster subgroup).
On the other hand, we detect many 10-kb regions that show a relative excess of diversity and are candidate regions for balancing selection. The strongest signal associated with excess of πsil based on 100-kb regions now shows significantly higher variation at four adjacent 10-kb regions (19.360–19.400 Mb along chromosome arm 2L). Other strong candidate regions under balancing selection detected at this fine scale (all with FDR q-value<0.10) include the genes PH4αNE2 (oxidation-reduction process), dpr20 (sensory perception of chemical stimulus), Dhc16F (regulation of transcription and microtubule-based movement) and Gαi. Note that gene PH4αNE2 was also shown to have an excess of protein polymorphism in the sister species D. simulans [24], thus potentially revealing a rare case of trans-specific balancing selection.
To further investigate whether the outlier regions are indeed associated with recent selective sweeps and balancing selection, we estimated Tajima's D (DT; [69]) to quantify potential differences in the frequency of polymorphic variants within the population. Selective sweeps and balancing selection are predicted to generate an excess of low-frequency (negative DT) and intermediate-frequency (positive DT) variants, respectively. In agreement, outlier regions with negative and positive πsil-R have more negative (Mann-Whitney U Test, P = 4.3×10⁻¹⁰) and more positive (P<1×10⁻¹²) DT, respectively, than regions not departing from BGS expectations. Moreover, we observe a positive association between πsil-R and DT across the genome (ρ = 0.280, P<1×10⁻¹²) that is stronger than between πsil and DT (ρ = 0.087). Notably, this association between πsil-R and DT increases across trimmed chromosomes (ρ = 0.302 and ρ = 0.637 for trimmed autosomes and the X chromosome, respectively; P<1×10⁻¹²). Taken together, these results reinforce the concept that estimates of πsil-R obtained when using BGS predictions as baseline are a good predictor of recent selective sweeps and balancing selection, capturing departures in number of polymorphic sites as well as the expected consequences on variant frequency.
Outliers at 1-kb scale
The study of 1-kb regions reveals 1,213 of them having diversity levels that depart from BGS expectations with nominal P<0.01, 1,186 and 27 of these regions show a relative excess and deficit of πsil, respectively. Fifty-two regions (0.076%) show an FDR corrected q<0.10, all with higher πsil than predicted by the BGS model. Twenty-five out of the 27 1-kb regions showing a reduction in πsil with P<0.01 cluster together at position 8.017–8.103 Mb along chromosome arm 2R, in agreement with the analyses at 100 - and 10-kb scales that detected outlier regions near gene Cyp6g1. This more detailed analysis suggests that the target of selection is likely located at or proximal to Cyp6g1. The other two outlier regions with deficit in πsil are located at genes cic (regulation of transcription) and CG11266 (mRNA binding and splicing).
In terms of regions with an excess of πsil, the strongest signal of balancing selection based on 100 - and 10-kb analyses (19.3–19.4 along chromosome arm 2L) is now localized with more precision close to genes CG17349 and CG17350. Other regions detected at 10-kb scale are also identified at this finest scale and include genes PH4αNE2, dpr20, and Dhc16F (all with FDR q-value<0.10). Additional candidate regions under balancing selection include genes CecA1/CecA2/CecB (antibacterial humoral response), Sema-5c (olfactory behavior), CG5946 (inter-male aggressive behavior), IM4 (defense response), Cyp6a16 (a P450 gene), and three genes encoding cuticular proteins (Cpr11A, Cpr62Bb and Cpr65Ec), among others. Finally, the study of 1-kb regions also shows a strong positive relationship between πsil-R and DT (ρ = 0.477, P<1×10⁻¹²), in agreement with the expected consequences of selective sweeps and balancing selection on the frequency of segregating variants (see above).
Negative relationship between estimates of B and the rate of protein evolution
Another prediction of the models of selection and linkage (either HHss or BGS) is that, parallel to a reduction in intra-specific variation, there will be a reduction in efficacy of selection (i.e., the Hill-Robertson effect [10], [70]–[76]). This general prediction has been previously confirmed in Drosophila using local low-resolution crossover rates as indirect measure for the magnitude of Hill-Robertson effects acting on a gene. These studies showed weak but highly significant associations between crossover rates and estimates of codon usage bias or rates of protein evolution [71], [74], [75], [77]–[85].
To investigate whether B landscapes also capture differences in efficacy of selection, we focused on selection against amino acid substitutions along the D. melanogaster lineage, after split from the D. simulans lineage (less than 5 mya [86]). To this end, we obtained the ratio of nonsynonymous to synonymous changes (ω, ω = dN/dS) for 6,677 protein encoding genes and, more informatively, the variation in ω after controlling for selection on synonymous mutations based on residual analysis (ωR; see Materials and Methods for details). When each gene is analyzed as a single data point, there is a negative association between B and ωR (ρ = −0.086, P = 2×10⁻¹²; Table 2). Interestingly, and contrary to the results of nucleotide diversity, the X chromosome shows a tendency for a stronger effect of B on ωR than autosomes: ρ = −0.189 (P = 3.4×10⁻⁸) and ρ = −0.071 (P = 5.7×10⁻⁸) for X-linked and autosomal genes, respectively. An equivalent but more clear pattern is observed at the scale of the resolution of our recombination maps (100 kb), where estimating the average ω and ωR for all genes within each region also allows for reducing idiosyncrasies of different genes influencing rates of protein evolution (e.g., gene expression breadth and levels, protein length, etc.; see [84]). At this scale, variation in B is negatively associated with ωR along autosomes (ρ = −0.160, P = 6.1×10⁻⁶) and the X chromosome (ρ = −0.367, P = 1.5×10⁻⁶; Table 2). Again, the association between estimates of B and rates of protein evolution is robust to different BGS models and parameters. Equivalent ρ are obtained for all eight BGS models investigated, and this is observed when analyzing individual genes (ρ between B and ωR ranging between −0.0856 and −0.0874; P≤3×10⁻¹²) and when using the average ωR for genes within 100-kb regions (ρ ranging between −0.187 and −0.193; P≤5.9×10⁻⁹) across the whole genome.

Temporal variation in recombination landscapes and its consequences
The association between B and rates of amino acid substitution along the D. melanogaster lineage, although highly significant in terms of associated probability, is much weaker than that for levels of polymorphism at silent sites. Heterogeneity in overall evolutionary constraints among proteins is expected to add substantial variance when investigating the consequences of B on ω relative to studies of B on πsil because πsil is only influenced by local Ne and the mutation rate. Nevertheless, temporally variable recombination rates at a given genomic location would also reduce the association between B and ω. Indeed, the high degree of intra-specific variation in crossover genetic maps within current D. melanogaster populations [31] together with differences in genetic maps between closely related Drosophila species [87]–[89] support the notion that recombination landscapes vary within short evolutionary scales, at least across trimmed chromosomes. Under this scenario, extant recombination rates and the corresponding estimates of linkage effects would be poor predictors of interspecific rates of protein evolution, even between closely related species.
In this study across the D. melanogaster genome, the use of recombination rates obtained experimentally would provide only an approximation for the relevant B along the lineage leading to D. melanogaster populations [84]. These estimates of B would be an even weaker predictor of ωR (or ω) along the D. simulans lineage after split from the D. melanogaster lineage. In agreement, we observe no significant relationship between B and ωR estimated along the D. simulans lineage (ρ = −0.009 based on the default BGS model whereas the other BGS models generate ρ ranging between −0.014 and +0.011; P>0.25 in all cases). A similar result has been obtained in comparisons of local crossover rates and rates of protein evolution between two other closely related Drosophila species, D. pseudoobscura and D. persimilis [88].
In species where BGS plays a significant role, temporal fluctuations in recombination landscapes could influence a number of analyses of selection that assume constancy in Ne, including estimates of the fraction of adaptive substitutions (α [6], [90]–[92]). Several studies have shown that the bias in estimating α can rapidly reach considerable values as a consequence of demographic changes, with α being overestimated when Ne influencing polymorphism is larger than Ne influencing divergence (Ne_Pol>Ne_Div; [34], [91]). We propose that temporal changes in recombination at a given genomic position would generate an equivalent scenario, with a B influencing polymorphism (B_Pol) that differs from long-term B influencing divergence (B_Div), or the corresponding terms for local Ne. Because long term Ne can be approximated by its harmonic mean [93], temporal fluctuations of recombination landscapes (and of local B and, therefore, local Ne) would also predict a tendency for local Ne_Pol≥Ne_Div. Such scenario would allow amino acid changes to make a larger relative contribution to divergence than to polymorphism, particularly in regions where recombination has recently increased, and thus bias estimates of α upward.
Precise quantitative predictions of the potential bias in α would minimally depend on the rate, magnitude and physical scale of the variation in recombination landscapes along lineages. To obtain initial insight into the effects of temporal changes in recombination rates on estimates of α, we investigated a rather simple and conservative scenario with forward population genetic simulations. In particular, we used the program SLIM [94] to capture the consequences of temporal changes in linkage effects on estimates of α when only neutral and deleterious mutations occur along an archetypal 1-Mb region for D. melanogaster that includes 100 protein coding genes (see Materials and Methods for details). Figure 7 shows the results of estimating α at selected sites under fluctuating recombination rates, with cycles of moderately high recombination for 1N generations (with N indicating the diploid population size) followed by moderately low (not zero) recombination for 3N generations. Estimates of α based on models that assume constant population size [34], [91], [95] overestimate the true α particularly when extant recombination is high (α>0.3), with an overall α∼0.15 when the data is combined from all temporal points. As expected, models allowing for population size change [91] generate more unbiased estimates of α that show, nonetheless, a tendency upward, likely due to limitations assessing older population size changes.

Discussion
Discerning the relative contribution of different types of selection to patterns of intra - and interspecific variation is not trivial, in part because essential population and demographic parameters are often not known and the potential interactions among them are still poorly characterized. Here, we obtained the baseline of diversity across the genome predicted by BGS models completely independent of the data on nucleotide variation. The results of this study suggest that there might be no euchromatic region completely free of linkage effects to deleterious mutations in D. melanogaster. Instead, there are only genomic sites (neutral or under selection) associated with diverse degrees of BGS effects and thus under highly variable local Ne even across the recombining regions of the genome. In this regard, the heterogeneity in local Ne may bias population genetic estimates of selection or recombination if such variation is not taken into account. The pervasive presence of BGS has also potential consequences on demographic studies because BGS is known to generate a moderate excess of low-frequency variants [96]–[102]. As a result, demographic inferences based on allele-frequencies may be skewed, with consistent patterns suggestive of a recent population expansion.
The next question investigated was how much of the patterns of variation in D. melanogaster could be explained by purifying selection alone. The results are consistent with BGS playing a major role in explaining the observed heterogeneity in nucleotide diversity across the entire D. melanogaster genome. At 100-kb scale, BGS can explain ∼58% (ρ = 0.749–0.773 for different BGS models) of the variation of πsil across the genome. The study of smaller regions reduces the statistical association between B and πsil, but even when analyzing 10 - and 1-kb regions, B explains ∼46% (ρ = 0.678–0.682), and ∼30% (ρ = 0.551–0.554) of all the observed variance in πsil, respectively. These percentages increase up to ∼70% (ρ = 0.836) for 100-kb regions, ∼53% (ρ = 0.728) for 10-kb regions, and ∼36% (ρ = 0.599) for 1-kb regions, across individual chromosome arms.
Importantly, these conclusions are robust to differences in parameters of the BGS model (e.g., deleterious mutation rates, DDFE, or recombination) even though the precise magnitude of BGS effects does depend on these parameters. Median estimates of B range between 0.337 and 0.769 for different BGS models, but the distribution of B along the chromosomes maintains the same rank order (pairwise ρ between estimates of B generated by the BGS models is ≥0.9856) and is similarly associated with the observed distribution of nucleotide diversity.
Taken together, the results and conclusions of this study imply that null expectations based on models that ignore linkage effects to deleterious mutations (or assume homogeneous distribution of Ne across the genome) are likely inaccurate in D. melanogaster, even across trimmed chromosomes. The fact that deleterious mutations are more frequent than mutations involved in balancing selection or adaptive events, together with the robustness of our conclusions to reasonable ranges of selection and mutation parameters, suggest that BGS predictions may be adequate as a baseline of diversity levels and can be used detect outlier regions subject to other selective regimes.
The use of B as baseline reveals several regions with signal of recent directional selection and associated selective sweeps, where levels of variation are lower than those predicted by BGS alone (e.g., near gene Cyp6g1 [26], [64]). In agreement with expectations after a selective sweep, these regions also show an excess of variants at low frequency. A number of other regions with reduced levels of variation, however, are located in recombining genomic regions where BGS is predicted to have strong effects. These results, therefore, are consistent with a detectable but limited incidence of recent classic ‘hard sweeps’ (where diversity is fully removed near the selected sites) caused by beneficial mutations with large effects. Still it must be acknowledged that older selective sweeps, sweeps caused by weakly beneficial mutations, or ‘soft sweeps’ associated with standing genetic variation or polygenic adaptation [103], [104] would not be detected in this study.
In fact, estimates of the proportion of adaptive substitutions indicate that beneficial mutations are not rare in Drosophila [6], [90]–[92]. Moreover, analyses of nucleotide diversity around amino acid substitutions suggest that a majority of these beneficial mutations involve small effects on fitness [25], [105], [106] and cause detectable but very localized reduction in adjacent diversity (at the scale of 25 bp; [105], [106]). Therefore, a bulk of beneficial mutations in Drosophila may be difficult to detect in genome-scans of variation but could contribute significantly to differences between species and overall adaptive rates of evolution.
BGS baselines, however, are particularly adequate to detect genomic regions under balancing selection because the predicted genomic signature of an excess of diversity may not be always evident when compared to genome-wide averages or purely neutral expectations (see Figure 6). Indeed, the use of a B baseline across the whole D. melanogaster genome provides the adequate local Ne context caused by purifying selection and corresponding linkage effects. In all, our study uncovers numerous candidate regions for balancing selection, identifying genes involved in sensory perception of chemical stimulus, antibacterial humoral response, olfactory behavior, inter-male aggressive behavior, defense response, etc. These genomic regions not only show a relative excess of polymorphic sites but also have segregating variants at higher frequency than the rest of the genome (another telltale sign of balancing selection). The results based on the study of a single population are appealing since heterogeneous environments or temporal changes predict the maintenance of local polymorphism through balancing selection [107]–[109], and are consistent with analyses of clines in D. melanogaster that detected the signature of local adaptation and spatially varying selection between populations [64], [110], [111].
Additionally, the results evidence a clear difference between autosomes and the X chromosome in terms of the consequences of variable B on levels of variation. While the X chromosome exhibits a reduced association between B and neutral diversity than autosomes, it shows a better fit between B and rates of protein evolution and efficacy of selection. These patterns are predicted by higher rates of recombination and a higher fraction of deleterious mutations with minimal role generating BGS effects in the X (see Material and Methods). Another factor possibly influencing this difference between X and autosomes is stronger efficacy of selection in the X chromosome [112]. Indeed, events of adaptive and/or stabilizing selection would distort levels of neutral diversity at linked sites beyond BGS predictions and stronger selection in the X would explain a reduced association between B and levels of diversity along the X relative to autosomes. Such combined scenario of reduced BGS effects and stronger selection would also explain a number of patterns observed in Drosophila, including an increased degree of synonymous codon usage bias [112]–[115], stronger purifying and positive selection acting at the level of protein evolution in X-linked genes [115], [116], and the ‘faster-X’ effect [117], [118] reported at both protein and gene expression levels [119]–[123]. Of interest will be the study of species with higher average recombination rate in autosomes than in the X, thus partially uncoupling differences in linkage effects and X-specific patterns.
Moreover, the results of this and previous studies [26], [87]–[89] suggest that recombination rates change frequently in the Drosophila genus, and often involve differences in the distribution of recombination rates across the genome (i.e., a change of the recombination landscape). Very recent changes in recombination landscapes would uncouple extant recombination rates and polymorphism patterns generated during the last few ∼Ne generations and, therefore, the reported contribution of BGS to patterns of diversity across the genome may be underestimated. On the other hand, changes in the recombination environment in species where BGS plays a significant role would also predict temporal variation in local B and impact a number of studies of selection that assume constancy of Ne along lineages or that changes in Ne should be equivalent across the genome.
Temporally variable recombination landscapes can generate, for instance, spurious evidence for multimodality in the distribution of fitness effects, or lineage-specific physical clustering of amino acid changes (such clustering has been observed among Drosophila species [124], [125]). Another consequence of temporally variable recombination landscapes (and local B and Ne) would be gene - or region-specific inequality of short - and long-term Ne. Regions that have recently increased in recombination would show patterns of variation suggesting population expansion or bias estimates of α upward, making it less negative or even positive with no adaptive mutations [126]. Moreover, these changes in recombination landscape would also forecast substantial between-gene variation in α without requiring adaptive evolution. At this point, therefore, there is the open possibility that positive estimates of α in Drosophila and other species with large population size (see [6], [22] and references therein) may be influenced, to an unknown degree, by temporal changes in recombination rates and landscapes. Future analyses designed to estimate population size changes or the strength and frequency of adaptive events would, therefore, benefit from including variable BGS effects across genomes and along lineages, ideally discerning local variation in BGS (and local Ne) from genome-wide patterns that may represent true demographic events. Genome-wide analyses may also need to consider the non-negligible presence of regions under balancing selection to prevent overestimating the extent of recent sweeps based on a relative reduction in levels of diversity.
Finally, a number of limitations and areas for future improvement need to be mentioned. In terms of selection, we investigated BGS models based on either a log-normal or a gamma DDFE [39]–[43], [46], [127]. Trying to include all possible mutations with deleterious effects across a genome into a single distribution is, however, a clear oversimplification. A combination of different DDFEs for different groups of genes and/or sites would be a more fitting approach, ideally based on a priori information independent of levels of variation (e.g., based on amino acid composition, expression levels and patterns, connectivity, etc. [84]).
To gain initial insight into the potential consequences of more realistic models, we obtained estimates of B under BGS models that allow for two DDFEs (one for nonsynonymous changes and one for changes at constrained noncoding sites; see Materials and Methods for details). We then investigated whether such models would alter our conclusions, mostly in terms of the proposed adequacy of using BGS predictions as baseline to detect outliers. The results show that models with two DDFEs depart only marginally from the models with a single DDFE: rank correlations between estimates of B predicted by these hybrid models and all eight previous models show ρ ranging between 0.946 and 0.998. The association between predicted B and the variation of πsil across the genome is also very high (albeit slightly lower than for models based on a single DDFE), with ρ≥0.711at 100-kb scale and ρ≥0.504 at 1-kb scale. Notably, the comparison of outliers generated by these 2-DDFE models with those obtained by the models described above reveals few differences. For instance, 50 out of the 52 significant (FDR q-value<0.10) 1-kb outlier regions based on the default model are also predicted to be equally significant outliers by a model assuming a log-normal DDFE for nonsynonymous mutations and a gamma for deleterious noncoding mutations (the other two regions show departure with P<0.0001). Overall, 87.1% of the 1,213 1-kb regions showing departure at P<0.01 using the default BGS model are also detected as outliers (P<0.01) under this hybrid model. These results further support the robustness of the proposed approach to detect outlier regions based on BGS baselines.
Another line of future improvement is the physical resolution of our recombination maps and, perhaps more important, how well these maps represent the recent history of a population or species. To generate B landscapes, we used recombination maps that were experimentally obtained (independent of nucleotide variation data) and capture some intra-specific variation in recombination landscapes (see [31] for details). The fact that these B landscapes explain a very large fraction of the variance in nucleotide diversity across the genome suggests that these recombination maps represent quite accurately the recombination landscape in the recent history of D. melanogaster. Future recombination maps obtained from additional natural strains and populations, or under different biotic/abiotic conditions, can only improve the confidence in outlier regions and, ultimately, our understanding of selective and demographic events in this species.
Materials and Methods
General BGS expectations
The consequences of BGS at a given nucleotide position in the genome (focal point) can be described by B [12]–[15], the predicted level of neutral nucleotide diversity under circumstances where selection and linkage are allowed (π) relative to the level of diversity under complete neutrality and free recombination (π0). Following [15], [16], we have

Molecular evolutionary analyses indicate variable fitness effects of deleterious mutations [44], [121], [127], [128] and, therefore, a probability distribution of deleterious fitness effects (DDFE) of mutations at site i, ϕ(si) needs to be included, generating

High-resolution estimates of B across the whole D. melanogaster genome
We investigated a model that assumes the possibility of strongly deleterious mutations at nonsynonymous sites as well as at a fraction of noncoding sites, either untranslated genic (introns and 5′ - and 3′-flanking UTRs) or intergenic regions. B, therefore, can be estimated at any focal neutral site of the genome as the cumulative effects of deleterious mutations at any other nonsynonymous, untranslated genic and intergenic site along the same chromosome. For simplicity¸ and based on analyses of rates of evolution between Drosophila species [22], [37], [38], [44], [91], we assumed that the distribution and magnitude of selection on intergenic or UTR noncoding strongly selected sites [] is equivalent to that on nonysynonymous sites [].
We can estimate B at any focal neutral site of the genome using the equation described above, , the actual genome annotation (D. melanogaster annotation release 5.47, http://flybase.org/) and high-definition recombination maps for crossing over and gene conversion events [31]. The analysis of every nucleotide sites along a single chromosomal arm taking into account all other sites under selection of this same chromosome would, however, require >1×10¹³ pair-wise nucleotide comparisons, each one requiring a numerical integration. To speed up the process we followed [17] and first obtained the integral

By dividing a chromosome arm into L adjacent 1-kb windows, B at a focal neutral site located at the center of the j-th window (Bj), can be estimated by using:


Deleterious mutation rates
Initial estimates of the mutation rate based on mutation accumulation lines in D. melanogaster suggested a mutation rate (u) of ∼8.4×10⁻⁹/bp/generation, for point mutations and small indels [47]. More recent analyses suggest u ∼4–5×10⁻⁹/bp/generation after removing data from a line with unusually high mutation rates [48]–[50]. Based on the fraction of conserved sites in exons and noncoding sequences [22], [37], this lower mutation rate predicts a diploid rate of deleterious mutations per generation (U) of 0.6 for euchromatic regions. U∼0.6, however, is an underestimate of the true U in D. melanogaster because it does not take into account the recent bottleneck experienced by North America populations (see [48]) or the deleterious consequences of TE insertions within genes and regulatory sequences. Additionally, the elevated mutation rate observed in one line (line 33 [47], [48]) is not a new trait developed during the mutation accumulation experiment and, therefore, such genotype was present in the initial natural population of D. melanogaster. We, thus, use U = 0.6 as a lower boundary for the true deleterious mutation rate across the euchromatic genome (in models MLowMut).
TEs are pervasive across the D. melanogaster genome [51]–[60]. Cridland et al (2013) recently reported a detailed analysis of TE abundance and distribution in D. melanogaster based on deep-coverage, whole-genome sequencing [60]. Their analysis of the Drosophila Synthetic Population Resource (DSPR; [129]) showed a total of 7,104 TE insertions, with 633 TEs inserted within exons. To include the deleterious consequences of TE insertion, therefore, we obtained an approximate mutation (insertion) rate (uTE) based on mutation-selection balance predictions and the presence of TEs in genomic regions where they are most likely to cause deleterious effects (i.e., within exons). [We use TE presence in the DSPR lines instead of analyses based on the Drosophila Genetic Reference Panel (DGRP) due to the higher sequencing coverage in the DSPR lines, which increases the likelihood to detect and map TE insertions (see [60] for details)]. For non-recessive strongly deleterious mutations, mutation-selection balance predicts a probability of segregation Pseg that is the product of the equilibrium frequency (q) and the number of chromosomes analyzed (n). Pseg in exons (/bp) is 0.00003 (633 TEs/21,000,000 exonic bp) and q = Pseg/n = 2×10⁻⁶. Based on the very low frequency of segregating TEs in natural populations (i.e., most TEs in this study were present in a single genome in agreement with previous analyses of D. melanogaster populations; see [53], [57], [58]), we assume non-recessive deleterious effects and a heterozygous selection coefficient (sh) against TE insertions within exons to be equal or greater than for amino acid mutations (s≥0.0025), so uTE can be estimated by uTE = q sh, with uTE≥5×10⁻⁹/bp/generation. Thus, we obtain UTE∼0.6, a result in agreement with previous analyses of TE transposition rate that suggested that the genomic rate of TE transposition is of the same order as the nucleotide spontaneous mutation rate [55], and suggests U∼1.2 when including point mutations, small indels and TE insertions across the euchromatic regions of the D. melanogaster genome.
Distribution of deleterious effects
The true probability distribution of selection coefficients against newly arising mutations is not known. Sensibly, no single deleterious distribution of fitness effects (DDFE) is likely to capture mutations at different genes or sites within genes. Different spatial and temporal conditions will, likely, further alter such DDFEs. As an approximation, we studied two DDFEs and the corresponding parameters proposed for Drosophila to partially capture the potential effects of different DDFEs on our results and conclusions: a gamma distribution [39]–[44] and a log-normal distribution [45], [46], with the latter allowing to capture the presence of lethal mutations and fitting better D. melanogaster polymorphism data [45], [46].
Following Loewe and Charlesworth [45], the log-normal DDFE has a median s of 0.000231 and standard deviation 5.308 for autosomes. A gamma DDFE for Drosophila is described by a shape parameter k = 0.3 and mean s of 0.0025 [33], [38]. In both cases, we assumed a dominance coefficient h of 0.5. For models that include the contribution of TE insertions (U = 1.2), we further assumed that the DDFE of TEs is the same than of point mutations, and that the genomic sites where a TE insertion has deleterious effects are the same where point mutations and small indels have deleterious effects. Note that under the models that include a log-normal DDFE, the median s against individual TE insertions (0.000231) is equivalent to previous estimates in D. melanogaster of 0.0002 [54].
An interesting attribute of the log-normal distribution is that it predicts a higher frequency of extreme values, including effectively neutral (s<sT) and lethal (s>1) mutations, than those predicted by a gamma distribution. Because effectively neutral and strongly deleterious mutations play a minimal role removing linked variation [130], a log-normal DDFE is predicted to generate weaker BGS effects than a gamma DDFE with similar median s. Finally, it is worth noting that the parameters for these two DDFEs were obtained independently of a BGS model and therefore are not expected to maximize BGS as explanation of the observed patterns of diversity across the genome while, at the same time, may represent underestimates of the true magnitude of selection.
BGS with crossover and gene conversion along D. melanogaster chromosomes
To estimate the recombination frequency between a focal neutral site and selected sites in BGS formulae, we used the whole-genome high-resolution recombination maps from D. melanogaster described in [31]. These maps describe crossing over and gene conversion rates along chromosome arms (except the small fourth chromosome) at 100-kb resolution. Following Langley et al ([131]; see also [45], [132]), the total recombination frequency between a focal neutral site and a selected i-th site taking into account crossing over and gene conversion is:

BGS models and parameters
We initially investigated eight BGS models using the formulas described above, with two DDFEs (log-normal or gamma; models MLN and MG, respectively), two deleterious mutations rates (U = 1.2 or 0.6; models MStdMut and MLowMut, respectively), and two recombination scenarios (with only crossovers or crossovers and gene conversion events; models MCO and MCO+GC, respectively). For instance, the full notation of a model that uses a log-normal DDFE, a deleterious mutation rate of U = 0.6, and recombination that only considers crossovers is MLN,LowMut,CO.
To obtain the number of sites Naa, Nutr_ss and Nnc_ss for each 1-kb region, we followed the approach described by Charlesworth [33]. We assume 0.75 as the fraction of coding sites that alter amino acid sequences and correct this fraction by the proportion of constrained nonsynonymous sites (cs) to focus only on the fraction of deleterious mutations. In D. melanogaster, cs for amino acid sites is ∼0.92 [22], [37] and, thus, Naa for a regions is Lcoding×0.75×0.92. To obtain Nutr_ss, we correct the number of noncoding genic sites using the proportion of constrained sites (0.56 for introns and 0.81 for flanking UTRs [22]) and, equivalently, we use the proportion of constrained sites at intergenic sequences (∼0.5) [22], [37] to obtain Nnc_ss.
The deleterious mutation rate per bp (u) will be different for different models, due to the overall mutation rate and because different DDFEs predict a different fraction of deleterious mutations with s<sT that will not contribute to BGS. The two mutation rates investigated here, U = 0.6 (MLowMut) and 1.2 (MStdMut), represent a neutral mutation rate of 4.2×10⁻⁹ and 8.4×10⁻⁹/bp/generation. Assuming Ne = 1,000,000 for D. melanogaster, the log-normal and gamma DDFEs described above predict 15.3 and 7.4% of deleterious mutations with s<sT, respectively. Therefore, the deleterious mutation rate relevant for BGS is 84.7 (MLN) and 92.6% (MG) that of the mutation rate.
BGS models with two DDFEs
All previous BGS models assume a single DDFE for sites under selection. As a first approximation towards more realistic description of selection across the genome, we investigated two additional models that allow for two DDFEs, one for nonsynonymous mutations and the other for deleterious noncoding mutations (each DDFE following the parameters indicated above). The B landscapes generated by these hybrid models are intermediate relative to the other eight models: a model assuming a log-normal DDFE for nonsynonymous mutations and a gamma for deleterious noncoding mutations (MLN/G,StdMut,CO+GC) shows a genome-wide median B of 0.469 whereas a model with a gamma DDFE for nonsynonymous mutations and a log-normal for deleterious noncoding mutations (MG/LN,StdMut,CO+GC) shows a median B of 0.459. Spearman's rank ρ between estimates of B across the genome from these 2-DDFE models and the other eight single-DDFE models range between 0.974 and 0.998 for MLN/G,StdMut,CO+GC, and between 0.946 and 0.986 for MG/LN,StdMut,CO+GC.
X chromosome
For the X chromosome, we have assumed equivalent deleterious mutations rates than for autosomes and adjusted the distribution of selection coefficients to sX = 2/3 sA (assuming equal number of breeding males and females in the population and genic selection, h = 0.5). Estimates of the ratio of observed neutral diversity for the X and autosomes (X/A) also assume equal number of males and females, with X/A = 0.75×BX/BA. Equivalently, sT for the X chromosome varies from that for autosomes, with sT for the X chromosome now satisfying Ne X sX∼1. For the X chromosome, the log-normal and gamma DDFEs predict 18.6 and 9.1% of deleterious mutations with s<sT, respectively (both percentages higher that for autosomes, see above). Finally, we allowed for an effective difference in recombination rates due to the lack of meiotic recombination in Drosophila males, with 0.5r and 0.66r for autosomes and the X chromosomes, respectively. For each of the BGS models under study, we obtained specific solutions to the integrals described above along a continuum of recombination rates for the X chromosome and autosomes separately.
Complete and trimmed chromosomes
All analyses were carried out based on the study of complete chromosome arms as well as after removing euchromatic regions near to centromeres and telomeres with evident reduction in crossover rates [133]. Following [26] we use the term trimmed chromosomes or trimmed genome to designate genomic regions after removing sub-centromeric and -telomeric regions with strongly reduced crossover rates. Sub-centromeric regions with reduced crossover rates were assigned by starting at the centromere and moving into the chromosome arm until a minimum of 3 consecutive 100-kb windows showed crossover rates >1 cM/Mb. Sub-telomeric regions with evident reduction in crossover rates were assigned in an equivalent manner, by starting at the telomere and moving towards the center of the chromosome until a minimum of 3 consecutive 100-kb windows showed >1 cM/Mb.
Estimates of neutral nucleotide diversity across the D. melanogaster genome
Nucleotide diversity across the D. melanogaster genome was estimated from a sub-Saharan African population (Rwanda, RG, population of the Drosophila Population Genetics Project, DPGP; www.dpgp.org/ and [62]). D. melanogaster is thought to have originated in sub-Saharan Africa, and eastern Africa—including Rwanda—in particular [134]. Our use of the RG population, therefore, minimizes the non-equilibrium effects caused by recent expansion observed in western Africa and non-African D. melanogaster populations [62], [134]. Additionally, the RG population combines a relatively large sample (n = 27), and low and well characterized levels of admixture [62]. We followed Pool et al. (2012) and used updated assemblies from the DPGP2.v3 site (see http://www.dpgp.org/dpgp2/DPGP2.html and [62] for details). We analyzed these assemblies with, 1) sites putatively heterozygous or with quality value smaller than Q31 masked to ‘N’, and 2) putatively admixed regions of African genomes filtered to “N” based on the description of admixed regions from [62] (also available from http://www.dpgp.org/dpgp2/DPGP2.html). Finally, we only investigated non-N sites that were present in a minimum of 10 sequences. Equivalent results were obtained when the analyses were restricted to sites with a minimum of 15 sequences, or after removing regions showing excess admixture as well as regions showing excess long-range identity-by-descent (IBD) [62] (data not shown).
Neutral (silent) diversity was estimated as pairwise nucleotide variation per site at intergenic sequences and introns (πsil) and following the approach described in [31]. In short, we first annotated all gene models, transposable elements and repetitive sequences onto the reference sequence allowing for overlapping annotation. Intergenic sites correspond to sites between gene models (excluding annotated UTRs), transposable elements or repetitive sequences. Intronic sites are analyzed as such only when they never overlap with another annotation (e.g., with alternatively spliced exons or other elements within introns). After this filtering approach, intergenic and intronic sites show similar levels of silent diversity, with a very weak tendency for πsil in introns (πintrons = 0.0085) to be higher than in intergenic (πintergenic = 0.0082) sites (Sign test, P = 0.034 and P = 0.056, along autosomes and X chromosome, respectively).
Unless indicated otherwise, diversity analyses were performed using all 100-kb non-overlapping windows across the genome whereas analyses of 10-kb and 1-kb regions were limited to regions with more than 1,000 and 500 silent sites, respectively. Inferences about the frequency of segregating variants within the population were based on estimates of Tajima's D [69] after normalizing by Dmin (D/Dmin) following Schaeffer (2002) [135]. Equivalent conclusions were obtained when using DGRP sequenced strains [136] from a North American natural population (Raleigh, NC, USA).
Outliers of nucleotide diversity
To parameterize departures of observed levels of diversity πsil relative to the levels predicted by B, we applied a generalized regression model (GRM), and obtained regression residuals πsil-R. In particular, we obtained studentized residuals to detect outlying values and obtain associated probabilities. Studentized residuals are equivalent to standardized residuals (the ratio of the residual to its standard error) and have a Student's t distribution, but in the case of studentized residuals the data point or observation under study (possibly an outlier) is removed from the analysis of the standard error. Because the sample size in our analyses is very large and the fraction of outliers small, studentized and standardized residuals are almost equivalent and generate the same outiler regions at the three physical scales analyzed. We applied GRM separately to autosomes and X chromosome to prevent including assumptions about the true X/A ratio. To correct for multiple tests, we applied the Benjamini and Hochberg (1995) method with FDR = 0.10.
Estimates of rates of protein evolution
Genes and sequence alignments
We obtained CDS sequence alignments in the 5 species of the D. melanogaster subgroup (D. melanogaster, D. simulans, D. sechellia, D. yakuba and D. erecta) based on multiple-species alignments available from the UCSC Genome Browser (http://hgdownload.cse.ucsc.edu/goldenPath/dm3/multiz15way/alignments/flyBaseGene.exonNuc.fa.gz) and current gene annotation and genomic location in D. melanogaster (http://flybase.org; D. melanogaster annotation release 5.47, 10/9/2012). We removed genes with coding sequences in D. melanogaster shorter than 450 bp or with fewer than 100 amino acids positions present in all five species after alignment. We also removed genes presenting premature stop codons in at least one species relative to the stop codon position in D. melanogaster. Finally, for genes with multiple transcript forms we chose the CDS alignment corresponding to the longest transcript. In total, we investigated rates of evolution in 6,876 protein-coding genes.
Rates of protein evolution
We obtained dN (the number of nonsynonymous substitutions per nonsynonymous site), dS (the number of synonymous substitutions per synonymous site)and ω (the ratio dN/dS) for each gene. To this end, we used the program codeml as implemented in PAML v 4.5 [137], [138] and applied a branch model that allowed different ω in all internal and external branches of the five-species tree. We focused on ω along the D. melanogaster branch after split from the D. simulans lineage to investigate recent patterns of efficacy of selection on amino acid changes and the possible association with BGS effects across the genome based on recombination rates estimated in D. melanogaster.
We followed Larracuente et al. (2008) [84] to prevent combining genes with amino acids evolving under positive selection and genes with most amino acids evolving under a nearly neutral scenario, either purifying selection or neutrality. We, therefore, applied codeml and compared Model M1a (nearly neutral evolution) against a model that allows the additional presence of positive selection at a fraction of sites (model M2a). In particular, we compared maximum likelihood estimates (MLEs) under these two models and applied a likelihood ratio tests (LRTs) [139], [140] to detect differences between the models. A total of 125 genes showed evidence of positive selection in the D. melanogaster lineage after applying the Benjamini and Hochberg (1995) method to correct for multiple tests (FDR = 0.05). To further reduce the incidence of genes under positive selection and/or recent pseudogenization we removed genes showing ω greater than 0.75 (note that the median ω in the D. melanogaster lineage is 0.0696). In all, we investigated 6,677 genes with no evidence of positive selection or drastic reduction in constrains along the D. melanogaster lineage.
Finally, we took into account the consequences of variable recombination and B on the efficacy of selection on synonymous mutations. In D. melanogaster, synonymous mutation are under weak selection ([113] and references therein) and therefore a reduction in efficacy of selection is predicted to increase dS, possibly biasing the direct use of the ratio dN/dS. On the other hand, the inclusion of dS corrects for possible differences in coalescent times and ancestral polymorphism across the chromosome. We then applied generalized linear models, GRM, and obtained regression residuals of ω along the D. melanogaster lineage after controlling for dS (ωR) and used ωR as an estimate of variable efficacy of selection on amino acid changes. Equivalent results are obtained when we used regression residuals of dN along the D. melanogaster lineage after controlling for dS (dN-R) as an estimate of variable efficacy of selection on amino acid changes. We obtained regression residuals of ω or dN for autosomes and the X chromosome separately.
Forward computer simulations and estimates of the proportion of adaptive substitutions
We used the program SLIM [94] to capture the consequences of temporal changes in recombination rates on estimates of α. Simulations followed a panmictic population of 10,000 diploid individuals (N) and a chromosome segment of 1 Mb that contained 100 protein encoding genes evenly distributed, one every 10 kb. Each 10-kb region included a typical Drosophila gene: a 1,000 bp 5′ UTR, a first short 300-bp exon, a 1,000 bp first intron, two additional 600 bp exons, a short 200-bp internal intron, and a 300 bp 3′-UTR, followed by a 5,000 bp intergenic sequence. Mutations were assigned to have the same parameters than those in the BGS models described above, with two mutation types: neutral and deleterious. The population mutation rate was set to Nu = 0.005 and deleterious mutations were assumed to follow a gamma DDFE (h = 0.5) with average Ns = −2,500 [33], [38]. The proportion of deleterious mutations at the different genomic elements was set to 0.92 at first and second codon positions, 0.81 at UTRs, 0.56 at introns, and 0.5 at intergenic sites [22], [37]; all third codon positions evolved neutrally. Note that the simulation of a smaller population would prevent the study of deleterious mutations with the appropriate scaled selection for Drosophila (Ns = −2,500) while the simulation of shorter genomic sequences would severely underestimate BGS effects in regions with non-reduced recombination.
Simulations followed 10 independent populations a minimum of 50 N generations after reaching equilibrium (>10 N generations). Recombination rates were uniformly distributed, with a population crossover rate (/bp) of NrCO = 0.04 and NrCO = 0.0025 for periods of high and low recombination, respectively. To prevent overestimating BGS effects we also included a constant rate of gene conversion initiation (/bp) of Nγ = 0.05 and average gene conversion tract length of LGC = 518 [31]. After the initial 10N generations, we sampled the population every 0.1N generations, obtained polymorphism data from 20 randomly drawn chromosomes, and compared them to a sequence that evolved independently for 20N generations to obtain divergence (d) values. These levels of polymorphism and divergence are equivalent to those observed within D. melanogaster for polymorphism and between D. melanogaster-D. simulans for divergence, where d/θ = ∼6 for neutral sites [95]. Estimates of α at selected sites were restricted to the 100-kb central region to capture long-range BGS effects. Following Eyre-Walker and Keightley [91], α was obtained by maximum likelihood (ML) to capture the presence of strongly deleterious mutations in the simulations, with and without the possibility of population size change, and with and without correcting for the contribution of polymorphism to divergence [95]. Estimates of α were obtained using the DFE-alpha server (http://lanner.cap.ed.ac.uk/~eang33/dfe-alpha-server.html).
Supporting Information
Zdroje
1. CharlesworthB (2012) The effects of deleterious mutations on evolution at linked sites. Genetics 190 : 5–22.
2. GillespieJH (2000) Genetic drift in an infinite population. The pseudohitchhiking model. Genetics 155 : 909–919.
3. BartonNH (2010) Genetic linkage and natural selection. Philosophical Transactions of the Royal Society of London Series B: Biological Sciences 365 : 2559–2569.
4. StephanW (2010) Genetic hitchhiking versus background selection: the controversy and its implications. Philos Trans R Soc Lond B Biol Sci 365 : 1245–1253.
5. CutterAD, PayseurBA (2013) Genomic signatures of selection at linked sites: unifying the disparity among species. Nat Rev Genet 14 : 262–274.
6. FayJC (2011) Weighing the evidence for adaptation at the molecular level. Trends Genet 27 : 343–349.
7. BartonNH (2000) Genetic hitchhiking. Philos Trans R Soc Lond B Biol Sci 355 : 1553–1562.
8. Maynard SmithJ, HaighJ (1974) The hitch-hiking effect of a favorable gene. Genet Res 23 : 23–35.
9. StephanW, SongYS, LangleyCH (2006) The hitchhiking effect on linkage disequilibrium between linked neutral loci. Genetics 172 : 2647–2663.
10. HillWG, RobertsonA (1966) The effect of linkage on limits to artificial selection. Genetical Research 8 : 269–294.
11. BravermanJM, HudsonRR, KaplanNL, LangleyCH, StephanW (1995) The hitchhiking effect on the site frequency spectrum of DNA polymorphisms. Genetics 140 : 783–796.
12. CharlesworthB, MorganMT, CharlesworthD (1993) The effect of deleterious mutations on neutral molecular variation. Genetics 134 : 1289–1303.
13. CharlesworthB (1994) The effect of background selection against deleterious mutations on weakly selected, linked variants. Genetical Research 63 : 213–227.
14. CharlesworthB, BetancourtAJ, KaiserVB, GordoI (2009) Genetic recombination and molecular evolution. Cold Spring Harbor Symposia on Quantitative Biology 74 : 177–186.
15. HudsonRR, KaplanNL (1995) Deleterious background selection with recombination. Genetics 141 : 1605–1617.
16. NordborgM, CharlesworthB, CharlesworthD (1996) The effect of recombination on background selection. Genet Res 67 : 159–174.
17. McVickerG, GordonD, DavisC, GreenP (2009) Widespread genomic signatures of natural selection in hominid evolution. PLoS Genet 5: e1000471.
18. HernandezRD, KelleyJL, ElyashivE, MeltonSC, AutonA, et al. (2011) Classic selective sweeps were rare in recent human evolution. Science 331 : 920–924.
19. LohmuellerKE, AlbrechtsenA, LiY, KimSY, KorneliussenT, et al. (2011) Natural selection affects multiple aspects of genetic variation at putatively neutral sites across the human genome. PLoS Genet 7: e1002326.
20. ChunS, FayJC (2011) Evidence for hitchhiking of deleterious mutations within the human genome. PLoS Genet 7: e1002240.
21. ReedFA, AkeyJM, AquadroCF (2005) Fitting background-selection predictions to levels of nucleotide variation and divergence along the human autosomes. Genome Res 15 : 1211–1221.
22. SellaG, PetrovDA, PrzeworskiM, AndolfattoP (2009) Pervasive natural selection in the Drosophila genome? PLoS Genet 5: e1000495.
23. MacphersonJM, SellaG, DavisJC, PetrovDA (2007) Genomewide spatial correspondence between nonsynonymous divergence and neutral polymorphism reveals extensive adaptation in Drosophila. Genetics 177 : 2083–2099.
24. BegunDJ, HollowayAK, StevensK, HillierLW, PohYP, et al. (2007) Population genomics: Whole-genome analysis of polymorphism and divergence in Drosophila simulans. PLoS Biol 5: e310.
25. AndolfattoP (2007) Hitchhiking effects of recurrent beneficial amino acid substitutions in the Drosophila melanogaster genome. Genome Res 17 : 1755–1762.
26. LangleyCH, StevensK, CardenoC, LeeYC, SchriderDR, et al. (2012) Genomic variation in natural populations of Drosophila melanogaster. Genetics 195 : 7–8.
27. WrightSI, AndolfattoP (2008) The impact of natural selection on the genome: Emerging patterns in Drosophila and Arabidopsis. Annual Review of Ecology Evolution and Systematics 39 : 193–213.
28. HahnMW (2008) Toward a selection theory of molecular evolution. Evolution 62 : 255–265.
29. JensenJD, ThorntonKR, AndolfattoP (2008) An approximate bayesian estimator suggests strong, recurrent selective sweeps in Drosophila. PLoS Genet 4: e1000198.
30. CharlesworthB (1996) Background selection and patterns of genetic diversity in Drosophila melanogaster. Genet Res 68 : 131–149.
31. ComeronJM, RatnappanR, BailinS (2012) The many landscapes of recombination in Drosophila melanogaster. PLoS Genet 8: e1002905.
32. SinghND, StoneEA, AquadroCF, ClarkAG (2013) Fine-scale heterogeneity in crossover rate in the garnet-scalloped region of the Drosophila melanogaster X chromosome. Genetics 194 : 375–387.
33. CharlesworthB (2012) The role of background selection in shaping patterns of molecular evolution and variation: evidence from variability on the Drosophila X chromosome. Genetics 191 : 233–246.
34. MesserPW, PetrovDA (2013) Frequent adaptation and the McDonald-Kreitman test. Proc Natl Acad Sci U S A 110 : 8615–8620.
35. WeissmanDB, BartonNH (2012) Limits to the rate of adaptive substitution in sexual populations. PLoS Genet 8: e1002740.
36. AndolfattoP (2005) Adaptive evolution of non-coding DNA in Drosophila. Nature 437 : 1149–1152.
37. CasillasS, BarbadillaA, BergmanCM (2007) Purifying selection maintains highly conserved noncoding sequences in Drosophila. Mol Biol Evol 24 : 2222–2234.
38. HaddrillPR, LoeweL, CharlesworthB (2010) Estimating the parameters of selection on nonsynonymous mutations in Drosophila pseudoobscura and D. miranda. Genetics 185 : 1381–1396.
39. SawyerSA, KulathinalRJ, BustamanteCD, HartlDL (2003) Bayesian analysis suggests that most amino acid replacements in Drosophila are driven by positive selection. J Mol Evol 57: S154–S164.
40. LoeweL, CharlesworthB, BartolomeC, NoelV (2006) Estimating selection on nonsynonymous mutations. Genetics 172 : 1079–1092.
41. PiganeauG, Eyre-WalkerA (2003) Estimating the distribution of fitness effects from DNA sequence data: implications for the molecular clock. Proc Natl Acad Sci U S A 100 : 10335–10340.
42. NielsenR, YangZ (2003) Estimating the distribution of selection coefficients from phylogenetic data with applications to mitochondrial and viral DNA. Mol Biol Evol 20 : 1231–1239.
43. BustamanteCD, NielsenR, HartlDL (2003) Maximum likelihood and Bayesian methods for estimating the distribution of selective effects among classes of mutations using DNA polymorphism data. Theor Popul Biol 63 : 91–103.
44. Eyre-WalkerA, KeightleyPD (2007) The distribution of fitness effects of new mutations. Nat Rev Genet 8 : 610–618.
45. LoeweL, CharlesworthB (2007) Background selection in single genes may explain patterns of codon bias. Genetics 175 : 1381–1393.
46. KousathanasA, KeightleyPD (2013) A comparison of models to infer the distribution of fitness effects of new mutations. Genetics 193 : 1197–1208.
47. Haag-LiautardC, DorrisM, MasideX, MacaskillS, HalliganDL, et al. (2007) Direct estimation of per nucleotide and genomic deleterious mutation rates in Drosophila. Nature 445 : 82–85.
48. SchriderDR, HouleD, LynchM, HahnMW (2013) Rates and genomic consequences of spontaneous mutational events in Drosophila melanogaster. Genetics 194 : 937–954.
49. KeightleyPD, TrivediU, ThomsonM, OliverF, KumarS, et al. (2009) Analysis of the genome sequences of three Drosophila melanogaster spontaneous mutation accumulation lines. Genome Res 19 : 1195–1201.
50. KeightleyPD, NessRW, HalliganDL, HaddrillPR (2014) Estimation of the spontaneous mutation rate per nucleotide site in a Drosophila melanogaster full-sib family. Genetics 196 : 313–320.
51. MontgomeryEA, LangleyCH (1983) Transposable elements in mendelian populations. II. Distribution of three COPIA-like elements in a natural population of Drosophila melanogaster. Genetics 104 : 473–483.
52. KaplanN, DardenT, LangleyCH (1985) Evolution and extinction of transposable elements in Mendelian populations. Genetics 109 : 459–480.
53. CharlesworthB, LangleyCH (1989) The population genetics of Drosophila transposable elements. Annu Rev Genet 23 : 251–287.
54. CharlesworthB, LapidA, CanadaD (1992) The distribution of transposable elements within and between chromosomes in a population of Drosophila melanogaster. I. Element frequencies and distribution. Genet Res 60 : 103–114.
55. NuzhdinSV, MackayTF (1995) The genomic rate of transposable element movement in Drosophila melanogaster. Mol Biol Evol 12 : 180–181.
56. SacktonTB, KulathinalRJ, BergmanCM, QuinlanAR, DopmanEB, et al. (2009) Population genomic inferences from sparse high-throughput sequencing of two populations of Drosophila melanogaster. Genome Biol Evol 1 : 449–465.
57. LeeYC, LangleyCH (2010) Transposable elements in natural populations of Drosophila melanogaster. Philos Trans R Soc Lond B Biol Sci 365 : 1219–1228.
58. PetrovDA, Fiston-LavierAS, LipatovM, LenkovK, GonzalezJ (2011) Population genomics of transposable elements in Drosophila melanogaster. Mol Biol Evol 28 : 1633–1644.
59. KoflerR, BetancourtAJ, SchlottererC (2012) Sequencing of pooled DNA samples (Pool-Seq) uncovers complex dynamics of transposable element insertions in Drosophila melanogaster. PLoS Genet 8: e1002487.
60. CridlandJM, MacdonaldSJ, LongAD, ThorntonKR (2013) Abundance and distribution of transposable elements in two Drosophila QTL mapping resources. Mol Biol Evol 30 : 2311–2327.
61. VicosoB, CharlesworthB (2009) Recombination rates may affect the ratio of X to autosomal noncoding polymorphism in African populations of Drosophila melanogaster. Genetics 181 : 1699–1701; author reply 1703.
62. PoolJE, Corbett-DetigRB, SuginoRP, StevensKA, CardenoCM, et al. (2012) Population genomics of sub-saharan Drosophila melanogaster: African diversity and non-African admixture. PLoS Genet 8: e1003080.
63. KaplanNL, HudsonRR, LangleyCH (1989) The “hitchhiking effect” revisited. Genetics 123 : 887–899.
64. KolaczkowskiB, KernAD, HollowayAK, BegunDJ (2011) Genomic differentiation between temperate and tropical Australian populations of Drosophila melanogaster. Genetics 187 : 245–260.
65. PasyukovaEG, VieiraC, MackayTF (2000) Deficiency mapping of quantitative trait loci affecting longevity in Drosophila melanogaster. Genetics 156 : 1129–1146.
66. De LucaM, RoshinaNV, Geiger-ThornsberryGL, LymanRF, PasyukovaEG, et al. (2003) Dopa decarboxylase (Ddc) affects variation in Drosophila longevity. Nat Genet 34 : 429–433.
67. NuzhdinSV, KhazaeliAA, CurtsingerJW (2005) Survival analysis of life span quantitative trait loci in Drosophila melanogaster. Genetics 170 : 719–731.
68. CirulliET, KlimanRM, NoorMAF (2007) Fine-scale crossover rate heterogeneity in Drosophila pseudoobscura. J Mol Evol 64 : 129–135.
69. TajimaF (1989) Statistical method for testing the neutral mutation hypothesis by DNA polymorphism. Genetics 123 : 585–595.
70. FelsensteinJ (1974) The evolutionary advantage of recombination. Genetics 78 : 737–756.
71. KlimanRM, HeyJ (1993) Reduced natural selection associated with low recombination in Drosophila melanogaster. Mol Biol Evol 10 : 1239–1258.
72. McVeanGA, CharlesworthB (2000) The effects of Hill-Robertson interference between weakly selected mutations on patterns of molecular evolution and variation. Genetics 155 : 929–944.
73. ComeronJM, KreitmanM (2002) Population, evolutionary and genomic consequences of interference selection. Genetics 161 : 389–410.
74. HeyJ, KlimanRM (2002) Interactions between natural selection, recombination and gene density in the genes of Drosophila. Genetics 160 : 595.
75. ComeronJM, WillifordA, KlimanRM (2008) The Hill-Robertson effect: evolutionary consequences of weak selection and linkage in finite populations. Heredity (Edinb) 100 : 19–31.
76. WillifordA, ComeronJM (2010) Local effects of limited recombination: historical perspective and consequences for population estimates of adaptive evolution. J Hered 101(Suppl 1): S127–134.
77. HaddrillPR, HalliganDL, TomarasD, CharlesworthB (2007) Reduced efficacy of selection in regions of the Drosophila genome that lack crossing over. Genome Biol 8: R18.
78. CamposJL, CharlesworthB, HaddrillPR (2012) Molecular evolution in nonrecombining regions of the Drosophila melanogaster genome. Genome Biol Evol 4 : 278–288.
79. PresgravesDC (2005) Recombination enhances protein adaptation in Drosophila melanogaster. Current Biology 15 : 1651–1656.
80. BetancourtAJ, PresgravesDC (2002) Linkage limits the power of natural selection in Drosophila. Proceedings of the National Academy of Sciences, USA 99 : 13616–13620.
81. ZhangZ, ParschJ (2005) Positive correlation between evolutionary rate and recombination rate in Drosophila genes with male-biased expression. Mol Biol Evol 22 : 1945–1947.
82. MaraisG, Domazet-LosoT, TautzD, CharlesworthB (2004) Correlated evolution of synonymous and nonsynonymous sites in Drosophila. Journal of Molecular Evolution 59 : 771–779.
83. ComeronJM, KreitmanM, AguadeM (1999) Natural selection on synonymous sites is correlated with gene length and recombination in Drosophila. Genetics 151 : 239–249.
84. LarracuenteAM, SacktonTB, GreenbergAJ, WongA, SinghND, et al. (2008) Evolution of protein-coding genes in Drosophila. Trends Genet 24 : 114–123.
85. BetancourtAJ, WelchJJ, CharlesworthB (2009) Reduced effectiveness of selection caused by a lack of recombination. Current Biology 19 : 655–660.
86. TamuraK, SubramanianS, KumarS (2004) Temporal patterns of fruit fly (Drosophila) evolution revealed by mutation clocks. Mol Biol Evol 21 : 36–44.
87. TrueJR, MercerJM, LaurieCC (1996) Differences in crossover frequency and distribution among three sibling species of Drosophila. Genetics 142 : 507–523.
88. McGaughSE, HeilCS, Manzano-WinklerB, LoeweL, GoldsteinS, et al. (2012) Recombination modulates how selection affects linked sites in Drosophila. PLoS Biol 10: e1001422.
89. SmukowskiCS, NoorMA (2011) Recombination rate variation in closely related species. Heredity (Edinb) 107 : 496–508.
90. FayJC, WyckoffGJ, WuCI (2002) Testing the neutral theory of molecular evolution with genomic data from Drosophila. Nature 415 : 1024–1026.
91. Eyre-WalkerA, KeightleyPD (2009) Estimating the rate of adaptive molecular evolution in the presence of slightly deleterious mutations and population size change. Mol Biol Evol 26 : 2097–2108.
92. SmithNG, Eyre-WalkerA (2002) Adaptive protein evolution in Drosophila. Nature 415 : 1022–1024.
93. WrightS (1938) Size of population and breeding structure in relation to evolution. Science 87 : 430–431.
94. MesserPW (2013) SLiM: simulating evolution with selection and linkage. Genetics 194 : 1037–1039.
95. KeightleyPD, Eyre-WalkerA (2012) Estimating the rate of adaptive molecular evolution when the evolutionary divergence between species is small. J Mol Evol 74 : 61–68.
96. KaiserVB, CharlesworthB (2009) The effects of deleterious mutations on evolution in non-recombining genomes. Trends Genet 25 : 9–12.
97. SegerJ, SmithWA, PerryJJ, HunnJ, KaliszewskaZA, et al. (2010) Gene genealogies strongly distorted by weakly interfering mutations in constant environments. Genetics 184 : 529–545.
98. FuYX (1997) Statistical tests of neutrality of mutations against population growth, hitchhiking and background selection. Genetics 147 : 915–925.
99. GordoI, NavarroA, CharlesworthB (2002) Muller's ratchet and the pattern of variation at a neutral locus. Genetics 161 : 835–848.
100. CharlesworthD, CharlesworthB, MorganMT (1995) The pattern of neutral molecular variation under the background selection model. Genetics 141 : 1619–1632.
101. FayJC, WuCI (1999) A human population bottleneck can account for the discordance between patterns of mitochondrial versus nuclear DNA variation. Mol Biol Evol 16 : 1003–1005.
102. WalczakAM, NicolaisenLE, PlotkinJB, DesaiMM (2012) The structure of genealogies in the presence of purifying selection: a fitness-class coalescent. Genetics 190 : 753–779.
103. HermissonJ, PenningsPS (2005) Soft sweeps: molecular population genetics of adaptation from standing genetic variation. Genetics 169 : 2335–2352.
104. MesserPW, PetrovDA (2013) Population genomics of rapid adaptation by soft selective sweeps. Trends Ecol Evol 28 : 659–669.
105. LeeYC, LangleyCH, BegunDJ (2014) Differential strengths of positive selection revealed by hitchhiking effects at small physical scales in Drosophila melanogaster. Mol Biol Evol 31 : 804–816.
106. SattathS, ElyashivE, KolodnyO, RinottY, SellaG (2011) Pervasive adaptive protein evolution apparent in diversity patterns around amino acid substitutions in Drosophila simulans. PLoS Genet 7: e1001302.
107. CharlesworthD (2006) Balancing selection and its effects on sequences in nearby genome regions. PLoS Genet 2: e64.
108. HedrickPW (2006) Genetic polymorphism in heterogeneous environments: The age of genomics. Annual Review of Ecology, Evolution, and Systematics 37 : 67–93.
109. TurelliM, SchemskeDW, BierzychudekP (2001) Stable two-allele polymorphisms maintained by fluctuating fitnesses and seed banks: protecting the blues in Linanthus parryae. Evolution 55 : 1283–1298.
110. TurnerTL, LevineMT, EckertML, BegunDJ (2008) Genomic analysis of adaptive differentiation in Drosophila melanogaster. Genetics 179 : 455–473.
111. FabianDK, KapunM, NolteV, KoflerR, SchmidtPS, et al. (2012) Genome-wide patterns of latitudinal differentiation among populations of Drosophila melanogaster from North America. Mol Ecol 21 : 4748–4769.
112. CamposJL, ZengK, ParkerDJ, CharlesworthB, HaddrillPR (2013) Codon usage bias and effective population sizes on the X chromosome versus the autosomes in Drosophila melanogaster. Mol Biol Evol 30 : 811–823.
113. HershbergR, PetrovDA (2008) Selection on codon bias. Annu Rev Genet 42 : 287–299.
114. SinghND, DavisJC, PetrovDA (2005) X-linked genes evolve higher codon bias in Drosophila and Caenorhabditis. Genetics 171 : 145–155.
115. SinghND, LarracuenteAM, ClarkAG (2008) Contrasting the efficacy of selection on the X and autosomes in Drosophila. Mol Biol Evol 25 : 454–467.
116. HuTT, EisenMB, ThorntonKR, AndolfattoP (2013) A second-generation assembly of the Drosophila simulans genome provides new insights into patterns of lineage-specific divergence. Genome Res 23 : 89–98.
117. BetancourtAJ, KimY, OrrHA (2004) A pseudohitchhiking model of X vs. autosomal diversity. Genetics 168 : 2261–2269.
118. CharlesworthB, CoyneJA, BartonNH (1987) The relative rates of evolution of sex chromosomes and autosomes. American Nat 130 : 113–146.
119. AndolfattoP, WongKM, BachtrogD (2011) Effective population size and the efficacy of selection on the X chromosomes of two closely related Drosophila species. Genome Biol Evol 3 : 114–128.
120. BainesJF, SawyerSA, HartlDL, ParschJ (2008) Effects of X-linkage and sex-biased gene expression on the rate of adaptive protein evolution in Drosophila. Mol Biol Evol 25 : 1639–1650.
121. KeightleyPD, Eyre-WalkerA (2007) Joint inference of the distribution of fitness effects of deleterious mutations and population demography based on nucleotide polymorphism frequencies. Genetics 177 : 2251–2261.
122. LlopartA (2012) The rapid evolution of X-linked male-biased gene expression and the large-X effect in Drosophila yakuba, D. santomea, and their hybrids. Mol Biol Evol 29 : 3873–3886.
123. MeiselRP, MaloneJH, ClarkAG (2012) Faster-X evolution of gene expression in Drosophila. PLoS Genet 8: e1003013.
124. CallahanB, NeherRA, BachtrogD, AndolfattoP, ShraimanBI (2011) Correlated evolution of nearby residues in Drosophilid proteins. PLoS Genet 7: e1001315.
125. SinghND, ArndtPF, ClarkAG, AquadroCF (2009) Strong evidence for lineage and sequence specificity of substitution rates and patterns in Drosophila. Mol Biol Evol 26 : 1591–1605.
126. Eyre-WalkerA (2002) Changing effective population size and the McDonald-Kreitman test. Genetics 162 : 2017–2024.
127. LoeweL, CharlesworthB (2006) Inferring the distribution of mutational effects on fitness in Drosophila. Biol Lett 2 : 426–430.
128. BoykoAR, WilliamsonSH, IndapAR, DegenhardtJD, HernandezRD, et al. (2008) Assessing the evolutionary impact of amino acid mutations in the human genome. PLoS Genet 4: e1000083.
129. MacdonaldSJ, LongAD (2007) Joint estimates of quantitative trait locus effect and frequency using synthetic recombinant populations of Drosophila melanogaster. Genetics 176 : 1261–1281.
130. NordborgM, CharlesworthB, CharlesworthD (1996) The effect of recombination on background selection. Genetical Research 67 : 159–174.
131. LangleyCH, LazzaroBP, PhillipsW, HeikkinenE, BravermanJM (2000) Linkage disequilibria and the site frequency spectra in the su(s) and su(w(a)) regions of the Drosophila melanogaster X chromosome. Genetics 156 : 1837–1852.
132. AndolfattoP, NordborgM (1998) The effect of gene conversion on intralocus associations. Genetics 148 : 1397–1399.
133. Lindsley DL, Zimm GG (1992) The genome of Drosophila melanogaster. San Diego, CA: Academic Press.
134. PoolJE, AquadroCF (2006) History and structure of sub-Saharan populations of Drosophila melanogaster. Genetics 174 : 915–929.
135. SchaefferSW (2002) Molecular population genetics of sequence length diversity in the Adh region of Drosophila pseudoobscura. Genet Res 80 : 163–175.
136. MackayTF, RichardsS, StoneEA, BarbadillaA, AyrolesJF, et al. (2012) The Drosophila melanogaster Genetic Reference Panel. Nature 482 : 173–178.
137. YangZ (2007) PAML 4: phylogenetic analysis by maximum likelihood. Mol Biol Evol 24 : 1586–1591.
138. YangZ (1997) PAML: a program package for phylogenetic analysis by maximum likelihood. Comput Appl Biosci 13 : 555–556.
139. WongWS, YangZ, GoldmanN, NielsenR (2004) Accuracy and power of statistical methods for detecting adaptive evolution in protein coding sequences and for identifying positively selected sites. Genetics 168 : 1041–1051.
140. YangZ, WongWS, NielsenR (2005) Bayes empirical bayes inference of amino acid sites under positive selection. Mol Biol Evol 22 : 1107–1118.
Štítky
Genetika Reprodukční medicínaČlánek vyšel v časopise
PLOS Genetics
2014 Číslo 6
Nejčtenější v tomto čísle
- Early Back-to-Africa Migration into the Horn of Africa
- PINK1-Mediated Phosphorylation of Parkin Boosts Parkin Activity in
- OsHUS1 Facilitates Accurate Meiotic Recombination in Rice
- Ancient DNA Analysis of 8000 B.C. Near Eastern Farmers Supports an Early Neolithic Pioneer Maritime Colonization of Mainland Europe through Cyprus and the Aegean Islands