
The Multi-allelic Genetic Architecture of a Variance-Heterogeneity Locus for Molybdenum Concentration in Leaves Acts as a Source of Unexplained Additive Genetic Variance
Most biological traits vary in natural populations, and understanding the genetic basis of this variation remains an important challenge. Genome-wide association (GWA) studies have emerged as a powerful tool to address this challenge by dissecting the genetic architecture of trait variation into the contribution of individual genes. This contribution has traditionally been measured as the difference in the phenotypic means between groups of individuals with alternative genotypes at one, or multiple loci. However, instead of altering the trait mean, certain loci alter the variability of the trait. Here, we describe the genetic dissection of one such variance-controlling locus that drives variation in leaf molybdenum concentrations amongst natural accessions of Arabidopsis thaliana. The variance-controlling locus was found to result from the contributions of multiple alleles at multiple loci that are closely linked on the chromosome and is a major contributor to the “missing heritability” for this trait identified in previous studies. This illustrates that multi-allelic genetic architectures can hide large amounts of additive genetic variation, and that it is possible to uncover this hidden variation using the appropriate experimental designs and statistical methods described here.
Published in the journal:
. PLoS Genet 11(11): e32767. doi:10.1371/journal.pgen.1005648
Category:
Research Article
doi:
https://doi.org/10.1371/journal.pgen.1005648
Summary
Most biological traits vary in natural populations, and understanding the genetic basis of this variation remains an important challenge. Genome-wide association (GWA) studies have emerged as a powerful tool to address this challenge by dissecting the genetic architecture of trait variation into the contribution of individual genes. This contribution has traditionally been measured as the difference in the phenotypic means between groups of individuals with alternative genotypes at one, or multiple loci. However, instead of altering the trait mean, certain loci alter the variability of the trait. Here, we describe the genetic dissection of one such variance-controlling locus that drives variation in leaf molybdenum concentrations amongst natural accessions of Arabidopsis thaliana. The variance-controlling locus was found to result from the contributions of multiple alleles at multiple loci that are closely linked on the chromosome and is a major contributor to the “missing heritability” for this trait identified in previous studies. This illustrates that multi-allelic genetic architectures can hide large amounts of additive genetic variation, and that it is possible to uncover this hidden variation using the appropriate experimental designs and statistical methods described here.
Introduction
Genome Wide Association (GWA) analysis is a powerful approach to study the genetic basis of complex traits in natural populations. It is widely used to study the genetics of human disease, but is equally useful in studies of other populations. For example, it has been used to dissect the genetics of traits of importance in agricultural applications (see e.g. [1] for an example in cattle) and ecological adaptation using collections of natural accessions in the genetic model plant Arabidopsis thaliana, for example [2–7].
The standard GWA approach screens the genome for loci where the alternative genotypes differ significantly in the mean for the trait or traits of interest. Although hundreds of loci have been found to affect a variety of quantitative traits using this strategy, it has become clear that for most complex traits this additive approach fails to uncover much of the genetics contributing to the phenotypic variation in the populations under study. It is therefore important to explore the genetics of such traits beyond additivity [8]. An alternative way that genetic variation can contribute to the phenotypic variability in a population is via direct genetic control of the variance [9]. To identify an individual locus that makes such direct contributions to the trait variance, a statistical test is used to identify significant differences in the phenotypic variance between the groups of individuals that carry alternative alleles at the locus. When such a variance difference exists between the genotypes at a locus, the locus displays a genetic variance-heterogeneity. These loci are therefore often referred to as variance-heterogeneity loci (or vQTL for short [10]). By performing genome-wide analyses to identify such variance-heterogeneity loci, novel trait associations and alternative genetic mechanisms involved in shaping the total phenotypic variance in the analyzed populations can be identified [8,10].
The direct genetic control of the phenotypic variance is a topic that has been studied for many years in quantitative genetics with a primary focus on its potential contributions to adaptation in natural populations and agricultural selection programs. Theoretical and empirical work has increased our understanding of how individual loci that display variance, rather than mean, differences between genotypes might cause phenomena such as fluctuating asymmetry, canalization and genetic robustness [9,11]. Empirical work now also supports the general principle that a direct genetic control of the variance is an inherent feature of biological networks and individual genes (see [12] for a review) and that it contributes to both capacitation [13,14] and maintenance of developmental homeostasis [15]. Although it was already shown in the 1980s that it was possible to map vQTL [16], this approach has only recently been more widely adopted to explore the role of variance-heterogeneity loci in, for example, environmental plasticity [15], canalization [17], developmental stability [18], and natural variation in stochastic noise [19].
With the advent of GWA analysis, and the later realization that standard additive models leave much of the genetic variance in the analyzed populations uncovered [8], there has been an increased interest in exploring the contribution of genetic variance-heterogeneity to the phenotypic variability in complex traits [10,20]. Several recent studies in, for example, humans [21], plants [7,19,22], Drosophilia melanogaster [23] and yeast [24] have shown that part of this previously unexplored heritable genetic variation, beyond the narrow-sense heritability, can be uncovered by re-analyzing existing GWA datasets using methods to detect differences in trait variance (variance-heterogeneity GWA or vGWA for short) between genotypes [20–22].
Previously, we re-analyzed ionomic data from a GWA study based on 93 wild-collected A. thaliana accessions [2] and detected a variance-heterogeneity locus with a genome-wide significant difference for the variance in leaf molybdenum concentrations between the genotypes. This association was found near the MOT1 (Molybdate transporter 1) gene [22]. Importantly, this locus did not affect the mean leaf molybdenum concentrations in this dataset [2,22]. Molybdenum is an essential element for plant growth due to its role as a part of the molybdopterin cofactor that is required by several critical enzymes [25]. Both deficiency and excess of molybdenum have an impact on plant development [26]. The ability of plants to acquire minerals from the soil, and regulate their levels in the plant, depends on complex biochemical and regulatory pathways. The genetic architecture of such ionomics traits is thus complex [27]. To date, several studies in A. thaliana have exploited natural variation and QTL analysis to examine mineral content [28–34], and important insights have been gained into the underlying biological mechanisms by dissecting the molecular determinants for nine of these QTL. These include QTL for the accumulation of Co, Mo, Na, Cd, As, S/Se, Zn, Cu and sulfate [5,6,35–42]. Further, GWA analysis has also been used to identify both candidate loci and functional polymorphisms contributing to natural variation in these ionomics traits [2,3,5,6,43].
Here, we quantified molybdenum concentrations in leaves in a larger collection of 340 natural A. thaliana accessions to replicate and dissect the genetic architecture of the previously detected variance-heterogeneity locus around the MOT1 gene [22]. We uncovered that a complex multi-locus, multi-allelic genetic architecture leads to the genetic variance-heterogeneity at this locus. Several polymorphisms in three closely linked loci were significantly associated with the mean molybdenum concentration in the leaf, and due to an extended LD between the minor alleles at these loci, their joint effects cause the genetic variance-heterogeneity at this locus. By dissecting this variance-heterogeneity locus in detail, we both reveal the genetic complexity of an adaptive locus for molybdenum homeostasis in A. thaliana [37] and uncover a significant amount of novel additive genetic variance that otherwise would remain undetected and contribute to the “missing heritability”.
Results
An increased population-size reveals novel loci associated with molybdenum concentrations in A. thaliana leaves
The first GWA analysis searching for genetic effects on mean leaf molybdenum concentrations [2] did not uncover any genome-wide significant associations for this trait. This was surprising as it was known from earlier QTL studies that a strong polymorphism affecting this trait was segregating in the analyzed population [36]. To investigate this further we measured the molybdenum concentration in leaves from at least six replicate plants of 340 natural A. thaliana accessions (S1 Table) that had earlier been genotyped using the 250k A. thaliana SNP-chip [3]. 58 of the accessions used in this study overlapped with those in the previous study [2,22]. In this larger dataset, we detected several SNPs associated with the mean leaf molybdenum concentrations in, or near, the MOT1 locus (Fig 1). The minor alleles for some associated SNPs increased the mean phenotype, whereas others decreased it relative to the major allele (Table 1; Fig 1B). In our earlier study we identified a genome-wide significant genetic variance-heterogeneity for leaf molybdenum concentrations at this same locus containing MOT1 [22]. Here, we therefore aim to functionally dissect this region further to obtain a deeper understanding of the genetic mechanisms controlling the range of leaf molybdenum concentrations observed in A. thaliana [36].


Dissecting the genetic structure of a variance-heterogeneity locus affecting molybdenum concentrations in A. thaliana leaves
A vGWA analysis of leaf molybdenum concentrations in the 340 accessions, searching for genetic effects on the between accession variance heterogeneity (S1 Text), revealed several SNP markers that displayed a genome-wide significant genetic variance-hetereogeneity in the region of the reported vQTL near the MOT1 gene [22]. The associations were particularly strong (Fig 1A) for a number of SNPs in high LD on chromosome 2 (Fig 1B; vBLOCK). By visualizing the genotypes for the analyzed accessions across vBLOCK, we observed that the population contains two distinct multi-locus genotype classes for this segment: one that predominantly contains high-variance associated SNP alleles (vBLOCKhv) and another with low-variance associated SNP alleles (vBLOCKlv; Fig 1C). vBLOCK contains in total 20 annotated genes, and the most obvious functional candidate for the association is MOT1 (10,933,061–10,934,551).
Multiple structural MOT1 promoter-polymorphisms are associated with molybdenum concentrations in A. thaliana leaves
MOT1 is an obvious functional candidate gene for the genetic variance-heterogeneity for vBLOCK. A 53 bp deletion in the promoter-region of this gene has earlier been shown to decrease MOT1 expression, leading to low concentrations of molybdenum in the plant [36,44]. To complement our SNP-marker dataset with this known, and other potentially functional, structural promoter polymorphisms segregating in the analyzed population, we screened the promoter region of MOT1 using PCR fragment size differentiation (see Methods for details) and identified in total six non-coding structural polymorphisms (Fig 2, S1 Table). These were then genotyped in 283 of the 340 phenotyped accessions.

Two of the six segregating MOT1 promoter polymorphisms were significantly associated with mean leaf molybdenum concentration. The first was DEL53 which is located 13 bp upstream from the transcription start-site of MOT1. Baxter et al. [36] earlier showed that this 53 bp deletion (DEL53) allele lacks the TATA-box in the MOT1 promoter, which leads to a reduced expression of MOT1 and decreased molybdenum concentration in the leaf. We confirm that this allele decreased the mean molybdenum concentrations in the leaf also in this dataset (Table 1; pnominal = 4.2x10⁻¹⁶; Fig 2A) and found the DEL53 allele only among low molybdenum accessions (Mo < 3 μg g-1 dry weight). We also found a strong association (pnominal = 5.0x10⁻¹¹; Table 1; Fig 2A) to a locus (DUP) located 263 bp upstream from the translation start site. Here, several accessions share a 330bp long duplication (Fig 2B) located inside a transposable element (AT2TE47050). The duplication exists in two distinct variants (alleles) differing by four polymorphisms: three point-mutations and one 4bp insertion (DUP326 and DUP322 in Fig 2B). In our dataset, the DUP326 allele altered leaf molybdenum concentrations and it was found only among accessions with high leaf molybdenum concentrations (Mo > 10 μg g-1 dry weight). To our knowledge, this duplication has not previously been described in the literature. Using qRT-PCR, we tested the MOT1 expression in 5 accessions carrying the low-molybdenum DEL53 allele and found that 4 of these have significantly lower expression than Col-0 in the root (95% CI 0.2–0.6 fold; 2.5 × 10⁻¹⁵ < p < 2.5 × 10⁻³ from Fishers method combining p-values for the biological replicates; S3 Table). Using the same assay, we tested 6 accessions carrying the high-molybdenum DUP326 allele. All these accessions had higher (95% CI 2.2–7.8 fold; 2.5 × 10⁻²³ < p < 2.2 × 10⁻³ from Fishers method combining p-values for the biological replicates; S3 Table) MOT1 expression than Col-0 in the root. Although these results do not provide direct functional evidence that the DUP326 allele increases the molybdenum concentration in the leaves via an increased expression of MOT1 in the roots, it suggests this as a plausible mechanism worth further explorations. Together, our results provide further evidence that allelic heterogeneity at MOT1 is an important component of the genetic architecture of natural variation in leaf molybdenum concentrations.
A multi-locus analysis confirms that a multi-locus, multi-allelic genetic architecture determines the molybdenum concentrations in plants from the global A. thaliana population
Multiple associations to loci with either mean - or variance differences between genotypes for leaf molybdenum concentrations were uncovered in the single-locus GWA and vGWA analyses. To confirm the independence of these effects, and evaluate their joint contributions to leaf molybdenum, we fitted all markers (SNPs and structural variants) on chromosome 2 in a generalized linear model to the mean leaf molybdenum concentration using the LASSO method [45]. This penalized maximum likelihood regresses the effects of polymorphisms that make no, or only a minor, independent contribution to the trait towards zero and highlights the markers that jointly make the largest contribution to the trait variation. The penalty in the analyses was chosen so that all highlighted polymorphisms in the final model also have a genome-wide significant effect in the earlier GWA or vGWA analyses (S1 Fig; see Methods section for details). In this way, the LASSO method picks up the genome-wide significant polymorphisms that have independent effects on the trait.
The MOT1 promoter polymorphisms DEL and DUP were the most strongly associated loci in the LASSO analysis. Two additional SNP markers, one located ~25 kb downstream (rs347469902; 10,909,091 bp; SNP1; Table 1) and one ~600 kb upstream of MOT1 (rs347287517; 11,528,777 bp; SNP2; Table 1), were also highlighted. The minor alleles at SNP1 and SNP2 (SNP1+ and SNP2+) were both enriched among accessions with high leaf molybdenum concentrations. The minor alleles at three of the four associated loci thus increased the mean leaf molybdenum concentrations (Table 1; DUP326, SNP1+, and SNP2+), and one decreased it (Table 1; DEL53).
A multi-locus genetic architecture contributes to the range of molybdenum concentrations in wild collected A. thaliana accessions
Under certain conditions, multi-allelic genetic architectures can lead to a genetic variance-heterogeneity in association-analyses based on bi-allelic SNPs (see e.g. [10]). For example, if a locus contain a SNP with two alleles, SNPA and SNPB, where the major SNP allele is completely linked to the major allele at gene M regulating trait T (i.e. only the SNPA-MWT haplotype exists in the population). If now locus M also contains two minor alleles, M- and M+, that decreases/increases T an equal amount relative to the value of MWT, and that are tagged by the SNPB allele, the SNPA and SNPB genotype-classes will have identical means, but different variances. Here, we will show that the genetic variance-heterogeneity we detected for vBLOCK is due to a multi-allelic genetic architecture that closely resembles this example.
An extended LD across three polymorphisms affecting mean molybdenum concentrations lead to a genetic variance-heterogeneity association in the vGWA analysis
There was a strong LD (D’) between three loci (SNP1, DEL and DUP) associated with the mean leaf molybdenum concentration and the SNPs across vBLOCK that displayed a highly significant genetic variance-heterogenity (Fig 2A; Table 2). All the 20 accessions carrying either the DEL53 or DUP326 alleles also carry the high-variance associated vBLOCKhv. Of the 29 accessions that carry the high molybdenum SNP1+ allele, 19 carried vBLOCKhv (Fig 1C; see Methods section for further detail). The minor alleles at two of these (DUP326, SNP1+) increased, and at one of them (DEL53) decreased, the leaf molybdenum concentration. This results in a situation similar to that in the example above: multiple alleles with different directional phenotypic effects are unevenly distributed across the two variants of vBLOCK. The fact that one variant (vBLOCKhv) tags three different minor alleles (DUP326, DEL53 and SNP1+) with different effects on the mean molybdenum concentration explains the increased phenotypic variance for this group of accessions.

To statistically disentangle the genetic effects on the mean and variance by this multi-allelic, multi-locus genetic architecture, an additional vGWA analysis was performed where we fitted a linear model with separate effects for the mean and variance to the data as outlined by Valdar and Rönnegård [10]. The three mean associated loci that were located within vBLOCK (DUP, DEL and SNP1) were fitted as loci with mean effects when screening chromosome 2 for loci with potential effects on the variance using this method. The entire variance signal to vBLOCK disappears in this analysis (Fig 3A) illustrating that the variance-heterogeneity association to vBLOCK is due to the presence of the DEL53, DUP326 and SNP1+ alleles on the high-variance associated vBLOCKhv (Fig 3C).

New additive genetic variation revealed by the dissection of a locus detected via its genetic variance-heterogeneity
We estimated the broad-sense heritability of leaf molybdenum concentrations from the within/between accession variances to be H2 = 0.80 using an ANOVA across all replicated measurements. This estimate is similar to that reported in earlier studies (0.56 [43] to 0.89 [2]). The narrow-sense heritability was estimated to be h2 > = 0.63 using a mixed model based analysis where the accession mean phenotypes were regressed onto the genomic kinship matrix.
The first GWA analysis for leaf molybdenum concentrations by Atwell et al. [2] was unable to detect any loci contributing to the variation in the trait mean. The later vGWA study by Shen et al. [22] identified a genetic variance-heterogeneity in the MOT1 region that explained 27% of the phenotypic variance where the contribution by mean (additive) and variance (non-additive) effects were 4/23% of the phenotypic variance, respectively. Using the variance decomposition proposed by Shen et al. [22], we estimate that the genetic variance-heterogeneity at vBLOCK contributes 3 and 19% to the phenotypic variance via its effect on the mean and the variance. The total amount of genetic variance associated with the vGWA signal here is thus comparable to that of Shen et al. [22], but in both studies it leaves much of the total additive genetic variance unexplained as it only accounts for about 5% of h2. The contribution to H2 is, however, larger and between 24 to 28% in these two studies.
However, after considering the individual contributions made by the three polymorphisms identified on vBLOCKhv (DEL53, DUP326, SNP1+; Fig 3), much additive genetic variance is uncovered. Nearly all the contribution from vBLOCK becomes additive (83% of the total variance) to explain 45% of h2 and 43% of H2. By also accounting for the fourth locus (SNP2; Fig 2), the contribution h2 and H2 increases further to 60 and 50%, respectively. By dissecting the genetic architecture of the vGWA signal into its underlying multi-locus, multi-allelic components, we were thus able to reveal a significant contribution by vBLOCK to the “missing heritability” of molybdenum concentration in the leaf in the original GWA [2] and vGWA [22] analyses.
Functional analyses of genes in LD with the loci affecting the mean molybdenum concentration in leaves
Here, we functionally explore the associations outside of the coding and regulatory regions of MOT1 in more detail to identify additional functional candidate polymorphisms and genes for the regulation of molybdenum homeostasis.
Mutational analyses to identify functional candidates contributing to variable leaf molybdenum concentrations in A. thaliana
Two regions outside of the coding and regulatory region of MOT1 (chromosome 2 10,933,061–10,935,200 bp) were associated with the mean leaf molybdenum concentrations (SNP1 and SNP2 in Figs 1B; 3A). Genes located in the chromosomal regions covered by SNPs in LD (r2 > 0.4) with SNP1 and SNP2, respectively, were explored as potential functional candidates for the associations using T-DNA insertion alleles (S4 Table).
Four T-DNA alleles of five different genes in the region around SNP1 (10,909,091 bp; S2 Fig; S4 Table) were evaluated for leaf molybdenum concentrations, but in none of these did the leaf molybdenum concentrations differ from that of the wild-type Col-0.
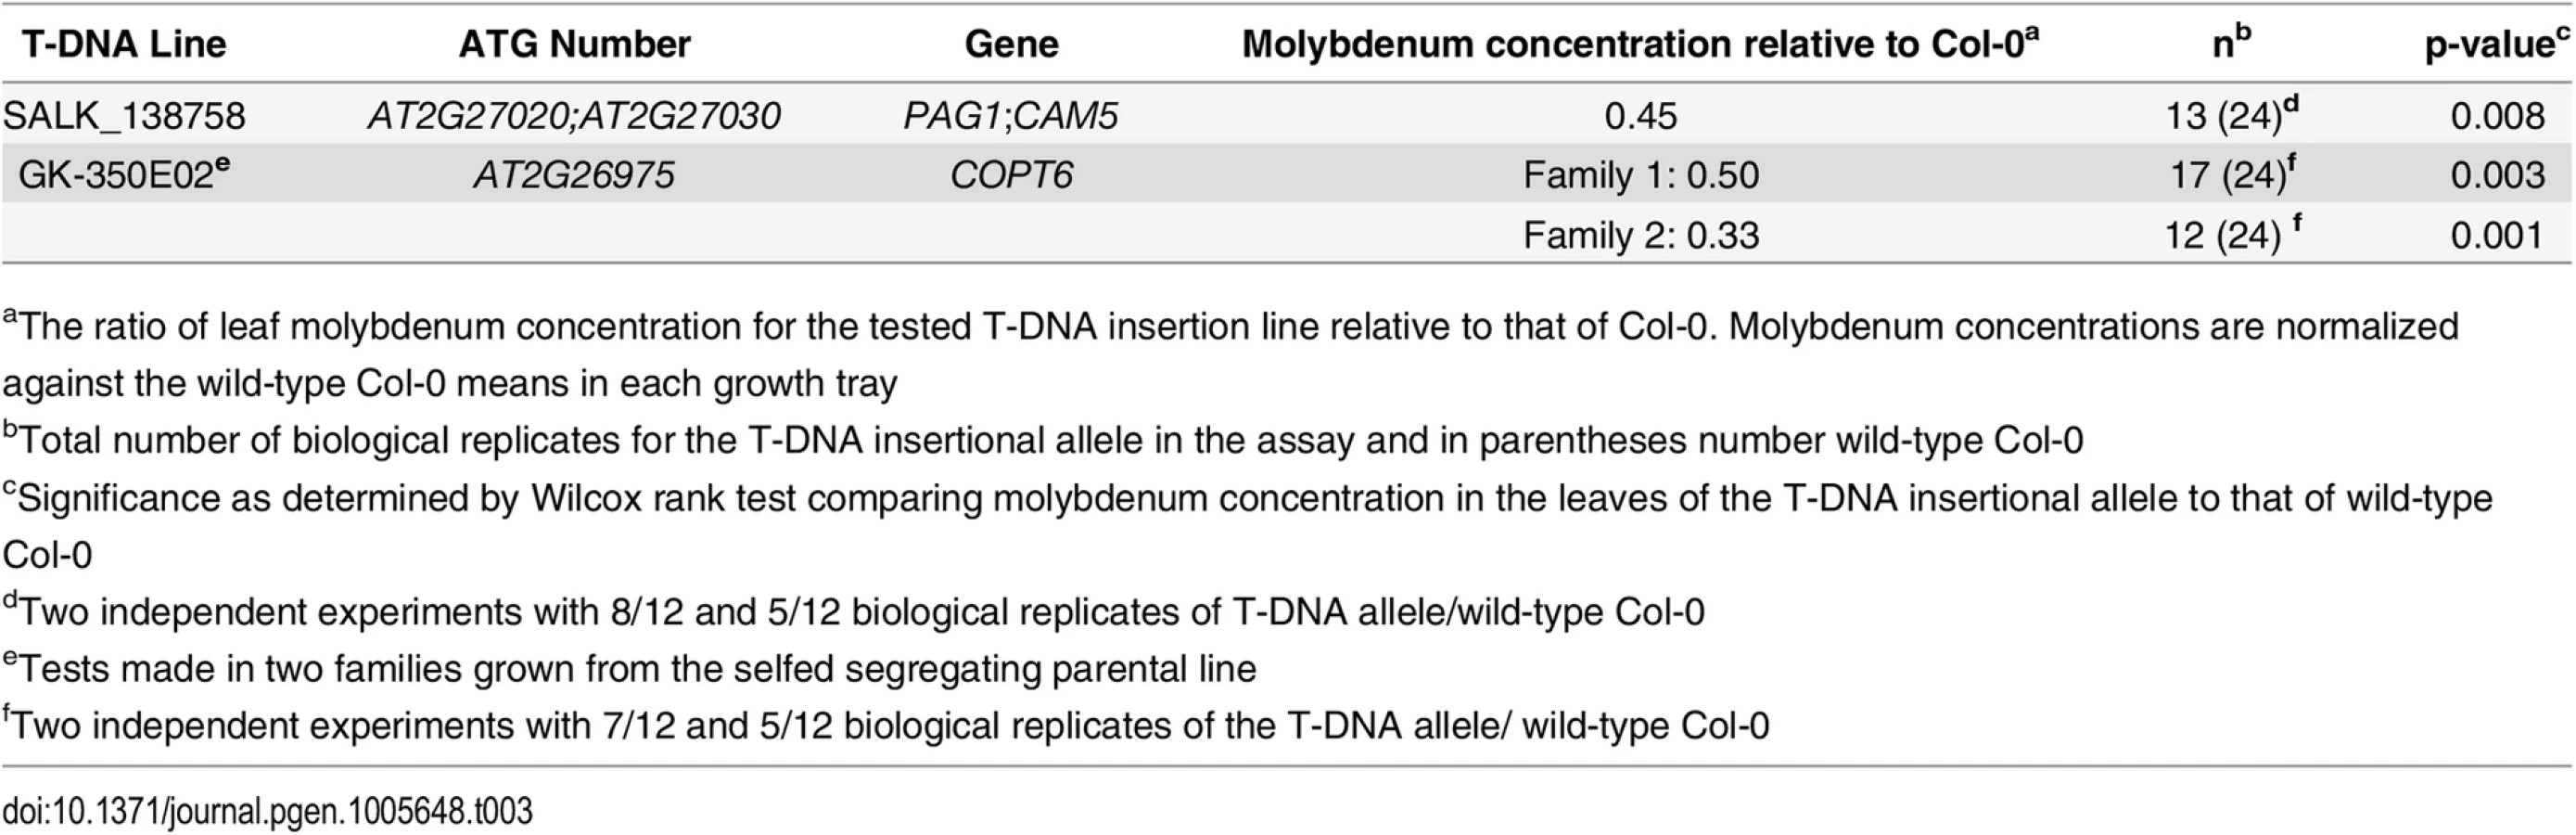
We also evaluated 19 mutants with T-DNA insertions in 14 genes around SNP2 (11,528,777 bp; Fig 4; S4 Table), and identified two with significantly altered leaf molybdenum concentrations compared to the wild-type Col-0 (Table 3). One (SALK_138758) has an insertion covering genes AT2G27020 and AT2G27030, and the other (GK-350E02) has an insertion in gene AT2G26975. These T-DNA alleles showed on average 55 and 58% reductions in leaf molybdenum concentrations compared to wild-type Col-0, respectively (Table 3). AT2G27020 was also evaluated via another T-DNA insertional allele (SAIL_760_D06), and this line had wild-type leaf molybdenum concentrations. Thus, AT2G27030 (ACAM2/CAM5; 11,532,004–11,534,333) appears to be the most likely functional candidate gene of the two. Calmodulin is a known metalloprotein and a Ca2+ sensor, but no previous connections to molybdenum has been reported. The reduced leaf molybdenum concentration of the T-DNA insertional allele of AT2G26975 (Copper Transporter 6; COPT6) makes this a second functional candidate locus for the association around SNP2. Interestingly, as well as low molybdenum, the T-DNA knockout allele of this gene has a slightly increased leaf copper concentration compared to wild-type (3.82 and 3.36 μg / g dry weight, respectively, in GK-350E02 and wild-type Col-0; p = 0.0018), suggesting a role of COPT6 also in the regulation of copper homeostasis. From the literature it is known that copper and molybdenum homeostasis are related and that copper depleted Brassica napus plants have up-regulated expression of both copper transporter genes and MOT1 [46].

Discussion
Common approaches to dissect the genetics of complex traits in segregating populations are linkage mapping and association studies. These studies aim to identify the loci in the genome where genetic polymorphisms control the phenotypic variance in the studied populations. This is achieved by screening for significant genotype-phenotype associations across a large number of genotyped polymorphic markers in the genome. The most common statistical models used in such analyses aim to identify loci with significant mean phenotype differences between the genotypes at individual loci. Although such models are powerful for capturing much genetic variance in populations, they have limited power when challenged with more complex genetic architectures including multiple-alleles, variance-heterogeneity and genetic interactions [8,47]. It is therefore important to also develop, and test, methods that explore statistical genetic models reaching beyond additivity when aiming for a more complete dissection of the genetic architecture of complex traits.
The genetic architecture of variation in mean leaf molybdenum concentrations has earlier been explored using GWA analyses in a smaller set of 93 wild collected A. thaliana accessions [2]. No genome-wide significant associations were found for leaf molybdenum, which was surprising given that the trait has a high heritability [36,43] and that several polymorphisms in MOT1 are known to contribute to natural variation in this trait [36,37]. When we re-analyzed this data using a method to detect variance differences between genotypes, a strong genetic variance-heterogeneity was identified near the MOT1 gene [22]. Here, we studied a larger set of 340 A. thaliana accessions to replicate and fine-map the molecular determinant of this genetic variance-heterogeneity, and find that the strongest associations are to an extended region surrounding MOT1 (vBLOCK). This is the first successful fine-mapping and replication of a variance-heterogeneity locus on a genome-wide significance scale and in an independent dataset.
In this larger dataset we also identified four loci that independently alter the mean concentration of leaf molybdenum. The minor allele at one of these (DEL53) was a deletion in the promoter region of MOT1 previously identified using an F2 bi-parental mapping population. This deletion allele decreases the concentration of molybdenum in leaves by down-regulating MOT1 transcription [36]. Further, we also identified three previously unknown loci, and the minor alleles at these loci (DUP326, SNP1+ and SNP2+) increased the concentration of molybdenum in leaves. One allele (DUP326) was an insertion polymorphism in the promoter region of MOT1, and our analyses revealed that accessions carrying this polymorphism have higher expression of MOT1 compared to the Col-0 accession that does not carry this polymorphism. The other two associations were to SNPs in regions that were not in LD (r2) with the MOT1 gene or its promoter. One of these SNPs was found ~25 kb downstream of MOT1 (SNP1) and the other ~600 kb upstream of the MOT1 transcription start-site (SNP2). The regulation of molybdenum concentrations in the leaves is hence due to multiple alleles in a gene known to regulate molybdenum uptake, MOT1, but also alleles at other neighboring loci that have earlier not been found to contribute to molybdenum homeostasis in A. thaliana. These results support and refine earlier results from QTL and functional analyses of the MOT1 region that highlighted the central importance of the MOT1 region in the regulation of molybdenum homeostasis in natural populations and also suggested that the natural variation in this trait might have a multi-allelic background [36,37]. As it is well known that major loci affecting traits under selection often evolve multiple mutations affecting the phenotype, and that allelic heterogeneity is an important driver of evolution in natural A. thaliana populations [48], our finding of multiple polymorphisms in this key locus is not surprising. Striking examples of allelic heterogeneity in natural A. thaliana populations include the large number of different loss-of-function mutants in the GA5 locus leading to semidwarfs [49], the MUM2 locus leading to altered seed flotation [50] and the FRIGIDA locus leading to an altered flowering-time [51].
Multi-allelic loci are, however, a major challenge in traditional GWA analyses [48]. It is therefore valuable to note that such loci, under certain conditions, can lead to a genetic variance-heterogeneity (see e.g. [10]) that can be detected with a vGWA analysis. The following two examples illustrate how genetic variance-heterogeneity can arise under i) classic allelic heterogeneity where multiple loss-of-function alleles have evolved independently at a locus, and ii) general multi-allelic architectures where the alleles affect the phenotype to various degree and hence either increase or decrease the phenotype relative to that of the major allele. To illustrate how a genetic variance-heterogeneity can emerge under these scenarios, let us consider an example when looking for associations to a bi-allelic SNP with alleles SNPA and SNPB and where the major SNP allele (SNPA) is completely linked to the major allele at the functional gene M (MWT). Below, we illustrate how the distribution of the minor alleles across the SNP genotypes will alter the differences in phenotypic mean and variances between the genotypes, and hence affect the power to detect them in GWA and vGWA analyses.
If gene M evolved via classic allelic heterogeneity, multiple loss-of-function alleles (M1-.Mn-) will exist in the population. The largest mean, and smallest variance, difference between the genotype-classes will occur when all n mutant alleles are linked to the SNPB allele. As the proportion of the n M- alleles linked to the SNPA allele increases, the mean difference between genotypes will decrease while the variance differences increase until it reaches its maximum when only one of the M- alleles is linked with the SNPB allele. In all these scenarios, however, there will be a difference both in the mean and variance between the SNP genotype classes and depending on the power of the study, the locus can be detected by either GWA, or vGWA analyses.
If locus M evolved multiple alleles with distinct effects on the phenotype, the locus might display everything from a complete lack of either mean - and variance-effects (scenario (a) below), to both mean and variance effects (b) or variance effects only (c). Under the simplest scenario with two minor alleles, M- and M+, that decreases/increases the trait value relative to that of MWT, respectively, it is the linkage between the alleles at M and the tested marker that determines the mean and variance differences between the genotypes observed at this locus as shown in the examples below.
If the M- and M+ alleles are evenly distributed across the two SNP genotypes, there will neither be a mean nor a variance difference between the genotypes.
If the SNP tags the M+ and M- alleles perfectly, i.e. that SNPA tags M+ and SNPB M- or vice versa, there will be both mean and variance differences between the genotypes.
If the SNPB allele tags both minor alleles perfectly, i.e. M+ and M- only occurs with SNPB, there will only be a difference in variance between the SNP genotype classes (S3 Fig).
Hence, the vGWA analysis is likely to be useful for identifying loci under a set of different scenarios ranging from classic allelic heterogeneity to loci with multiple alleles having distinct effects on the phenotype. As shown here, the genetic variance-heterogeneity for vBLOCK was detected based on its genetic variance-heterogeneity due to its close resemblance to scenario (c) above (Fig 2A).
Here, we dissected a locus displaying a genetic variance-heterogeneity for the molybdenum concentration in A. thaliana leaves into an underlying multi-locus, multi-allelic genetic architecture. We find several alleles at MOT1 that contribute to this association, which is consistent with findings in earlier studies reporting that several functional variants of this gene alter the mean molybdenum concentrations in A. thaliana [36,37]. Such multi-allelic architectures, where the different genetic variants affect traits under selection to varying degrees, are not unique to this study but have been described also for other traits and species. For example, in A. thaliana the Flowering Locus C (FLC) locus has a natural series of alleles with different effects on vernalization that have been identified [52]. Similar examples also exist in, for example, domestic animal populations for both Mendelian traits, such as coat color [53–55], and complex traits, such as muscularity [56] and meat quality [57]. As illustrated above, the vGWA analysis is a straight-forward and computationally tractable analytical strategy that could be used to identify loci where multi-allelic genetic architectures reduce the additive genetic variance that can be detected by traditional GWA approaches. The examples above suggest that such genetic architectures are likely to be more common than what has been empirically shown to date. We therefore recommend that the vGWA approach be tested on more datasets to reveal how common this type of architecture might be for complex traits. This will also help reveal how large a contribution such multi-allelic genetic architectures contribute to the “missing heritability”.
Little is currently known about the genetic mechanisms contributing to variance-heterogeneity between genotypes in natural populations. Ayroles et al. [23] recently reported the first dissection of a locus displaying a genetic variance-heterogeneity in a segregating population and found that mutating a single gene (Ten-a) led to a genetic variance-heterogeneity for a behavioral phenotype in Dropsophila melanogaster. A number of other, not mutually exclusive, hypotheses have been proposed to explain the origin of genetic variance-heterogeneity at a locus. These can broadly speaking be divided into two categories: those due to the individual locus itself such as multiple functional alleles, incomplete linkage disequilibrium and developmental instabilities [7,10,22], and those due to interactions between the locus and other genetic or environmental factors (i.e. epistasis or gene-by-environment interactions) [8,10,21]. Here, we present the first empirical evidence illustrating how population-wide genetic variance-heterogeneity in a natural population can result from a complex locus involving multiple loci and multiple alleles. We show that this genetic variance-heterogeneity originates from the LD (D’) between multiple functional polymorphisms and the SNP markers defining an LD block around MOT1 (vBLOCK). The high-variance associated version of this LD-block (vBLOCKhv) contains three independent polymorphisms (DEL53, DUP326 and SNP1+) altering the molybdenum concentration in leaves relative to the major alleles at these loci on the low-variance associated version (vBLOCKlv). Two of these polymorphisms increase molybdenum and one decrease it, leading to a highly significant genetically determined variance-heterogeneity amongst the accessions that share vBLOCKhv (Fig 2A; multi-allelic example c above). Our work also illustrates how the use of alternative genetic models in GWA analyses can provide novel insights to complex genetic architectures underlying adaptively important traits in natural populations.
The LD (D’) between multiple functional polymorphisms and vBLOCK in this collection of natural A. thaliana accessions is the key genomic feature that facilitated the discovery of this locus in the vGWA. Although the molecular basis for this LD-pattern, as well as the reasons for multiple independent polymorphisms being found almost exclusively with one of the variants of this LD-block, is unknown, it is interesting to note that they could have emerged via the processes discussed in relation with the appearance of synthetic LD in GWA studies [58]. It would therefore be interesting to, in the future, explore whether the same basic genomic processes might drive the emergence of both synthetic and vGWA associations in general, or whether the resemblance between the genetic architecture described here and the mechanism proposed by Dickson et al. [58] is a rare case of where the two overlap.
Many GWA studies have found that the total additive genetic variance of associated loci is considerably less than that predicted based on estimates of the narrow-sense heritability, i.e. the ratio between the additive genetic and phenotypic variance in the population. This common discrepancy between the two is often called the curse of the “missing heritability” and is viewed as a major problem in past and current GWA studies [59]. Here, we provide an empirical example of how a vGWA is able to identify a locus [22] that remained undetected in a standard GWA [2] and that, when the underlying genetic architecture was revealed, was found to make a large contribution to the additive genetic variance and narrow-sense heritability. This illustrates the importance of utilizing multiple statistical modeling approaches in GWA studies to detect the loci contributing to the phenotypic variability of the trait, and then also continue to further dissect the underlying genetic architecture to uncover how the loci potentially contribute to the heritability that was “missing” in the original study [2].
By evaluating T-DNA insertional alleles of genes in LD with the SNPs associated to leaf molybdenum concentrations, we are able to suggest two novel functional candidate genes involved in molybdenum homeostasis in A. thaliana. Little is known about the function of one of these, AT2G27030, and further work is needed to explore the mechanisms by which it may alter molybdenum concentrations in the plant. The second gene (AT2G26975; Copper Transporter 6; COPT6) located ~600 kb upstream of MOT1 is from earlier studies known to be involved in the connected regulation of copper and molybdenum homeostasis in plants. It was recently reported [46] that MOT1 and several copper transporters were up-regulated under copper deficiency in B. napus, suggesting a common regulatory mechanism for these groups of genes. Further experimental work is needed to explore the potential contributions of these genes to natural variation in molybdenum homeostasis, and the potential connection between copper and molybdenum homeostasis.
Here, we dissect a complex locus affecting molybdenum concentration in the A. thaliana leaf and find it likely that three closely linked genes contribute to this effect. Clustering of genes with similar function is well known for Resistance (R) genes [60] and close linkage between genes important for growth rate has also been evidenced [61] in A. thaliana. How common such functional clustering into complex loci will be for traits of importance for evolution is still largely unknown as the resolution in most complex trait studies does not allow the separation of effects from closely linked loci. Our finding that not only the already known gene in this region, MOT1, but likely also other novel genes contribute to the diverse range of molybdenum concentrations in the leaf observed in this collection of natural A. thaliana accessions suggest that the clustering of loci has been of adaptive value for this ecologically relevant trait. This makes the locus a highly interesting candidate for future work to better understand the role of gene clustering for the evolution of adapted populations.
In summary, here we dissect a locus displaying a genetic variance-heterogeneity for leaf molybdenum concentration in A. thaliana [22] into the contributions from three independent alleles that are in high LD with the high-variance associated version of an extended LD-block surrounding the MOT1 gene. This is the first empirical example of how a multi-locus, multi-allelic genetic architecture can lead to genetic variance heterogeneity at a locus. The dissection of the genetic architecture underlying the vGWA signal allowed the transformation of non-additive genetic variance into additive genetic variance, and hence allowed the detection of a significant part of the “missing heritability” in the variation in leaf molybdenum concentrations in this species-wide collection of A. thaliana accessions. This study also delivers insights into how vGWA mapping facilitates the detection and genetic dissection of the genetic architecture of loci contributing to complex traits in natural populations. It thereby illustrates the value of using alternative statistical methods in genome-wide analyses. Further, it provides an approach to infer multi-allelic loci, which are likely to be both a common, and far too often ignored, complexity in the genetics of multifactorial traits that contributes to undiscovered additive genetic variance and consequently the curse of the “missing heritability”.
Materials and Methods
Genotype and phenotype data
The concentration of molybdenum in leaves was measured in 340 natural A. thaliana accessions from the ‘HapMap’ collection ([3]; S1 Table). This dataset contains 58 of the 93 accessions used in the earlier GWA [2] and vGWA [22] analyses of leaf molybdenum concentrations supplemented with 282 newly phenotyped accessions. All accessions were grown in a controlled environment with 6 biological replicate plants per accession, and analyzed by Inductively Coupled Mass Spectroscopy (ICP-MS) for multiple elements including molybdenum, as described previously by Baxter et al. [3]. All the ICP-MS data used for the GWA and vGWA is accessible using the digital object identifier (DOI) 10.4231/T9H41PBV, and data for the evaluation of candidate genes using T-DNA insertional alleles is accessible using the DOI 10.4231/T9NP22C0 (see http://dx.doi.org/).
All accessions have previously been genotyped using the 250k A. thaliana SNP chip and that data is publicly available [3]. SNPs where the minor allele frequency was below 5% were excluded from the analyses. Genotypes were available for more than 95% of the SNPs in all accessions, so none were removed due to problematic genotyping. In total, 200,345 SNPs passed this quality control and were used in our GWA and vGWA analyses.
We evaluated the region upstream of MOT1 for structural polymorphisms in a set of 283 accessions selected to cover the range of leaf molybdenum concentrations (S5 Table). This was done using gel electrophoresis to identify PCR fragment size differentiation using the primers described in S6 Table. The PCR reactions were completed as follows: 1μl DNA + 5X GoTaq Bf, 2.5mM dNTP’s, 25mM MgCl2, 0.4μM of each primer, 0.3μl Taq polymerase, and 9.7μl nuclease free water for a total reaction volume of 25μl. PCR conditions were 94°C for 1 minute to denature, 54°C for 1 minute to anneal, and 72°C for 1.25 minutes for extension, repeated for 40 cycles in the Thermo Px2 thermal cycler (Electron Corporation). DNA was prepared for the accessions that displayed suggestive evidence for structural polymorphisms and submitted for sequencing using Macrogen (dna.macrogen.com). The sequences were then compared to the Col-0 reference sequence using DiALIGN (http://bibiserv.techfak.uni-bielefeld.de/dialign/), which uncovered five loci and six segregating structural polymorphisms (S2 Table) that were then genotyped in the 283 phenotyped accessions (S5 Table).
Statistical analyses
All analyses described in the sections below were performed using the R-framework for statistical computing [62]. All figures, except Fig 2, were prepared using R.
GWA and vGWA analyses
The variance-heterogeneity genome-wide association analyses (vGWA) were performed using Squared residual Value Linear Modeling, SVLM, as implemented in the VariABEL R-package [63]. In short, this two is a two-step method where the trait is first adjusted for a potential mean SNP effect and other covariates in a regression analysis, and then a second regression analysis is applied to the squared residual values from the first analysis, using the SNP as the predictor. This analysis will identify any potential genetic variance-heterogeneity at a locus as the variance for each genotype is equal to the mean of the squared residual of the trait conditional on genotype. To control for population-structure, Grammar+ residuals were used as phenotypes in these analyses [64]. The Grammar+ residuals were calculated using a linear mixed model, incorporating the IBS-matrix to correct for population stratification, using the polygenic function implemented in the R-package GenABEL [65].
The genome-wide association (GWA) analyses were performed using a linear mixed model, incorporating the IBS-matrix to correct for population stratification, via the polygenic and mmscore functions implemented in the R-package GenABEL [65].
A genome-wide significance threshold was determined for all tested phenotypes by Bonferroni-correction for the number of tested SNPs, resulting in a threshold of 2.5 × 10⁻⁷. To detect potential inflation of the p-values in the GWA analyses due to remaining population stratification and/or cryptic relatedness, we visually evaluated the relationship between the theoretical distribution of p-values under the null-hypothesis versus those observed in the GWA using quantile-quantile (QQ) plots (S4 Fig), and calculated the inflation factor using the function estlambda in the GenABEL package [65].
Multi-locus LASSO regression analyses
Multi-locus regression analysis to identify independent SNP effects on leaf molybdenum concentrations was performed using LASSO regression implemented in the R-package glmnet [45]. To control for population-structure, Grammar+ residuals were used as phenotypes in these analyses [64]. The LASSO analysis identifies the linear model that minimizes the following ∑i(yi−y^i)2+λ∑j(βj) where yi and y^i is the phenotype and the predicted phenotype of individual i. βj is the individual genotype effects. The constraint will force most genotype effects to zero, thereby identifying a small subset of polymorphisms with strong independent effects on the phenotype. As λ decreases, the number of non-zero estimates will increase. If λ is zero, the method is identical to an ordinary linear regression. Here, we empirically selected a λ where all SNPs with non-zero effects reached the genome-wide significance threshold in the GWA or vGWA analysis (S1 Fig).
DGLM analyses to simultaneously estimate mean and variance effects of evidenced loci
Within the Double Generalized Linear Model (DGLM) framework it is possible to simultaneously model both dispersion and mean by fitting separate linear predictors for them [66,67]. We fitted a DGLM with separate genetic effects for the variance, and for the mean:
Y∼N(X1β1,eX2β2) where Y is the Grammar+ residuals for the molybdenum concentrations used to control for population-structure in the analyses [64], X1 = [SNP1, DEL, DUP]T, X2 = SNPi and i is the index of the SNP whose variance effect we are estimating. β1 and β2 were estimated using maximum likelihood. The model was fitted using the R-package dglm [67] as suggested in [10]. It should be noted that although the DGLM analysis is very useful for disentangling mean and variance effects of loci, it is not optimal for genome-wide analyses as it is both computationally demanding and provides highly conservative genome wide p-values (λ = 0.75 for leaf molybdenum concentration in this population). Here, DGLM was used to i) re-scan the vGWA region on chromosome 2 to identify the SNP with the strongest variance effect in vBLOCK and ii) include evidenced loci as co-factors with mean effect, while redoing the vGWA scan to evaluate whether the loci identified in the GWA led to the vGWA association.
Heritability estimates
Every accession in our data was grown with at least 6 replicates plants. The broad sense heritability (H2) was calculated using an ANOVA y = β0 + accession × βacc + e, comparing within and between line variances.
To calculate the narrow sense heritability (h2) we fitted a mixed model y¯=μ+Zb+e . Here y¯ is the mean leaf molybdenum concentration per line and ZZT = G, where G is the genomic kinship matrix. The intra-class correlation r=σb2σb2+σe2 given by this model tells us the amount of variance in y¯ explained by kinship. Assuming that the within line replicates has removed all environmental variance, the amount of the total phenotypic variance explained by kinship, aka h2, is rH2. In reality, as y¯ is estimated using <10 replicates for most lines, some environmental noise will remain in y¯ , in which case rH2 ≤ h2 ≤ r. Here, we therefore present the rH2 values, which is the lower bound of h2.
Variance explained
We estimated the fraction of H2 explained by the markers in the MOT1 region as R2=1−var(y¯−Xβ)var(y¯) , where y¯ is the mean molybdenum content per line and X is the genotype matrix for the markers, fitted as a fixed effect. This estimate assumes that y¯ contains no environmental variance which, as stated above, is not entirely the case. If y¯ contains environmental noise, this estimate will instead be the lower bound of the fraction of H2 explained by X, in the same way as described above for h2.
The fraction of h2 explained by the evaluated set of polymorphisms in the MOT1 region was estimated by comparing two mixed models:


The intra-class correlation r1 in model (1), gives the amount of variance in y¯ explained by kinship, whereas the intra-class correlation r2 in model (2) gives the amount of residual variance explained by kinship in this model. To compare the two, we calculate the amount of variance in y¯ explained by kinship under model (2) as r2,tot = r2(1 − R2). The fraction of h2 explained by the fixed effects X are then given as r1−r2,totr1 . The fraction of variance explained by X that is additive is calculated as r1−r2,totR2 .
Expression analysis to evaluate the potential effects of the associated MOT1 promoter polymorphisms
We quantified the levels of MOT1 mRNA in roots of 6 accessions carrying the DUP326 polymorhism, 5 accessions carrying the DEL53 polymorphism and Col-0 as a reference (S3 Table) using a protocol similar to that of [38]. Roots from plants grown under identical conditions to those used for ICP-MS analysis were separated from the shoots and rinsed thoroughly with deionized water to remove any soil contamination. The samples were frozen in liquid nitrogen and stored at -80°C until extraction. Total RNA was extracted, and DNase digestion was performed during the extraction, using the Invitrogen PureLink RNA Mini Kit. Two micrograms of total RNA were used a template to synthesize first-strand cDNA with random hexamers, using SuperScript II Reverse Transcriptase (Invitrogen Life Technologies). Quantitative real-time PCR (qRTPCR) was performed with first strand cDNA as a template on three independent biological samples for each accession, using a sequence detector system (StepOne Plus, Applied Biosystems). For normalization across samples within a qRT-PCR run, the expression of either PP2A or UBQ10 was used. For quantification of MOT1 the following primers were used: forward primer 5’-GGT GGG TGT GTG GCA CTG T-3’ and reverse primer 5’-AGC ACA CCA ACC GGA AAC TT-3’. The cycle threshold (CT) values were determined based on efficiency of amplification. The CT values were normalized against the mean expression of either PP2A or UBQ10 by calculating ΔCT values as CTMOT1–mean(CTPP2A(UBQ10)). The relative change in MOT1 expression versus Col-0 was then calculated for every accession i as ΔΔCTi = ΔCTi—ΔCTCol-0. The fold change in expression for accession i was then calculated as 2−ΔΔCT,i.
Functional evaluation of candidate genes using T-DNA insertion lines
We identified all genes in the LD-region (r2 > 0.4) surrounding the SNP1 and SNP2 loci. T-DNA insertional alleles, catalogued as homozygous at T-DNA Express (http://signal.salk.edu/cgi-bin/tdnaexpress), were ordered for all genes where they were available (Table 3; S4 Table) from the Nottingham Arabidopsis Stock Centre (NASC) with the exception of the GABI-kat lines which were received from the stock centre as F3 families. Since MOT1 is known to regulate molybdenum concentrations in A. thaliana, the mot1-1 T-DNA insertional allele (SALK_118311) for this gene was included on every experimental block of plants as a control, along with wild-type Col-0. An experimental block is defined by a cultivation tray containing 9 genotypes (including wild-type Col-0 and mot1-1) with each genotype represented by between 2–12 individuals per block. The tested T-DNA insertional alleles were grown in 8 independent blocks and the molybdenum concentration in leaves of all plants quantified by ICP-MS using the same procedure as used previously [36].
For every experimental block, we compared the molybdenum concentration in leaves between the replicates of every T-DNA insertion line, versus wild type Col-0, using the non-parametric Wilcox rank test. In 6 out of the 8 blocks, mot1-1 showed significantly lower molybdenum concentrations compared to the wild type Col-0 (p < 0.05) as expected, and in one block, the reduction was significant at (p < 0.1). The mot1-1 mutant in one experimental block of plants showed no difference compared to the wild type Col-0, and the results for the genotypes in this experimental block that were not supported by the results in other experimental blocks were discarded. To combine the data on T-DNA alleles that were replicated on several experimental blocks, we normalized molybdenum concentrations against wild type Col-0 within blocks and jointly analyzed the normalized values using the Wilcox rank test.
Explorations of the long-range LD-block surrounding the MOT1 gene
The vGWA analyses identify a strong variance-heterogeneity signal across a number of markers on chromosome 2 that contains the functional candidate MOT1 gene. The LD is high among these significant markers that define an extended vGWA associated vBLOCK. Visual inspection of the genotype-matrix of this region, sorted by the genotype of the leading SNP in the vGWA analysis (Table 1), indicated the presence of two major groups of accessions that carry the same alleles across a large number of the associated markers (Fig 1C).
Supporting Information
Zdroje
1. Guo J, Jorjani H, Carlborg Ö. A genome-wide association study using international breeding-evaluation data identifies major loci affecting production traits and stature in the Brown Swiss cattle breed. BMC Genet. 2012;13 : 82. doi: 10.1186/1471-2156-13-82 23031427
2. Atwell S, Huang YS, Vilhjálmsson BJ, Willems G, Horton M, Li Y, et al. Genome-wide association study of 107 phenotypes in Arabidopsis thaliana inbred lines. Nature. 2010;465 : 627–631. doi: 10.1038/nature08800 20336072
3. Baxter I, Brazelton JN, Yu D, Huang YS, Lahner B, Yakubova E, et al. A coastal cline in sodium accumulation in Arabidopsis thaliana is driven by natural variation of the sodium transporter AtHKT1;1. PLoS Genet. 2010;6: e1001193. doi: 10.1371/journal.pgen.1001193 21085628
4. Horton MW, Hancock AM, Huang YS, Toomajian C, Atwell S, Auton A, et al. Genome-wide patterns of genetic variation in worldwide Arabidopsis thaliana accessions from the RegMap panel. Nat Genet. 2012;44 : 212–216. doi: 10.1038/ng.1042 22231484
5. Chao D-Y, Silva A, Baxter I, Huang YS, Nordborg M, Danku J, et al. Genome-wide association studies identify heavy metal ATPase3 as the primary determinant of natural variation in leaf cadmium in Arabidopsis thaliana. PLoS Genet. 2012;8: e1002923. doi: 10.1371/journal.pgen.1002923 22969436
6. Chao D-Y, Chen Y, Chen J, Shi S, Chen Z, Wang C, et al. Genome-wide association mapping identifies a new arsenate reductase enzyme critical for limiting arsenic accumulation in plants. Plos Biol. 2014;12: e1002009. doi: 10.1371/journal.pbio.1002009 25464340
7. Shen X, De Jonge J, Forsberg SKG, Pettersson ME, Sheng Z, Hennig L, et al. Natural CMT2 Variation Is Associated With Genome-Wide Methylation Changes and Temperature Seasonality. PLoS Genet. 2014;10: e1004842. doi: 10.1371/journal.pgen.1004842 25503602
8. Nelson RM, Pettersson ME, Carlborg Ö. A century after Fisher: time for a new paradigm in quantitative genetics. Trends Genet. 2013;29 : 669–676. doi: 10.1016/j.tig.2013.09.006 24161664
9. Hill WG, Mulder HA. Genetic analysis of environmental variation. Genet Res. 2010;92 : 381–395. doi: 10.1017/S0016672310000546
10. Rönnegård L, Valdar W. Detecting major genetic loci controlling phenotypic variability in experimental crosses. Genetics. 2011;188 : 435–447. doi: 10.1534/genetics.111.127068 21467569
11. Dworkin I. Canalization, Cryptic Variation and Developmental Buffering: A Critical Examination and Analytical Perspective. In: Hallgrimsson B, Hall B, editors. Variation, A Central Concept in Biology. 1st ed. Elsevier; 2005. pp. 138–158.
12. Kitano H. Biological robustness. Nat Rev Genet. 2004;5 : 826–837. doi: 10.1038/nrg1471 15520792
13. Rutherford SL, Lindquist S. Hsp90 as a capacitor for morphological evolution. Nature. 1998;396 : 336–342. doi: 10.1038/24550 9845070
14. Dworkin I, Palsson A, Birdsall K, Gibson G. Evidence that Egfr Contributes to Cryptic Genetic Variation for Photoreceptor Determination in Natural Populations of Drosophila melanogaster. Current Biology. 2003;13 : 1888–1893. doi: 10.1016/j.cub.2003.10.001 14588245
15. Mackay TF, Lyman RF. Drosophila bristles and the nature of quantitative genetic variation. Philos Trans R Soc Lond, B, Biol Sci. 2005;360 : 1513–1527. doi: 10.1098/rstb.2005.1672 16108138
16. Weller JI, Soller M, Brody T. Linkage analysis of quantitative traits in an interspecific cross of tomato (lycopersicon esculentum x lycopersicon pimpinellifolium) by means of genetic markers. Genetics. 1988;118 : 329–339. 17246412
17. Hall MC, Dworkin I, Ungerer MC, Purugganan M. Genetics of microenvironmental canalization in Arabidopsis thaliana. Proceedings of the National Academy of Sciences of the United States of America. 2007;104 : 13717–13722. doi: 10.1073/pnas.0701936104 17698961
18. Ordas B, Malvar RA, Hill WG. Genetic variation and quantitative trait loci associated with developmental stability and the environmental correlation between traits in maize. Genet Res. 2008;90 : 385–395. doi: 10.1017/S0016672308009762
19. Jimenez-Gomez JM, Corwin JA, Joseph B, Maloof JN, Kliebenstein DJ. Genomic analysis of QTLs and genes altering natural variation in stochastic noise. PLoS Genet. 2011;7: e1002295. doi: 10.1371/journal.pgen.1002295 21980300
20. Rönnegård L, Valdar W. Recent developments in statistical methods for detecting genetic loci affecting phenotypic variability. BMC Genet. 2012;13 : 63. doi: 10.1186/1471-2156-13-63 22827487
21. Struchalin MV, Dehghan A, Witteman JCM, Duijn CV, Aulchenko YS. Variance heterogeneity analysis for detection of potentially interacting genetic loci: method and its limitations. BMC Genet. 2010;11 : 92. doi: 10.1186/1471-2156-11-92 20942902
22. Shen X, Pettersson M, Rönnegård L, Carlborg Ö. Inheritance beyond plain heritability: variance-controlling genes in Arabidopsis thaliana. PLoS Genet. 2012;8: e1002839. doi: 10.1371/journal.pgen.1002839 22876191
23. Ayroles JF, Buchanan SM, O'Leary C, Skutt-Kakaria K, Grenier JK, Clark AG, et al. Behavioral idiosyncrasy reveals genetic control of phenotypic variability. Proceedings of the National Academy of Sciences. 2015;112 : 6706–6711. doi: 10.1073/pnas.1503830112
24. Nelson RM, Pettersson ME, Li X, Carlborg Ö. Variance Heterogeneity in Saccharomyces cerevisiae Expression Data: Trans-Regulation and Epistasis. PLoS ONE. 2013;8: e79507. doi: 10.1371/journal.pone.0079507 24223957
25. Mendel RR, Leimkühler S. The biosynthesis of the molybdenum cofactors. J Biol Inorg Chem. 2015;20 : 337–347. doi: 10.1007/s00775-014-1173-y 24980677
26. Kaiser BN, Gridley KL, Ngaire Brady J, Phillips T, Tyerman SD. The role of molybdenum in agricultural plant production. Ann Bot. 2005;96 : 745–754. doi: 10.1093/aob/mci226 16033776
27. Williams L, Salt DE. The plant ionome coming into focus. Curr Opin Plant Biol. 2009;12 : 247–249. doi: 10.1016/j.pbi.2009.05.009 19524481
28. Bentsink L, Alonso-Blanco C, Vreugdenhil D, Tesnier K, Groot SP, Koornneef M. Genetic analysis of seed-soluble oligosaccharides in relation to seed storability of Arabidopsis. Plant Physiology. 2000;124 : 1595–1604. 11115877
29. Bentsink L, Yuan K, Koornneef M, Vreugdenhil D. The genetics of phytate and phosphate accumulation in seeds and leaves of Arabidopsis thaliana, using natural variation. Theor Appl Genet. 2003;106 : 1234–1243. doi: 10.1007/s00122-002-1177-9 12748774
30. Payne KA, Bowen HC, Hammond JP, Hampton CR, Lynn JR, Mead A, et al. Natural genetic variation in caesium (Cs) accumulation by Arabidopsis thaliana. New Phytologist. 2004;162 : 535–548. doi: 10.1111/j.1469-8137.2004.01026.x
31. Vreugdenhil D, Aarts MGM, Koornneef M, Nelissen H, Ernst WHO. Natural variation and QTL analysis for cationic mineral content in seeds of Arabidopsis thaliana. Plant Cell Environ. 2004;27 : 828–839. doi: 10.1111/j.1365-3040.2004.01189.x
32. Harada H, Leigh RA. Genetic mapping of natural variation in potassium concentrations in shoots of Arabidopsis thaliana. Journal of Experimental Biology. 2006;57 : 953–960. doi: 10.1093/jxb/erj081
33. Zeng C, Han Y, Shi L, Peng L, Wang Y, Xu F, et al. Genetic analysis of the physiological responses to low boron stress in Arabidopsis thaliana. Plant Cell Environ. 2008;31 : 112–122. doi: 10.1111/j.1365-3040.2007.01745.x 17999661
34. Ghandilyan A, Barboza L, Tisné S, Granier C, Reymond M, Koornneef M, et al. Genetic analysis identifies quantitative trait loci controlling rosette mineral concentrations in Arabidopsis thaliana under drought. New Phytologist. 2009;184 : 180–192. doi: 10.1111/j.1469-8137.2009.02953.x 19656307
35. Morrissey J, Baxter IR, Lee J, Li L, Lahner B, Grotz N, et al. The ferroportin metal efflux proteins function in iron and cobalt homeostasis in Arabidopsis. The Plant Cell. 2009;21 : 3326–3338. doi: 10.1105/tpc.109.069401 19861554
36. Baxter I, Muthukumar B, Park HC, Buchner P, Lahner B, Danku J, et al. Variation in molybdenum content across broadly distributed populations of Arabidopsis thaliana is controlled by a mitochondrial molybdenum transporter (MOT1). PLoS Genet. 2008;4: e1000004. doi: 10.1371/journal.pgen.1000004 18454190
37. Poormohammad Kiani S, Trontin C, Andreatta M, Simon M, Robert T, Salt DE, et al. Allelic heterogeneity and trade-off shape natural variation for response to soil micronutrient. PLoS Genet. 2012;8: e1002814. doi: 10.1371/journal.pgen.1002814 22807689
38. Rus A, Baxter I, Muthukumar B, Gustin J, Lahner B, Yakubova E, et al. Natural variants of AtHKT1 enhance Na+ accumulation in two wild populations of Arabidopsis. PLoS Genet. 2006;2: e210. doi: 10.1371/journal.pgen.0020210 17140289
39. Kobayashi Y, Kuroda K, Kimura K, Southron-Francis JL, Furuzawa A, Kimura K, et al. Amino Acid Polymorphisms in Strictly Conserved Domains of a P-Type ATPase HMA5 Are Involved in the Mechanism of Copper Tolerance Variation in Arabidopsis. Plant Physiology. 2008;148 : 969–980. doi: 10.1104/pp.108.119933 18701674
40. Loudet O, Saliba-Colombani V, Camilleri C, Calenge F, Gaudon V, Koprivova A, et al. Natural variation for sulfate content in Arabidopsis thaliana is highly controlled by APR2. Nat Genet. 2007;39 : 896–900. doi: 10.1038/ng2050 17589509
41. Koprivova A, Giovannetti M, Baraniecka P, Lee B-R, Grondin C, Loudet O, et al. Natural variation in the ATPS1 isoform of ATP sulfurylase contributes to the control of sulfate levels in Arabidopsis. Plant Physiology. 2013;163 : 1133–1141. doi: 10.1104/pp.113.225748 24027241
42. Chao D-Y, Baraniecka P, Danku J, Koprivova A, Lahner B, Luo H, et al. Variation in sulfur and selenium accumulation is controlled by naturally occurring isoforms of the key sulfur assimilation enzyme ADENOSINE 5'-PHOSPHOSULFATE REDUCTASE2 across the Arabidopsis species range. Plant Physiology. 2014;166 : 1593–1608. doi: 10.1104/pp.114.247825 25245030
43. Baxter I, Hermans C, Lahner B, Yakubova E, Tikhonova M, Verbruggen N, et al. Biodiversity of mineral nutrient and trace element accumulation in Arabidopsis thaliana. PLoS ONE. 2012;7: e35121. doi: 10.1371/journal.pone.0035121 22558123
44. Tomatsu H, Takano J, Takahashi H, Watanabe-Takahashi A, Shibagaki N, Fujiwara T. An Arabidopsis thaliana high-affinity molybdate transporter required for efficient uptake of molybdate from soil. Proceedings of the National Academy of Sciences. 2007;104 : 18807–18812. doi: 10.1073/pnas.0706373104
45. Friedman J, Hastie T, Tibshirani R. Regularization Paths for Generalized Linear Models via Coordinate Descent. J Stat Softw. 2010;33 : 1–22. 20808728
46. Billard V, Ourry A, Maillard A, Garnica M, Coquet L, Jouenne T, et al. Copper-Deficiency in Brassica napus Induces Copper Remobilization, Molybdenum Accumulation and Modification of the Expression of Chloroplastic Proteins. PLoS ONE. 2014;9: e109889. doi: 10.1371/journal.pone.0109889 25333918
47. Carlborg Ö, Haley CS. Opinion: Epistasis: too often neglected in complex trait studies? Nat Rev Genet. 2004;5 : 618–625. doi: 10.1038/nrg1407 15266344
48. Weigel D. Natural variation in Arabidopsis: from molecular genetics to ecological genomics. Plant Physiology. 2012;158 : 2–22. doi: 10.1104/pp.111.189845 22147517
49. Barboza L, Effgen S, Alonso-Blanco C, Kooke R, Keurentjes JJB, Koornneef M, et al. Arabidopsis semidwarfs evolved from independent mutations in GA20ox1, ortholog to green revolution dwarf alleles in rice and barley. Proceedings of the National Academy of Sciences. 2013;110 : 15818–15823. doi: 10.1073/pnas.1314979110
50. Saez-Aguayo S, Rondeau-Mouro C, Macquet A, Kronholm I, Ralet M-C, Berger A, et al. Local Evolution of Seed Flotation in Arabidopsis. Bomblies K, editor. PLoS Genet. 2014;10: e1004221. doi: 10.1371/journal.pgen.1004221 24625826
51. Johanson U, West J, Lister C, Michaels S, Amasino R, Dean C. Molecular analysis of FRIGIDA, a major determinant of natural variation in Arabidopsis flowering time. Science. 2000;290 : 344–347. 11030654
52. Li P, Filiault D, Box MS, Kerdaffrec E, van Oosterhout C, Wilczek AM, et al. Multiple FLC haplotypes defined by independent cis-regulatory variation underpin life history diversity in Arabidopsis thaliana. Genes & Development. 2014;28 : 1635–1640. doi: 10.1101/gad.245993.114 25035417
53. Kijas JM, Wales R, Törnsten A, Chardon P, Moller M, Andersson L. Melanocortin receptor 1 (MC1R) mutations and coat color in pigs. Genetics. 1998;150 : 1177–1185. 9799269
54. Kijas JMH, Moller M, Plastow G, Andersson L. A Frameshift Mutation in MC1R and a High Frequency of Somatic Reversions Cause Black Spotting in Pigs. Genetics. 2001;158 : 779–785. 11404341
55. Pielberg G, Olsson C, Syvänen AC, Andersson L. Unexpectedly High Allelic Diversity at the KIT Locus Causing Dominant White Color in the Domestic Pig. Genetics. 2002;160 : 305–311. 11805065
56. Grobet L, Poncelet D, Royo LJ, Brouwers B, Pirottin D, Michaux C, et al. Molecular definition of an allelic series of mutations disrupting the myostatin function and causing double-muscling in cattle. Mamm Genome. 1998;9 : 210–213. 9501304
57. Ciobanu D, Bastiaansen J, Malek M, Helm J, Woollard J, Plastow G, et al. Evidence for new alleles in the protein kinase adenosine monophosphate-activated gamma(3)-subunit gene associated with low glycogen content in pig skeletal muscle and improved meat quality. Genetics. 2001;159 : 1151–1162. 11729159
58. Dickson SP, Wang K, Krantz I, Hakonarson H, Goldstein DB. Rare variants create synthetic genome-wide associations. Plos Biol. 2010;8: e1000294. doi: 10.1371/journal.pbio.1000294 20126254
59. Eichler EE, Flint J, Gibson G, Kong A, Leal SM, Moore JH, et al. Missing heritability and strategies for finding the underlying causes of complex disease. Nat Rev Genet. 2010;11 : 446–450. doi: 10.1038/nrg2809 20479774
60. Meyers BC, Kaushik S, Nandety RS. Evolving disease resistance genes. Curr Opin Plant Biol. 2005;8 : 129–134. doi: 10.1016/j.pbi.2005.01.002 15752991
61. Kroymann J, Mitchell-Olds T. Epistasis and balanced polymorphism influencing complex trait variation. Nature. 2005;435 : 95–98. doi: 10.1038/nature03480 15875023
62. R Development Core Team. R: A Language and Environment for Statistical Computing. Vienna, Austria; 2015.
63. Struchalin MV, Amin N, Eilers PHC, van Duijn CM, Aulchenko YS. An R package “VariABEL” for genome-wide searching of potentially interacting loci by testing genotypic variance heterogeneity. BMC Genet. 2012;13 : 4. doi: 10.1186/1471-2156-13-4 22272569
64. Belonogova NM, Svishcheva GR, van Duijn CM, Aulchenko YS, Axenovich TI. Region-based association analysis of human quantitative traits in related individuals. PLoS ONE. 2013;8: e65395. doi: 10.1371/journal.pone.0065395 23799013
65. Aulchenko YS, Ripke S, Isaacs A, van Duijn CM. GenABEL: an R package for genome-wide association analysis. Bioinformatics. 2007;23 : 1294–1296. 17384015
66. Smyth GK. Generalized linear models with varying dispersion. Journal of the Royal Statistical Society, Series B. 1989;51 : 47–60.
67. Dunn PK, Smyth GK. dglm: Double Generalized Linear Models. 1st ed. http://CRAN.R-project.org/package=dglm; 2014 Apr. Report No.: R-package.
Štítky
Genetika Reprodukční medicínaČlánek vyšel v časopise
PLOS Genetics
2015 Číslo 11
Nejčtenější v tomto čísle
- UFBP1, a Key Component of the Ufm1 Conjugation System, Is Essential for Ufmylation-Mediated Regulation of Erythroid Development
- Metabolomic Quantitative Trait Loci (mQTL) Mapping Implicates the Ubiquitin Proteasome System in Cardiovascular Disease Pathogenesis
- Genus-Wide Comparative Genomics of Delineates Its Phylogeny, Physiology, and Niche Adaptation on Human Skin
- Encodes Dual Oxidase, Which Acts with Heme Peroxidase Curly Su to Shape the Adult Wing