
Genome-Wide Reprogramming of Transcript Architecture by Temperature Specifies the Developmental States of the Human Pathogen
Eukaryotic cells alter their developmental programs in response to environmental signals. Histoplasma capsulatum (Hc), a ubiquitous fungal pathogen of humans, establishes unique transcriptional programs to specify growth in either a multicellular hyphal form or unicellular yeast form in response to temperature. Since hyphae and yeast are specialized to function in infectivity or pathogenesis, respectively, Hc provides a clinically relevant system in which to query eukaryotic regulatory processes. Here we used next-generation sequencing approaches to annotate the transcriptomes of four distinct Hc strains in response to temperature. We found that a fraction of Hc transcripts have differential transcript architecture in hyphae and yeast, exhibiting 5’ leader sequences that differ markedly in length between morphogenetic states. To begin to understand the effect of these differential leader sequences on expression, we performed the first ribosome density and mRNA abundance measurements in Hc, thereby uncovering transcriptional and translational control that contribute to cell-type regulation.
Published in the journal:
. PLoS Genet 11(7): e32767. doi:10.1371/journal.pgen.1005395
Category:
Research Article
doi:
https://doi.org/10.1371/journal.pgen.1005395
Summary
Eukaryotic cells alter their developmental programs in response to environmental signals. Histoplasma capsulatum (Hc), a ubiquitous fungal pathogen of humans, establishes unique transcriptional programs to specify growth in either a multicellular hyphal form or unicellular yeast form in response to temperature. Since hyphae and yeast are specialized to function in infectivity or pathogenesis, respectively, Hc provides a clinically relevant system in which to query eukaryotic regulatory processes. Here we used next-generation sequencing approaches to annotate the transcriptomes of four distinct Hc strains in response to temperature. We found that a fraction of Hc transcripts have differential transcript architecture in hyphae and yeast, exhibiting 5’ leader sequences that differ markedly in length between morphogenetic states. To begin to understand the effect of these differential leader sequences on expression, we performed the first ribosome density and mRNA abundance measurements in Hc, thereby uncovering transcriptional and translational control that contribute to cell-type regulation.
Introduction
Environmental human pathogens have evolved the ability to survive in human hosts as well as diverse environmental reservoirs. Thus a hallmark of environmental pathogens is their capacity to adapt to varied growth conditions such as differences in temperature, alterations in nutrient sources, as well as exposure to the host immune system. The dimorphic human fungal pathogen, Histoplasma capsulatum (Hc), is one such environmental pathogen that responds to an increase in temperature inside a mammalian host by dramatically altering its cellular morphology and gene expression programs to cause disease. The environmental, infectious form of Hc grows in the soil as a saprophyte in a multicellular hyphal or “mold” form that produces vegetative spores called conidia [1,2]. Infection occurs when humans inhale conidia or hyphal fragments. Upon exposure to mammalian body temperature, Hc transitions into a unicellular, budding yeast (Fig 1A) that is capable of causing primary disease in immunocompetent individuals [3–6]. The temperature-regulated differentiation of Hc between the hyphal and yeast forms can be recapitulated in the laboratory simply by switching the temperature from room temperature (RT) to 37°C, making Hc a unique organism for studying the regulation of gene expression during multicellular development, environmental signal transduction, and adaptation of a pathogen to a mammalian host.

Hc cells respond to temperature through a transcriptional regulatory circuit that controls cell morphology as well as the expression of 5–15% of the Hc transcriptome that is differentially regulated between yeast and hyphal cells [8–10]. In addition, transcripts encoding many of the known Hc virulence factors are enriched in the yeast-phase of growth [11], making yeast-enriched transcripts intriguing virulence factor candidates. To this end, microarrays [8,9,12–14] and RNA-sequencing (RNA-seq) [10] have begun to elucidate the transcriptomes of yeast, hyphal, and conidial cell types to describe transcript expression patterns that specify these three major cell types important for the Hc pathogenic lifecycle. Despite these efforts, our understanding of the Hc transcriptome and cell-morphology specific regulatory programs remains incomplete partly due to challenges inherent in deciphering intron-rich, densely populated eukaryotic fungal transcriptomes.
To date, Hc transcriptomics studies have been performed using two North and Central American Hc var. capsulatum strains, G217B and G186AR (see Fig 1B). Yet, Hc is found globally (North, South, and Central America, Southeast Asia, and Africa) and phylogenetic analysis of Hc clinical isolates has revealed that Hc comprises at least 8 genetically and geographically distinct lineages that span 3–13 million years of evolutionary distance [7,15] (Fig 1B). In addition to its genetic diversity, Hc can be segregated into two varieties (var.) based on clinical outcomes: Hc var. duboisii and Hc var. capsulatum. Hc var. capsulatum is represented in all of the major Hc lineages and infection with this variety predominantly manifests as pulmonary and systemic disease [4]. Hc var. duboisii, conversely, is geographically restricted to Western and Central Africa and causes cutaneous and subcutaneous skin as well as bone lesions in a systemic infection that is distinguished in name from classical disease as African histoplasmosis [16,17]. The virulence mechanisms and basic biology of the causative agent of African histoplasmosis, Hc var. duboisii, as well as Hc var. capsulatum strains from additional, more divergent lineages, remain uninvestigated.
In this work, we employ recent advances in next-generation sequencing and de novo transcriptome reconstruction methodologies to refine transcript architecture and define transcript expression programs across divergent isolates of Hc that cause classical (G217B, G186AR, H143) or African (H88) histoplasmosis. Using comparative transcriptomics of two temperature-regulated states, we broaden our understanding of the basic biology and pathogenesis of Hc by defining core yeast (parasitic, disease-causing form) and hyphal (infectious form) transcript expression patterns that exhibit conserved regulatory patterns. Systematic analysis of our improved Hc transcript architecture further revealed that a subset of the Hc transcriptome (~ 2%) exhibited dramatically different leader sequence lengths (often referred to as the 5’ untranslated region; UTR) between these two Hc developmental cell states. To begin to understand the biological significance of longer leader transcripts, we probed their ribosome occupancy using ribosome profiling. Consequently, we defined several categories of genes, including those that are regulated at both the transcriptional and translational level in response to temperature-initiated developmental programs. Phenotypic analysis revealed that this exquisite regulation is necessary for appropriate cell-type specification by temperature, the key signal for infectious and parasitic states.
Results
Comparative annotation of Histoplasma transcriptomes
To compare yeast and hyphal transcript expression patterns across Hc lineages, we grew each Hc strain (G217B, G186AR, H88, H143) at 37°C for yeast-phase growth and at room temperature (RT) for hyphal phase growth (Fig 1C). Total RNA was isolated from biological duplicates of yeast or hyphal cultures and strand specific cDNA libraries were created from poly(A)-enriched RNA and sequenced using paired-end deep-sequencing. The 4 Hc strains that we selected for transcriptomics analysis each have sequenced genomes; however, the Hc gene predictions vary among strains and often lack accurate models of 5’ leader and 3’ UTR regions. Therefore we constructed de novo transcript calls leveraging our paired-end RNA-seq data with the aim of improving transcript models, generating high confidence ortholog mapping across Hc strains, and directly identifying poly(A)+ transcribed regions. To do so we combined yeast and hyphal sequencing reads for each Hc strain and used these pooled reads to generate per-strain reference transcriptomes across the 4 Hc lineages (see Fig 2A; S1 Table; S1–S12 Data; Materials and Methods). Hc RNA species without polyadenylated 3’ ends (i.e., potential small non-coding RNA) were not enriched in our sequencing libraries and thus are likely not represented in these transcript models.

Our genome-guided transcriptome assembly pipeline yielded 12, 175–12, 889 transcripts for the 4 Hc strains with 9, 580–9, 844 of assembled transcripts predicted to be protein coding (Table 1). This falls within the range of 9, 229–11, 329 protein coding genes predicted from Hc genomic sequences by ab initio gene prediction algorithms (Table 1). These Hc transcript models do not take into account any alternate transcript isoforms that may exist within or between Hc cell types (i.e., transcript forms that arise due to intron retention); however this is an interesting area for future refinement and investigation. The assembled transcripts were overall larger in size than the predicted transcript set (S1 Fig), which is mostly due to the improved annotation of 5’ leader and 3’ UTR transcript ends (Fig 2B and 2C). In addition to augmenting 5’ and 3’ transcript end annotations, we noticed many cases where assembled transcripts had more accurate intron boundaries than predicted transcripts resulting in improved annotation of coding sequence (CDS) regions (S2 Fig).

In order to compare transcription across strains, groups of orthologous genes among the 4 Hc strains (orthogroups) were determined using two independent methods, Mercator [18] and InParanoid [19], which gave similar numbers of per-strain ortholog assignments (Table 1). For downstream analyses, we chose the Mercator method for determining Hc orthogroups since it incorporates both BLASTP [20] homology and genomic synteny for a more stringent determination of orthogroups. Using Mercator we assembled 6, 791 unique Hc orthogroups that were present in all four strains (see Materials and Methods; Table 1). Genes not assigned to orthogroups by this method could include in-paralogs (gene duplications that occurred after strain divergence), improperly assembled transcripts that led to inappropriate open reading frame (ORF) predictions, and genes truly unique to a given strain. Of the 6, 791 Hc orthogroups, 423 (6.2%) were not in any of the previously predicted Hc transcript sets and exhibited a striking pattern of short CDS regions relative to overall transcript lengths (S3 Fig). Only a small percentage of these novel orthogroups had conserved Pfam-A domains (4%) [21] or predicted secretion signals (9% as determined by Phobius [22,23]), and they exhibited lower transcript expression levels in comparison to the full orthogroup set (S4 Fig). In other eukaryotic species, poly(A)+ long non-coding RNAs (lncRNAs) often have lower expression levels than protein-encoding transcripts [24]. Thus, this set of novel orthogroups in Hc may include cases of poly(A)+ non-coding RNA species with spurious ORF predictions as well as small proteins or peptides missed by ab initio genome prediction algorithms. Overall, however, 90% of Hc orthogroups were predicted to encode at least one Pfam-A domain [21] indicating that the vast majority of Hc orthogroups determined from our RNA-seq transcriptome assemblies represent bona fide protein coding transcripts.
Identification of evolutionarily conserved programs of gene regulation across Histoplasma infectious and parasitic cell types
We used eXpress [25] to determine transcript expression levels across yeast and hyphal cell morphologies for the 4 Hc strains. eXpress estimates of FPKM values (fragments per kilobase of exon per million aligned fragments) were well-correlated between biological replicates (S2 Table); therefore we took the mean of log2 FPKM values of biological replicates for downstream analyses of Hc yeast and hyphal expression patterns (S13 Data). To define a global picture of evolutionarily conserved programs of gene regulation across Hc lineages, we identified transcripts enriched in the yeast (parasitic form) or hyphal (infectious form) state from the 6, 791 Hc orthogroups (S5 Fig; S13–S15 Data). Minor lineage-specific differences in gene expression were observed, though these were largely of unknown biological significance. In terms of conserved patterns of gene expression, we found 139 yeast-phase enriched transcripts (core yeast-phase transcripts: Y/H log2 ≥ 1.5) and 291 hyphal-phase enriched transcripts (core hyphal-phase transcripts: Y/H log2 ≤ - 1.5) conserved in differential expression pattern among the 4 Hc strains (S5B and S5C Fig; S13 Data). Core yeast-phase enriched transcripts included two characterized virulence factors (CBP1, SOD3) [26,27], siderophore biosynthesis and transport genes (SID3, SID4, ABC1) important for yeast cell iron acquisition [28], and 6 putative transcription factors (CSR1, CHA4, MEA1, RYP1, RYP4, XBP1) including RYP1 and RYP4, which are master transcriptional regulators of Hc yeast-phase growth [8,9]. We also identified 8 cell wall modifying enzymes (AMY2, CFP8, CTS1, DCW1, ENG1, GEL2, OCH1, SKN1) with transcripts upregulated in the yeast phase that are predicted to be involved in the biosynthesis or remodeling of cell wall polysaccharides such as β-glucan, chitin, and mannan; the upregulation of these transcripts in yeast may reflect differences inherent to yeast versus hyphal cell division and growth. Core hyphal-phase enriched transcripts included 18 putative transcription factors (see S13 Data), many of which are uncharacterized and are members of the fungal-specific Zn2C6 DNA binding domain family of transcriptional regulators (Pfam Accession: PF00172). In addition, we noticed that many core hyphal-phase enriched transcripts encoded enzymes such as cytochrome p450s, polyphenol oxidases (also known as tyrosinases), oxidoreductases, and peroxidases (see S13 Data). The hyphal-phase enrichment of these enzymes, which are often involved in nutrient acquisition or the production of toxins, melanin, and other secondary metabolites, is likely reflective of the saprophytic lifestyle of Hc hyphal cells.
Analysis of the parasitic-phase transcriptome reveals expansion of knottins, putative effectors of Hc virulence
Examining the relative abundances of yeast-enriched transcripts (using per-state mRNA FPKMs) indicated that some of the most abundant core yeast-enriched transcripts (CBP1, GH17/CFP4, SOD3, ENG1) encode proteins known to be secreted by yeast cells [29] (S6 Fig). Since bacterial and fungal pathogens often utilize secreted proteins as virulence effectors [30,31], we were interested in identifying additional conserved yeast-phase enriched transcripts encoding proteins with secretion signals. Prediction of secretion signal peptides for the conserved yeast-phase enriched ORFs (using Phobius [22,23]) revealed that secreted proteins were significantly more likely to be differentially expressed than non-secreted proteins (p = 0.000314), suggesting that many secreted proteins could have phase-specific roles. In addition, we noticed that there were many small (≤ 200 AAs) putative secreted proteins (Figs 3A and S6) that exhibited a conserved C-terminal, 6-cysteine spacing pattern reminiscent of some insect toxins [32].
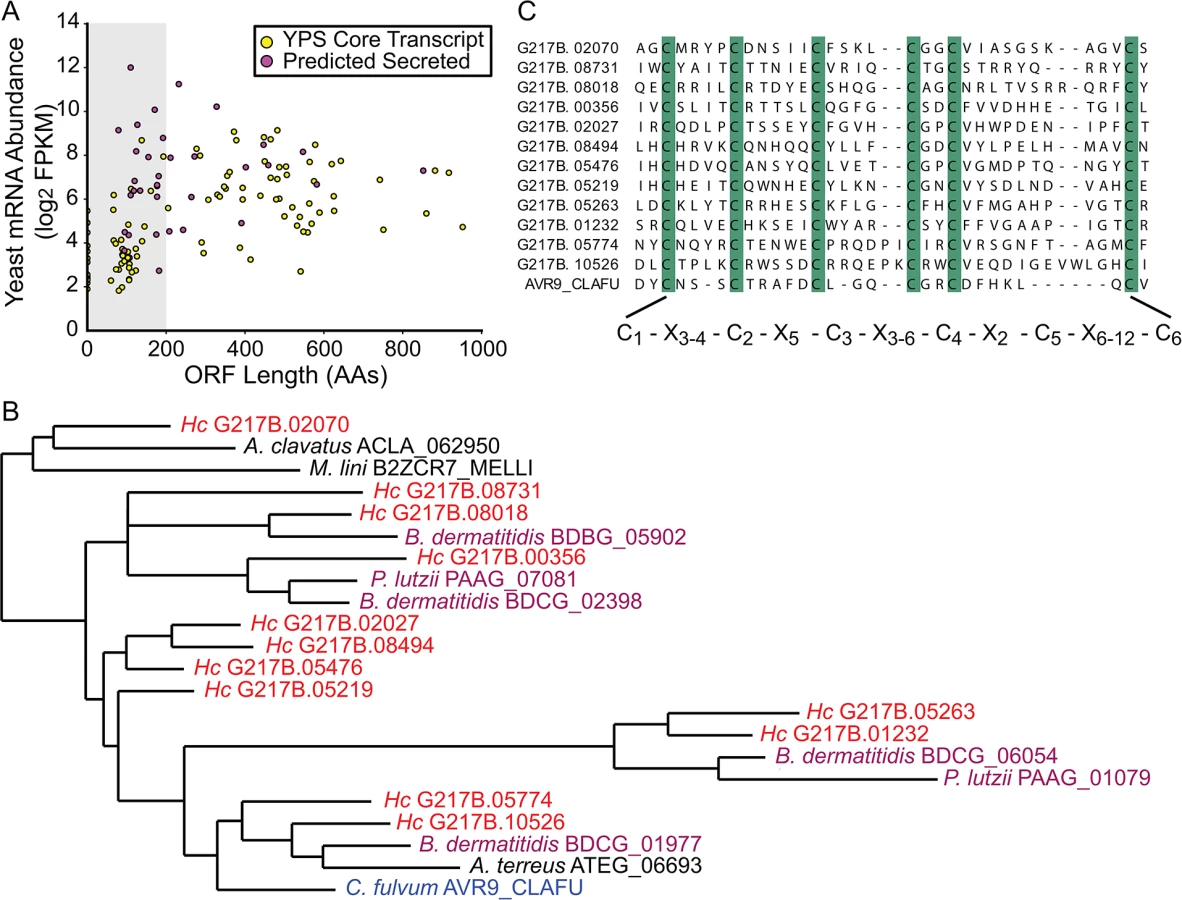
We examined existing hidden Markov models (HMM) of cysteine-rich protein domains to determine whether this Hc 6-cysteine motif belonged to any known protein families. Through this analysis, we found that many Hc ORFs with the 6-cysteine motif had homology to a cystine knot (or knottin) gene family [34]. Knottin domains are comprised of 3 interwoven disulfide bonds that form one of the smallest known stable globular domains [35], making these proteins extremely resistant to chemical, heat, and proteolytic stresses [36]. Knottins can be found in fungi, insects, plants, and animals [34], and their 3-disulfide bond core can present constrained loop structures that mediate protein-protein interactions [37]. Functionally, knottin proteins have been shown to act as pore formers, ion-channel inhibitors, as well as protease inhibitors [38–40]. Phylogenetic analysis of proteins with identifiable knottin domains (of the Fungi1 knottin family [34,41]) in Hc as well as other related fungal species, revealed that this family appears to have undergone an expansion in the Ajellomycetaceae family of human fungal pathogens (Hc, Paracoccidioides brasiliensis, Blastomyces dermatitidis) (Figs 3B and S7; S16–S18 Data). Notably, knottins are absent from many Saccharomycetes fungi such as Saccharomyces cerevisiae and Candida albicans (S7 Fig). Hc transcripts encoding this knottin domain are predominantly yeast-phase enriched (S8 Fig) and are intriguing candidates for virulence effectors that could mediate host-pathogen interactions.
Transcriptome assembly across Histoplasma lineages uncovers genome-wide regulation of transcript length between cell morphologies
While examining our improved annotation of transcript boundaries in the 4 assembled Hc transcriptomes, we noticed that a subset of transcripts exhibited differences in the size of their leader regions between yeast and hyphal cell types. For example, we observed that some transcripts in yeast cells displayed longer leader regions as compared to their cognate hyphal transcripts (Fig 4). This was a phenomenon that we had previously seen for a handful of Hc yeast-enriched transcripts while examining transcript abundance and architecture in G217B yeast and hyphal cells using Northern blotting and 5’ RACE (5’ rapid amplification of cDNA ends) [13]. Given the high-resolution nature of RNA-seq data, we were able to identify leader regions that were differential in length between Hc morphologies genome-wide across all 4 strains. To do so, we employed our existing transcript assembly pipeline to determine per-cell type (yeast and hyphae) transcript structures for each Hc strain (see Materials and Methods; S19–S26 Data). Globally, we found that most leader regions were similar in length between yeast and hyphae in all 4 Hc strains as expected (S9 and S10 Figs). However, systematic analysis of leader regions using per-cell type assembled transcript structures identified 187 transcripts with conserved, differentially sized leader regions between yeast and hyphal cells (see Materials and Methods; S10 Fig; S13 Data). The conservation of differential leader transcript structure in all 4 Hc lineages examined suggests that changes to 5’ transcript length are not a stochastic transcriptional outcome, but are evolutionarily conserved and likely regulated by the cell.

We found that the majority of transcripts that exhibited differential leader length are longer in the yeast phase compared to the hyphal phase of Hc growth (138/187 differential leaders; S10 Fig; S13 Data). We did, however, find 49/187 conserved transcripts with longer leaders in hyphal cells (S10 Fig; S13 Data), indicating that differential leader length is not an artifact of sample preparation or produced exclusively by one Hc cell type. We examined the sizes of a subset of longer leader transcripts in yeast and hyphal cells via Northern blotting, which confirmed the differential transcripts sizes between Hc cell morphologies (S11 Fig). Northern blot analysis of longer leader transcripts also highlighted that some of these transcripts represent a population of transcripts of variable sizes (S11 Fig). This is analogous to emerging observations of complex transcript structure in S. cerevisiae where variations in 5’ and 3’ transcript boundaries give rise to many different transcript isoforms for a given gene [42,43].
Establishment of ribosome profiling in Histoplasma yeast and hyphae to probe translational regulation of longer leader transcripts
Differential sizes of transcript leader regions between cell states or in cells encountering changing environmental conditions is a recently observed genome-wide phenomenon in eukaryotes [44–48]. While the biological function of differential leader regions is often unclear, changes in leader length have been proposed to influence the translational outcome of protein coding ORFs either by introducing regions of RNA that can serve to regulate translation (e.g., upstream ORFs; uORFS) [44] or by introducing an alternate start codon that encodes a new protein variant [42]. Thus we hypothesized that differential leader transcripts in Hc may be translationally regulated between Hc developmental states. To investigate this possibility we adapted ribosome profiling to Hc. Ribosome profiling is based on deep-sequencing of ribosome-protected RNA fragments or “footprints” and has been well-established as a method to probe translational regulation in eukaryotic cells [44,49–51]. Analogous to ribosome profiling developed in the model yeast organism S. cerevisiae [49], we digested total RNA from yeast or hyphal G217B Hc cells with RNase I and then separated and fractionated the RNA with a sucrose density gradient to collect Hc 80S monosomes (Fig 5A and 5B). Polysome profiles of undigested RNA from yeast and hyphal vegetative cells were noticeably different (Fig 5A and 5B), most likely illustrating the distinct modes of growth for these Hc cell types. Hc yeast grow and divide as unicellular budding yeast cells while Hc hyphal cells are connected by septa to form filamentous, branched hyphae that grow as highly polarized multicellular structures. In Ascomycete fungi, hyphal cells exhibit specialization and often possess differences in growth rate, cell size, or access to nutrients [52], leading to a heterogeneous mix of cell states per hyphae.
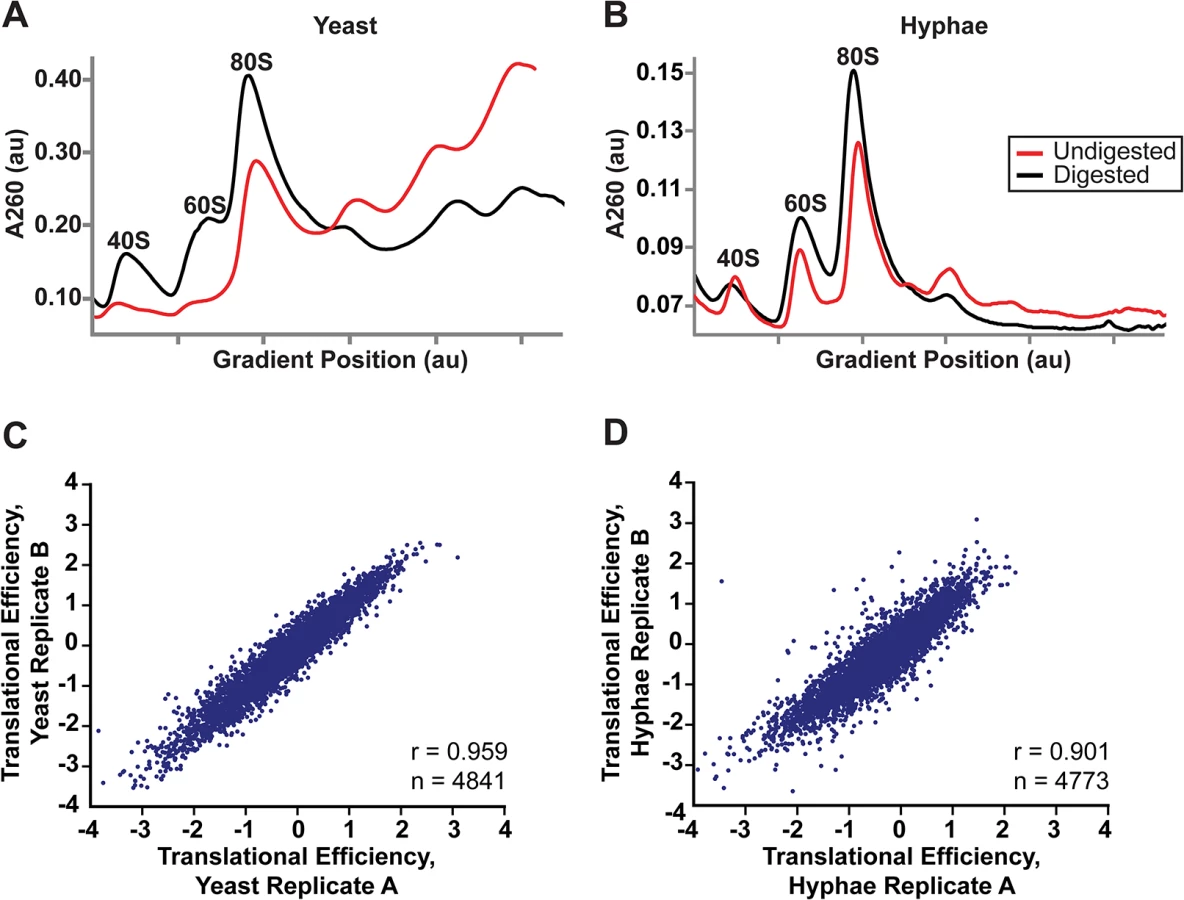
We collected biological replicate samples of yeast and hyphae monosomes as well as poly(A)-enriched RNA from the same samples for ribosome profiling and RNA-seq, respectively. Ribosome footprint density and mRNA abundance measurements (calculated as the number of ribosome-protected or mRNA fragments per kilobase of coding sequence per million mapped reads; FPKM) were reproducible between yeast and hyphal biological replicates (S12 Fig). With ribosome profiling data we can also determine the translational efficiency (TE) of transcripts (calculated as the ratio of ribosome footprint density to mRNA abundance over a coding region), which is a measure of the extent to which a transcript is translationally regulated. Importantly, measurements of TE in Hc were reproducible between biological replicates (Fig 5C and 5D; S27 Data) and TE measurements for genes expressed in yeast or hyphal cells spanned similar orders of magnitude (S13A Fig). Additionally, ribosome footprint FPKMs for transcripts involved in basic cellular functions thought to be important for growth or maintenance of both cells types (ACT1, GAPDH, TEF1, CDC2, TUB1, and TUB2) were overall remarkably similar between yeast and hyphae (S13B Fig; S27 Data). However, we want to stress that the ribosome profiling data sets provide relative measures of translational efficiencies and not absolute measures of translation. Together these data indicate that ribosome profiling is a robust method to probe genome-wide ribosome occupancy as well as the translational regulation of transcripts in the developmentally distinct morphologies of Hc.
Translational control contributes to specification of the yeast and hyphal developmental programs
Transcriptome-wide ribosome occupancy measurements did not correlate perfectly with mRNA abundance in Hc yeast or hyphae (Fig 6A and 6B). This suggested that expression of a subset of Hc genes is controlled at the level of translation and thus could reflect cell-type specific translational regulation between Hc cell morphologies. To investigate this, we first examined ribosome footprint density measurements to identify transcripts with different levels of translation between yeast and hyphal cells. Through this analysis we found subsets of transcripts that were predominantly translated only in one cell type (yeast = 200 transcripts and hyphae = 490 transcripts; Fig 6C; S27 Data) and reasoned that these transcripts encoded proteins with biological functions that are specific to a given cell type.

Since protein abundance in a cell is influenced by both transcript levels as well as the rate at which transcripts are translated, we also examined the translational efficiency of transcripts in yeast and hyphal cells. Clustering of yeast and hyphal TE values for transcripts that exhibited translational regulation highlighted at least 6 categories of translational regulation between yeast and hyphae (Fig 6D; S28–S29 Data). Most noticeably, we identified a large class of genes with low translational efficiency in both yeast and hyphae (Fig 6D - Category B); not surprisingly many transcripts in this category encode proteins that are not expected to serve a function in Hc vegetative yeast or hyphae under the growth conditions used in these experiments. For example, genes predicted by homology to be involved in mating/meiosis (HOP1, MEI2, STE2, STE6), light sensing during circadian rhythm (WHC2), as well as conidial (asexual spore) development and biology (CATA, RDS1, CON132) showed low levels of translational efficiency in both yeast and hyphal cells. We also found many transcripts with robust translational efficiency in both cell types (Fig 6D - Category E) that included genes involved in routine cellular functions such as fatty acid biosynthesis (ACC1, FOX2, FAA1), cytoskeletal organization (ACT1, BUD6, ARP1, SLA1), and nuclear and mitochondrial transport (KAP95, TOM20, KAP108, TIM16). Categories where we observed translational efficiency differences between yeast and hyphae (Fig 6D - Category A, C, D, F) included some previously identified yeast and hyphal-enriched transcripts, indicating that a subset of cell-type enriched transcripts are regulated at both the transcriptional and translational level by the temperature-dependent developmental program.
A subset of longer leader transcripts exhibit altered translational outcomes
Having established ribosome profiling as a method to measure ribosome occupancy and translational efficiency in Hc yeast and hyphae genome-wide, we next examined the translational outcomes of differential leader transcripts. Comparing yeast and hyphal TE values for the set of longer leader transcripts revealed that many exhibited altered translational regulation compared to their cognate shorter transcript isoforms (Figs 7 and S14; S30–S33 Data). Correlation of ribosome footprint densities on differential leader regions with changes in TE values (by examining a 2 or 1.5 fold change in CDS TE) between short and long transcript forms resulted in classification of leaders into broad regulatory patterns (Figs 8 and S15). The most striking pattern we observed was differential leader ribosome density that correlated with a decrease in TE, reminiscent of uORF mechanisms of translational repression (Fig 8 - Category a). We also observed longer leaders with no ribosome density and strong repression of downstream CDS translation (Fig 8 - Category d) via unknown mechanisms. In addition, we found examples of robust leader ribosome occupancy that resulted in no change to the TE, which may represent cases of N-terminal protein extensions and uORFs that don’t influence translation of the CDS (Fig 8 - Category b). Together these data suggest that as many as half of the observed longer leaders may be involved in translational repression of the associated CDS. The features distinguishing such regulatory leaders remain to be elucidated experimentally.


While examining longer leader transcripts that exhibited strong repression of CDS translation (Fig 8 - Category a, d), we noticed that many of these transcripts had longer leaders in the yeast phase and were additionally regulated at the level of transcription between yeast and hyphae (Fig 7A). Specifically, a subset of yeast-phase longer leader transcripts were transcriptionally and translationally repressed in yeast cells, yet were robustly transcribed and translated in hyphae (Fig 7A - red box). To validate whether these ribosomal profiling data corresponded to levels of protein accumulation, we expressed GFP under the control of the MS95 longer leader transcript promoter and leader region (MS95p) in Hc cells and examined GFP protein production at 37°C and RT. MS95 has a longer leader transcript form in yeast cells that exhibits lower translational efficiency compared to its shorter hyphal form (S16A Fig). Assessment of GFP protein levels by Western blot in Hc cells expressing the MS95p – GFP construct and grown at 37°C or RT recapitulated the differential protein expression pattern we inferred from ribosome profiling (S16B and S16C Fig). Namely, the MS95 upstream region restricts expression at 37°C, but allows robust transcription and translation at RT. Why Hc cells tightly restrict expression of Ms95 at 37°C is unclear as the biological function of Ms95, a homolog of the DNA damage and heat-stress responsive protein Ddr48 in S. cerevisiae, remains unknown.
Dysregulation of a longer leader transcript influences Histoplasma cell fate
Much precedence exists for cells to employ translational regulation to achieve tight spatial or temporal control of protein expression during developmental processes [53]. In this vein, we noticed that some longer leader transcripts have been implicated in governing Hc cell fate decisions. Both RYP2 and RYP3, master regulators of yeast cell morphology, have longer leader regions in hyphal cells. RYP2 has ribosome density in its differential leader region and lower TE of the RYP2 CDS in hyphae versus yeast (S17A Fig). The role of the RYP3 hyphal longer leader region is unclear as there is only a slight reduction in TE of the RYP3 CDS in hyphae versus yeast (S17B Fig). Ryp2 and Ryp3 both associate with DNA to regulate transcription of yeast-phase enriched transcripts at 37°C; furthermore, disruption of RYP2 or RYP3 in Hc cells results in inappropriate hyphal growth of Hc at 37°C [9,54]. Thus, tight restriction of Ryp levels during cellular development may be a mechanism used by Hc to control appropriate morphology in response to temperature.
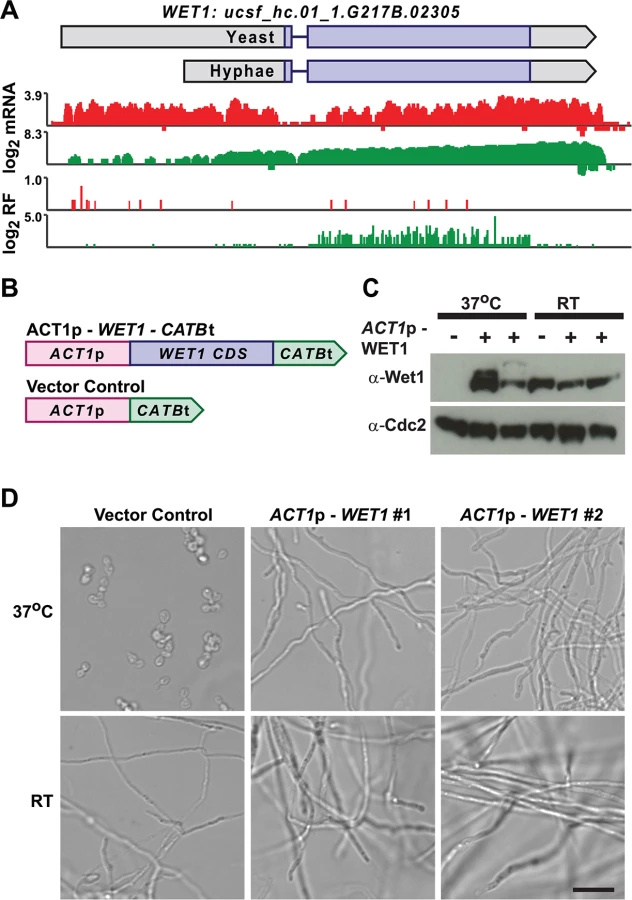
We mined Hc longer leader transcripts for additional candidates that could be involved in regulating cell fate decisions by identifying longer leader transcripts with transcription factor domains or homology to developmental regulators in other fungal species. This approach identified 14 putative developmental regulators with longer leader regions in Hc yeast or hyphal cells (S3 Table). One putative Hc developmental regulator we identified was WET1, which we named based on its homology to the Aspergillus nidulans regulator of conidial (asexual spore) development, WetA [13,55]. WET1 has a longer leader sequence in Hc yeast cells and its CDS region is translationally repressed in yeast while the shorter hyphal transcript form has robust ribosome CDS occupancy in hyphae (Fig 9A). To explore the idea that regulators of Hc developmental programs include longer leader transcripts that are tightly regulated between yeast and hyphal cell types, we placed the CDS of WET1 under the control of a heterologous Hc promoter, ACT1p (Fig 9B). Importantly ACT1 is not differentially translationally or transcriptionally regulated between Hc yeast and hyphae. Ectopic expression of this ACT1p – WET1 construct in Hc yeast cells resulted in inappropriate hyphal growth of Hc at 37°C (as compared to vector control cells; Fig 9C and 9D), while expression of the ACT1p – WET1 construct had no discernible effect on Hc hyphal morphology at RT (as compared to vector control cells; Fig 9D). These data indicate that restricting Wet1 expression in yeast-phase cells is critical for maintenance of the yeast cell developmental program and that Hc longer leader transcripts are interesting candidates for Hc developmental regulators.
Discussion
Here we present improved transcript models for multiple clinical Histoplasma isolates as well as the first look at the translational landscape of this medically relevant human fungal pathogen. Through this work we find that Hc alters transcript leader length between its morphologic cell types for a subset of its transcriptome. Transcript leader length is a biologically regulated outcome of transcription in Hc as our work uncovers many examples of leader extensions (187 transcripts) that are evolutionarily conserved across Hc phylogenetic lineages. Ribosome and mRNA density measurements of longer leader transcripts reveal a class of genes that are under tight translational and transcriptional regulation. Further examination of this group of transcriptionally and translationally regulated genes indicated that some are involved in controlling Hc morphology and that their strict regulation may be necessary for appropriate developmental decisions.
Our ribosome profiling experiments suggested mechanisms of translational regulation for longer leader transcript CDS regions. Namely, we observed cases where ribosome density on longer leader regions correlated with reduced translational efficiency of the downstream CDS, suggesting that this class of transcripts may be translationally repressed via well-studied mechanisms of uORF-mediated translational control [56]. Alternatively, we observed cases of translationally repressed CDS regions of longer leader transcripts with no evidence of ribosome occupancy on the leader, indicating that translational repression may be regulated via uORF-independent mechanisms. Future work will be needed to examine mechanisms of translational repression for this class of transcripts such as changes to mRNA secondary structure of the leader that inhibit ribosome scanning or cell-type specific factors that regulate ribosome function. For example, leader sequences could specify subcellular localization of mRNAs, which could inhibit (or facilitate) translation. Lastly, we identified longer leader transcripts that exhibited ribosome footprint density in the leader region directly upstream of the predicted CDS with little effect on translational efficiency. We suspect that some of these longer leader transcripts could serve to encode alternate protein variants and thus represent cases where leader extensions increase proteome diversity. We must also emphasize that some of our longer leader transcripts appear to be part of a complex mixture of transcript isoforms of varying sizes (as seen by Northern blot; see S11 Fig), which will complicate future mechanistic analyses.
The mechanism by which differential leader sequences are specified by distinct cellular states is yet to be determined. One of several possibilities is that a particular transcript initiation site may be occluded in one state by protein complexes that associate with the DNA. Intriguingly, we observed that 13 of the 49 transcripts with a longer leader sequence in the hyphal phase (including Ryp2; see S17A Fig) show association of the corresponding DNA with a yeast-enriched protein complex (p = .0015, given 785 total Ryp associated transcripts). Specifically, in the yeast-form at 37°C, these genes are bound by the Ryp proteins [9], which are yeast-enriched transcription factors that are required for yeast-phase development. It is possible that the physical presence of the Ryp complex on the DNA at 37°C could interfere with production of the longer-leader transcript; consequently the longer transcript isoform appears only in hyphal cells at room temperature. This model is appealing because it ties the presence of state-specific transcription factors to state-specific transcript architecture.
It is accepted that metazoans employ translational regulation to precisely tune gene expression during developmental processes [53]. Additionally, pathogens can regulate virulence factors at the translational level using host cues, such as temperature, to induce virulence factor expression once in the host environment [57,58]. Thus, translational control is a mechanism that can be used to quickly or precisely regulate gene expression during cellular development and pathogenesis. However, the biological function of many of the translationally regulated longer leader transcripts in Hc is unknown, making the context and significance of their translational regulation difficult to deduce at this time. We hypothesize that longer leader transcripts that are translationally repressed in the yeast phase could play a role in regulating hyphal growth or promoting morphogenesis in response to a change in temperature from 37°C to RT. Repression of such genes during yeast-phase growth would be critical to prevent inappropriate hyphal growth, which we have demonstrated for the longer leader transcript WET1. Alternatively, longer leader transcripts that are translationally repressed in hyphae could be tightly regulated for appropriate expression during Hc pathogenesis (since yeast cells are the disease-causing host form of Hc). Ultimately, a better understanding the biological function of translationally regulated longer leader transcripts will inform ideas for how Hc cells use translation (or appear to use changes in transcript structure) to regulate expression of a subset of the transcriptome.
In addition to uncovering examples of extended leader transcripts that exhibit distinct modes of translational regulation, our work provides a better foundation for understanding the biology and pathogenesis of the human pathogen Histoplasma. For example, our discovery of an expansion of knottin family proteins was enabled by the identification of small transcripts that show conserved enriched expression in the parasitic phase of this organism. Additionally, as with many organisms, it is becoming apparent that the regulation of Hc gene expression and transcript architecture is more complex and nuanced than previously appreciated. For example, our work demonstrates that both transcriptional and translational regulation contribute to the yeast and hyphal developmental programs. By deciphering the transcript structures, transcript expression patterns, as well as identifying novel orthogroups that likely encode short peptide products and regulatory RNAs across Hc lineages, we have laid the groundwork for a deeper understanding of the Hc strains that cause a wide variety of disease complications in the human host.
Materials and Methods
Strains and culture conditions
Histoplasma capsulatum (Hc) strains G217B (var. capsulatum; ATCC 26032), G217Bura5Δ (var. capsulatum; WU15), G186AR (var. capsulatum; ATCC 26029) were all gifts from the laboratory of William Goldman, University of North Carolina, Chapel Hill. H88 (var. duboisii; ATCC 32281) and H143 (var. capsulatum; CBS 287.54) were obtained from the American Type Culture Collection and Centraalbureau voor Schimmelcultures, respectively. Hc strains were routinely grown in HMM (Histoplasma-macrophage medium) broth or plates [59] or Sabouraud dextrose (Difco, BD, San Jose, CA) agar plates. Media was supplemented with 200 μg/mL of uracil (Sigma-Aldrich, St. Louis, MO) where indicated. Hc cultures were grown at 37°C under 5% CO2 for yeast-phase growth or at room temperature (RT) for hyphal-phase growth with continuous shaking of liquid cultures on an orbital shaker.
Paired-end RNA sequencing
G217B, G186AR, H88, and H143 yeast cells were inoculated from HMM agarose plates into HMM liquid medium for yeast-phase growth. Yeast cells were passaged at a 1 : 25 dilution three times and 2-day cultures of each strain were harvested for RNA collection after the third passage. For hyphal cells, G217B, G186AR, H88, and H143 hyphae were inoculated from Sabouraud dextrose agar plates grown at RT into HMM liquid medium. Hyphal cells were grown for 4–6 weeks with passaging 3 times (1 : 5 dilution) into fresh HMM medium at RT before reaching a sufficient density of cells for harvesting. Hyphal and yeast cells were collected by centrifugation or filtration and total RNA was isolated using a guanidine thiocyanate lysis protocol as previously described [13]. Paired-end RNA-seq libraries were made from biological duplicate cultures of G217B, G186AR, H88, and H143 for both yeast and hyphae. DNA was depleted from 10–20 μg of total RNA by 1 hour of DNaseI digestion at 37°C (Ambion by Life Technologies, Carlsbad, CA). Poly(A)+ RNA was selected from DNA-depleted RNA on oligo-dT25 DynaBeads (Invitrogen by Life Technologies) using 2 rounds of selection per the manufacturer’s instructions. Approximately 50 ng of poly(A)+ RNA was used as input for generating sequencing libraries with the ScriptSeq v2 RNA-Seq Library Preparation Kit (Epicentre, Madison, WI) per the manufacturer’s instructions with the following modifications. After 11 cycles of the ScriptSeq v2 PCR cDNA amplification step, cDNA libraries were resolved on an 8% TBE gel (Invitrogen by Life Technologies) and a 350–500 bp range of cDNA library was excised, eluted, and precipitated from the gel. Seven additional PCR cycles were resumed following the ScriptSeq v2 Kit protocol. cDNA libraries were purified with AMPure XP beads (Beckman Coulter, Brea, CA) to deplete primers. Libraries were multiplexed and subjected to 100 bp paired-end sequencing using the Illumina HiSeq2000 sequencer (Illumina, San Diego, CA).
Sources of Histoplasma genome assembly and annotation
Throughout this work, the following sources of Hc genomic sequences and gene predictions were used: version 2 of the H88, H143, and G168AR genome assemblies and predicted gene sets from the BROAD Institute, retrieved on 6/15/2011 from http://www.broadinstitute.org/annotation/genome/dimorph_collab/MultiDownloads.html and the 11/30/2004 version of the G217B genome assembly and 9/21/2005 predicted gene set from the Genome Sequencing Center at Washington University (GSC) as mirrored at http://histo.ucsf.edu/downloads/.
Genome-guided transcriptome assembly from paired-end reads
We used a genome-guided approach to assemble Hc transcriptomes independently for each of the 4 Hc strains from our paired-end sequencing data. The bulk of our analysis was based on combining reads from all yeast and hyphal biological replicates in a given strain. For the longer leader analysis, we also assembled state-specific transcriptomes using only yeast or hyphal reads. In all cases, the same assembly pipeline was applied, as outlined in Fig 2A and described below.
Paired-end reads were pre-processed to remove high copy sequences that were not of interest; specifically, all read pairs were searched against the mitochondrial genome, a representative full length MAGGY transposon, and the 45S rDNA locus using bowtie2 version 2.0.0-beta7 [60] with a minimum fragment length (-I) of 50 and a maximum fragment length (-X) of 800. Read pairs that did not align to the above sequences were aligned to the appropriate genome assembly (GSC assembly for G217B, BROAD assembly for G186AR, H88, and H143) using GSNAP [61] with parameters based on the alignReads.pl script from TRINITY [62] (allowing novel splice sites (-N 1), up to 20 alignments per pair (-n 20), and up to 10 kb introns (-w 10000)). Transcribed fragments (transfrags) were initially defined as contiguous genomic regions with GSNAP-based read coverage > = 8 reads/base. Initial transcripts were then assembled by joining transfrags separated by no more than 2300 bases and spanned by at least 6 single reads or read pairs. Introns were annotated as GSNAP-identified splice sites falling within the initial transcripts. Where multiple splice sites spanned the same genomic location, only the splice site supported by the greatest number of aligned reads was annotated as an intron. Transcripts were identified as antisense artifacts and removed if they met either of the following criteria: 1) all splice junctions in the transcript were CT-AC (antisense to the canonical GT-AG); 2) the transcript was completely spanned by a higher abundance transcript on the opposite strand and contained either no introns or at least one non-canonical splice junction. Initial coding sequences (CDS) were then annotated as the largest open reading frame (ORF) in each transcript, with a minimum ORF size of 60 codons. This initial assembled transcript set contained fusions due to adjacent, same-strand transcripts separated by intergenic regions that were small or non-existent (e.g., due to overlapping 3' and 5' ends). We addressed this assembly artifact by identifying initial transcripts spanning multiple gene predictions. Specifically, we identified all ORFs greater than 60 bp within each initial transcript, then looked for same-strand overlaps between these ORFs and the upstream predicted protein sets (from the GSC or the BROAD); where an initial transcript contained ORFs that mapped independently to at least two different sets of predicted proteins, such that an untranslated subsequence of the transcript divided the two sets without overlapping either, the transcript was split at the midpoint of the dividing subsequence, and the CDS of the resulting transcripts were reannotated as the largest ORF of at least 60 bp.
For the pooled transcriptome assembly, transcripts were named as ucsf_hc.01_1.(strain).(gene_id), where strain is G217B, G186AR, H88, or H143 and gene_id is a five digit, zero padded integer. For the state-specific transcriptome assemblies, transcripts were named as ucsf_hc.01_1.(strain)(state).(gene_id), where state is Y or H for yeast and hyphae, respectively, and the remaining fields are as above. gene_id is unique within a given transcriptome assembly, and there is no deliberate correspondence among gene_id values from different assemblies.
Defining orthogroups and ortholog pairs across Histoplasma strains
For ortholog assignment by InParanoid [19], InParanoid version 1.35 was run with default parameters and no outgroup for each pair of Hc strains, using either predicted or assembled protein sequences as inputs.
For orthologroup assignment by Mercator [18], Mercator version 0.4 (compiled from commit 991c85a of the cndsrc git repository: http://www.biostat.wisc.edu/~cdewey/software/cndsrc.git) was run in draft mode on the 4 Hc genome assemblies using all-against-all BLASTP searches of the assembled protein sets as anchors. This resulted in 5509 complete orthogroups (containing one gene from each strain) and 2356 incomplete orthogroups. In order to find orthologous genes present in the transcript assemblies but missing from the BLASTP searches due to inappropriate CDS annotations, protein sequences from incomplete orthologs were searched against the genome assemblies of missing strains using TBLASTN [20] with soft masking and an expect threshold of 1e-6, then finding the assembled transcript with greatest same-strand overlap to the top TBLASTN hit; transcripts detected this way were added to the existing orthogroups, as long as TBLASTN searches with each member of the orthogroup did not detect different transcripts and multiple orthogroups did not detect the same transcript. Application of this TBLASTN-based strategy resulted in an additional 1282 complete ortholog groups, for a total of 6791.
BLAST runs for both InParanoid and Mercator were carried out with version 2.2.26 of NCBI BLAST
Quantification of mRNA expression from paired-end reads
Relative abundances (reported as FPKM values [63,64]) for each transcript in each sample were estimated by aligning read pairs to the transcriptome assembly for the corresponding genome with bowtie2 version 2.0.0-beta7 [60] with a maximum fragment length (-X) of 800, allowing all alignments (-a), and submitting the output to eXpress version 1.3.1 [25] specifying strand-specific read pairs (—fr-stranded). Transcripts with FPKM values ≤ 1.0 in yeast or hyphae were clipped to a value of 0. FPKM Y/H values were median normalized per strain using transcripts with FPKM values ≥ 10.0
Protein annotation
Assembled CDS were annotated with Pfam domains by searching all protein sequences against version 27.0 of Pfam-A [21] with hmmscan from HMMer 3.0 (http://hmmer.org/). A Pfam domain was considered to be conserved if it was matched by at least 3 ORFs in a given orthogroup.
Assembled CDS were annotated as secreted if a signal peptide was detected in the corresponding protein sequence by Phobius version 1.01 [23].
Knottin phylogeny
The curated Fungi1 alignment was downloaded from the KNOTTIN database [34] and trimmed to the conserved cysteine residues plus 10 residues of padding on either side (alignment positions 423 through 483, counting from 1). Hmmer 3.0 (http://hmmer.org) was used to build an HMM from the trimmed alignment and to search the resulting model against the Hc assembled transcriptomes, predicted gene sets for 41 fungal genomes (see S18 Data), and the curated Fungi1 sequences using an expect threshold of 1 e-2, yielding 167 total hits, 121 of which corresponded to unique (non-redundant) genes. Non-redundant hits were aligned to the HMM with hmmalign, and a phylogenetic tree was inferred from the aligned positions using fasttree2 [65]. The phylogenetic tree is available as supplementary file 16 and the protein alignment is available as S17 Data.
To generate the tree in Fig 3B, the full tree was pruned to the Hc G217B assembled transcripts plus additional sequences representative of the diversity of the G217B-containing clades, maintaining the topology and branch lengths of the full tree. To generate the reduced alignment shown in Fig 3C, the full alignment was reduced to just the Hc G217B assembled transcripts and AVR9, and adjusted with the following manual improvements: removing gap-only columns, removing staggered gaps at the N-terminus to improve the alignment of the aliphatic/aromatic position at +3 relative to the first cysteine, removing gaps at the C-terminus of ucsf_hc.01_1.G217B.08018 to align the final cysteine, and trimming all sequences to the aligned AVR9 positions.
Generation of ribosome footprint libraries
Biological duplicates of G217B yeast cells were grown at 37°C in HMM liquid medium to mid-log phase. Biological duplicates of G217B hyphal cells were grown for 4–6 weeks with passaging three times (1 : 5 dilution) into fresh HMM medium at RT before reaching a sufficient density of cells for harvesting. Hyphal and yeast cells were treated with 100 μg/mL cycloheximide for 2 minutes (MP Biomedicals, Santa Ana, CA) before harvesting of cells by filtration. Total RNA for mRNA library preparation was isolated from a small fraction of the total yeast or hyphal cells collected for ribosome profiling using a guanidine thiocyanate lysis protocol as previously described [13]. Ribosome profiling and matched mRNA-seq sample preparation and library building were performed as described [49], except that the 3′ linker ligation strategy was used instead of poly(A) tailing for marking and capturing the 3’ RNA end [50]. Libraries were multiplexed and subjected to 50 bp single-end sequencing with an Illumina HiSeq2000 sequencer (Illumina).
Mapping and quantification of ribosome footprint and corresponding mRNA reads
The strand-specific, single-end reads from the matched mRNA and ribosome footprint samples were processed identically, except as noted. Due to the relatively short lengths of these reads, alignment steps were performed with bowtie version 0.12.7 [66], rather than the bowtie2/GSNAP approach used for the paired-end data.
Reads were pre-processed by stripping 3' sequence matching the primer linker sequence, allowing 20% mismatches, filtering any reads that were less than 11 bp after linker stripping, and additionally filtering for matches to the mitochondrial, MAGGY, and rDNA sequences described above (see paired-end read assembly) using bowtie with default parameters.
The remaining, linker-stripped sequences were mapped to the genome with bowtie, restricting the output to unique alignments (-k1) and post-filtered for full length alignments of the query sequences. We noted a strong bias for T mismatches in the first aligned position, consistent with previously observed terminal nucleotidyl transferase activity of reverse transcriptase [67]; to address this, we removed all first position T mismatches, treating the second aligned position as the true 5' of the sampled fragment for the remaining steps. Other than this special treatment of the first position, all alignments were required to be perfect matches between query and genome sequence. Aligned sequences were required to be at least 22 bp and, for ribosome footprint samples only, no more than 32 bp.
For alignments passing the above criteria, the 13th aligned position, inferred to correspond to the ribosomal P-site for ribosome footprint samples, was taken as the location of the mapped read.
Assembled transcript FPKMs for each sample were calculated as the number of reads located in the CDS of that transcript, divided by the length of that CDS in kilobases and the total number of CDS-mapped reads for the sample in millions. The same formula was used for quantifying ribosome footprints in leader regions, defining the leader as all transcript sequence 5' of the first CDS position, and normalizing by the length of the leader and the total number of CDS-mapped reads (to allow direct comparison of CDS and leader FPKMs).
Identifying longer leader transcripts
Yeast and hyphae per-state assembled transcript calls were used to identify transcripts with differential leader regions. Leader regions were calculated as the distance from the start of the 5’ transcript end to the beginning of the predicted CDS. Leaders were defined as differential between Hc cell types if the change in size of the yeast and hyphal leader lengths was measured to be ≥ 100 bp in 3 out of 4 Hc strains in the per-state transcript assemblies. Transcripts meeting these criteria were further evaluated manually to determine whether the observed mapped read density supported a 5’ transcript extension in one cell type. For assessment of translational efficiency and ribosome occupancy of longer leader transcripts, the set of conserved longer leader transcripts were further manually evaluated against the G217B mRNA read coverage from the ribosome profiling experiments to ensure that the observed mapped read density supported a 5’ transcript extension in one cell type.
Clustering
Cluster 3.0 was used to perform hierarchical clustering of genes using an uncentered Pearson correlation [68,69]. Clustered data was visualized using Java Treeview 1.1.4r4 (available at http://jtreeview.sourceforge.net) [70].
MS95p –GFP time course
2781 bp of the MS95 promoter/leader region (MS95p), 1045 bp of the GAPDH promoter (GAPDHp), and 729 bp of the CATB terminator (CATBt) were amplified from G217B gDNA and assembled into a Gateway entry vector pDONR/Zeo (Life Technologies) containing enhanced GFP (eGFP) using a CPEC cloning strategy [71]. This generated BAS1464 (MS95p –eGFP–CATBt) and BAS1514 (GAPDHp–eGFP–CATBt) constructs. All primer sequences are included in S4 Table. Using LR Gateway cloning (Life Technologies) each pDONR/Zeo entry vector was recombined into the Hc episomal expression vector pDG33 (pDG33 is a derivative of pWU55 [72] with Hc URA5 added for selection and made Gateway compatible). The episomally-maintained positive control (GAPDHp–eGFP–CATBt) and MS95p –eGFP–CATBt constructs were electroporated into G217Bura5Δ as previously described [72].
G217Bura5Δ strains transformed with the GAPDHp and MS95p eGFP constructs were grown at 37°C to late log phase, diluted 1 : 25 into 5 mL HMM medium for growth at 37°C or 1 : 10 into 10 mL HMM medium for growth at RT. At 1 d, 2 d, and 3 d post-inoculation, cells were harvested by centrifugation and protein and RNA was isolated simultaneously from each 37°C or RT culture using Qiazol (Qiagen, Netherlands) following the manufacturer’s instructions.
Ectopic expression of WET1
The Hc WET1 coding sequence, 1035 bp of the ACT1 promoter (ACT1p), and 729 bp of the CATB terminator (CATBt) were amplified from G217B gDNA and assembled into the Gateway entry vector pDONR/Zeo (Life Technologies) using restriction enzymes to generate BAS1504. A vector control construct, BAS252, was generated identically except lacking the WET1 CDS. Using LR Gateway cloning (Life Technologies) each pDONR/Zeo entry vector was recombined into the Hc episomal expression vector pDG33 (pDG33 is a derivative of pWU55 [72] with Hc URA5 added for selection and made Gateway compatible). The episomally-maintained vector control (ACT1p –CATBt) and ACT1p –WET1 –CATBt constructs were electroporated into G217Bura5Δ as previously described [72]. Protein and RNA was isolated simultaneously from each 37°C or RT culture using Qiazol (Qiagen, Netherlands) following the manufacturer’s instructions.
Cell morphology of vector control and WET1-expressing cells was determined using differential interference contrast (DIC) microscopy with a Yokogawa CSU-X1 (Yokogawa, Tokyo, Japan) spinning disk confocal mounted on a Nikon Eclipse Ti inverted microscope (Nikon, Tokyo, Japan) with a PLAN APO 40X objective (Nikon) and an Andor Clara digital camera (Andor, Belfast UK). Images were acquired by and processed in NIS-Elements software 4.10 (Nikon).
Western blotting
10–20 μg of protein was resolved on a 4–12% NuPAGE Bis-Tris gel (Life Technologies) in MOPS buffer. For detecting endogenous levels of Wet1, a rabbit polyclonal peptide antibody was raised (Covance, Princeton, NJ) against Wet1 (epitope: KTKARREQEAREKRRKLS; ID: CA2890). GFP was detected using a mouse anti-GFP antibody (Roche Applied Bioscience, Indianapolis, IN; 11814460001). Equivalency of protein levels between samples was assessed with a rabbit antibody against Cdc2 (Santa Cruz Biotechnology, Santa Cruz, CA; sc-53).
Northern blotting
5–10 μg of total RNA was separated on a 1.5% denaturing agarose-formaldehyde gel and transferred to a positively charged nylon membrane (Roche Applied Bioscience or PerkinElmer, Waltham, MA). Northern probes were generated with gene specific primers by amplifying ~ 200–500 bp of transcript from genomic DNA. Primer sequences are given in S4 Table. 100–150 ng of each DNA probe was labeled using the High Prime DNA Labeling Kit (Roche Applied Bioscience) and [α – 32P] dCTP (PerkinElmer). Membranes were blocked in UltraHybe hybridization buffer (Ambion, Life Technologies) for at least 30 minutes and denatured probe was added to the same blocking buffer and incubated at 42°C overnight. The next day membranes were washed twice in 2X SSC, 0.1% SDS for 5 minutes and twice in 0.1X SSC, 0.1% SDS for 15 minutes at 42°C before exposure to a phosphorimager screen (GE Life Sciences, Pittsburgh, PA). Screens were scanned with a Fuji FLA-5100 imager and analyzed with Multi Gauge Software (ver. 3.1; Fujifilm/GE Life Sciences).
Categorization of ribosome density patterns on longer leader transcripts
Patterns of ribosome occupancy on G217B yeast and hyphal longer leader transcripts were used to determine categories of translational regulation. Categories were defined as follows: a: Ribosome density on longer leader region and decreased differential TE for CDS of longer leader transcript, b: Ribosome density on longer leader region and no change in TE for CDS of longer leader transcript, c: Ribosome density on longer leader region and increased TE for CDS of longer leader transcript, d: No ribosome density on longer leader region and decreased TE for CDS of longer leader transcript, e: No ribosome density on longer leader region and no change in TE of CDS for longer leader transcript, f: No ribosome density on longer leader region and increased TE for CDS of longer leader transcript. g: Ribosome profiling reads used to calculate TE CDS values are below the limit of accurate measurement (< 128 counts) in at least one cell type. We examined these categories using two different fold cut-offs for CDS TE values: a change in TE was defined as ≥ 1.5 fold (shown in S15 Fig) or ≥ 2 fold (shown in Fig 8). FPKM values and raw counts of ribosome density on leader regions were used to assist in determining the presence of ribosome density in differential leader regions after manual examination of the location of the footprint density. After manual confirmation of the location of footprint reads on each leader region, leaders with greater than 10 footprint reads in the differential leader region were considered to have ribosome density.
Other software and libraries
MochiView [73] and IGV [74] were used to visualize sequencing reads. All statistical calculations were carried out in R 2.15.1 [75]. We wrote custom scripts and generated plots in Python 2.7, using the following open-source libraries: NumPy 1.6.2 and SciPy 0.10.1 [76], NetworkX 1.7rc1 [77], and Matplotlib 1.1.1rc2 [78]. IPython notebooks were used for interactive data exploration and collaboration [79].
Transcriptome assembly gff3 files/GEO accession
Transcriptome assembly data for each Hc strain (G217B, G186AR, H88, and H143) are available as genomic features gff3 files (generic feature format version 3) (S1–S4 Data; S19–S26 Data). For high-throughput sequencing data, the raw data are available at the NCBI Sequence Read Archive (SRA) and Gene Expression Omnibus (GEO) databases [80,81] under GEO SuperSeries accession GSE68707.
Supporting Information
Zdroje
1. Emmons CW (1949) Isolation of Histoplasma capsulatum from soil. Public Health Rep 64 : 892–896. 18134389
2. Gugnani HC, Muotoe-Okafor FA, Kaufman L, Dupont B (1994) A natural focus of Histoplasma capsulatum var. duboisii is a bat cave. Mycopathologia 127 : 151–157. 7808510
3. Holbrook ED, Rappleye CA (2008) Histoplasma capsulatum pathogenesis: making a lifestyle switch. Curr Opin Microbiol 11 : 318–324. doi: 10.1016/j.mib.2008.05.010 18573684
4. Kauffman CA (2009) Histoplasmosis. Clin Chest Med 30 : 217–225, v. doi: 10.1016/j.ccm.2009.02.002 19375629
5. Chu JH, Feudtner C, Heydon K, Walsh TJ, Zaoutis TE (2006) Hospitalizations for endemic mycoses: a population-based national study. Clin Infect Dis 42 : 822–825. 16477560
6. Brown GD, Denning DW, Gow NA, Levitz SM, Netea MG, et al. (2012) Hidden killers: human fungal infections. Sci Transl Med 4 : 165rv113.
7. Kasuga T, White TJ, Koenig G, McEwen J, Restrepo A, et al. (2003) Phylogeography of the fungal pathogen Histoplasma capsulatum. Mol Ecol 12 : 3383–3401. 14629354
8. Nguyen VQ, Sil A (2008) Temperature-induced switch to the pathogenic yeast form of Histoplasma capsulatum requires Ryp1, a conserved transcriptional regulator. Proc Natl Acad Sci U S A 105 : 4880–4885. doi: 10.1073/pnas.0710448105 18339808
9. Beyhan S, Gutierrez M, Voorhies M, Sil A (2013) A temperature-responsive network links cell shape and virulence traits in a primary fungal pathogen. PLoS Biol 11: e1001614. doi: 10.1371/journal.pbio.1001614 23935449
10. Edwards JA, Chen C, Kemski MM, Hu J, Mitchell TK, et al. (2013) Histoplasma yeast and mycelial transcriptomes reveal pathogenic-phase and lineage-specific gene expression profiles. BMC Genomics 14 : 695. doi: 10.1186/1471-2164-14-695 24112604
11. Rappleye CA, Goldman WE (2006) Defining virulence genes in the dimorphic fungi. Annu Rev Microbiol 60 : 281–303. 16753032
12. Inglis DO, Voorhies M, Hocking Murray DR, Sil A (2013) Comparative transcriptomics of infectious spores from the fungal pathogen Histoplasma capsulatum reveals a core set of transcripts that specify infectious and pathogenic states. Eukaryot Cell 12 : 828–852. doi: 10.1128/EC.00069-13 23563482
13. Hwang L, Hocking-Murray D, Bahrami AK, Andersson M, Rine J, et al. (2003) Identifying phase-specific genes in the fungal pathogen Histoplasma capsulatum using a genomic shotgun microarray. Mol Biol Cell 14 : 2314–2326. 12808032
14. Gilmore SA, Naseem S, Konopka JB, Sil A (2013) N-acetylglucosamine (GlcNAc) triggers a rapid, temperature-responsive morphogenetic program in thermally dimorphic fungi. PLoS Genet 9: e1003799. doi: 10.1371/journal.pgen.1003799 24068964
15. Kasuga T, Taylor JW, White TJ (1999) Phylogenetic relationships of varieties and geographical groups of the human pathogenic fungus Histoplasma capsulatum Darling. J Clin Microbiol 37 : 653–663. 9986828
16. Cockshott WP, Lucas AO (1964) Histoplasmosis Duboisii. Q J Med 33 : 223–238. 14152972
17. Kwon-Chung KJ (1975) Perfect state (Emmonsiella capsulata) of the fungus causing large-form African histoplasmosis. Mycologia 67 : 980–990. 1196334
18. Dewey CN (2007) Aligning multiple whole genomes with Mercator and MAVID. Methods Mol Biol 395 : 221–236. 17993677
19. Remm M, Storm CE, Sonnhammer EL (2001) Automatic clustering of orthologs and in-paralogs from pairwise species comparisons. J Mol Biol 314 : 1041–1052. 11743721
20. Altschul SF, Madden TL, Schaffer AA, Zhang J, Zhang Z, et al. (1997) Gapped BLAST and PSI-BLAST: a new generation of protein database search programs. Nucleic Acids Res 25 : 3389–3402. 9254694
21. Finn RD, Bateman A, Clements J, Coggill P, Eberhardt RY, et al. (2014) Pfam: the protein families database. Nucleic Acids Res 42: D222–230. doi: 10.1093/nar/gkt1223 24288371
22. Kall L, Krogh A, Sonnhammer EL (2007) Advantages of combined transmembrane topology and signal peptide prediction—the Phobius web server. Nucleic Acids Res 35: W429–432. 17483518
23. Kall L, Krogh A, Sonnhammer EL (2004) A combined transmembrane topology and signal peptide prediction method. J Mol Biol 338 : 1027–1036. 15111065
24. Derrien T, Johnson R, Bussotti G, Tanzer A, Djebali S, et al. (2012) The GENCODE v7 catalog of human long noncoding RNAs: analysis of their gene structure, evolution, and expression. Genome Res 22 : 1775–1789. doi: 10.1101/gr.132159.111 22955988
25. Roberts A, Pachter L (2013) Streaming fragment assignment for real-time analysis of sequencing experiments. Nat Methods 10 : 71–73. doi: 10.1038/nmeth.2251 23160280
26. Sebghati TS, Engle JT, Goldman WE (2000) Intracellular parasitism by Histoplasma capsulatum: fungal virulence and calcium dependence. Science 290 : 1368–1372. 11082066
27. Youseff BH, Holbrook ED, Smolnycki KA, Rappleye CA (2012) Extracellular superoxide dismutase protects Histoplasma yeast cells from host-derived oxidative stress. PLoS Pathog 8: e1002713. doi: 10.1371/journal.ppat.1002713 22615571
28. Hwang LH, Mayfield JA, Rine J, Sil A (2008) Histoplasma requires SID1, a member of an iron-regulated siderophore gene cluster, for host colonization. PLoS Pathog 4: e1000044. doi: 10.1371/journal.ppat.1000044 18404210
29. Holbrook ED, Edwards JA, Youseff BH, Rappleye CA (2011) Definition of the extracellular proteome of pathogenic-phase Histoplasma capsulatum. J Proteome Res 10 : 1929–1943. doi: 10.1021/pr1011697 21291285
30. Shames SR, Finlay BB (2012) Bacterial effector interplay: a new way to view effector function. Trends Microbiol 20 : 214–219. doi: 10.1016/j.tim.2012.02.007 22425230
31. Stergiopoulos I, de Wit PJ (2009) Fungal effector proteins. Annu Rev Phytopathol 47 : 233–263. doi: 10.1146/annurev.phyto.112408.132637 19400631
32. Wood DL, Miljenovic T, Cai S, Raven RJ, Kaas Q, et al. (2009) ArachnoServer: a database of protein toxins from spiders. BMC Genomics 10 : 375. doi: 10.1186/1471-2164-10-375 19674480
33. Vervoort J, van den Hooven HW, Berg A, Vossen P, Vogelsang R, et al. (1997) The race-specific elicitor AVR9 of the tomato pathogen Cladosporium fulvum: a cystine knot protein. Sequence-specific 1H NMR assignments, secondary structure and global fold of the protein. FEBS Lett 404 : 153–158. 9119054
34. Gracy J, Le-Nguyen D, Gelly JC, Kaas Q, Heitz A, et al. (2008) KNOTTIN: the knottin or inhibitor cystine knot scaffold in 2007. Nucleic Acids Res 36: D314–319. 18025039
35. Pallaghy PK, Nielsen KJ, Craik DJ, Norton RS (1994) A common structural motif incorporating a cystine knot and a triple-stranded beta-sheet in toxic and inhibitory polypeptides. Protein Sci 3 : 1833–1839. 7849598
36. Werle M, Schmitz T, Huang HL, Wentzel A, Kolmar H, et al. (2006) The potential of cystine-knot microproteins as novel pharmacophoric scaffolds in oral peptide drug delivery. J Drug Target 14 : 137–146. 16753827
37. Moore SJ, Cochran JR (2012) Engineering knottins as novel binding agents. Methods Enzymol 503 : 223–251. doi: 10.1016/B978-0-12-396962-0.00009-4 22230571
38. Barbeta BL, Marshall AT, Gillon AD, Craik DJ, Anderson MA (2008) Plant cyclotides disrupt epithelial cells in the midgut of lepidopteran larvae. Proc Natl Acad Sci U S A 105 : 1221–1225. doi: 10.1073/pnas.0710338104 18202177
39. Lee SY, MacKinnon R (2004) A membrane-access mechanism of ion channel inhibition by voltage sensor toxins from spider venom. Nature 430 : 232–235. 15241419
40. Chiche L, Heitz A, Gelly JC, Gracy J, Chau PT, et al. (2004) Squash inhibitors: from structural motifs to macrocyclic knottins. Curr Protein Pept Sci 5 : 341–349. 15551519
41. Gelly JC, Gracy J, Kaas Q, Le-Nguyen D, Heitz A, et al. (2004) The KNOTTIN website and database: a new information system dedicated to the knottin scaffold. Nucleic Acids Res 32: D156–159. 14681383
42. Arribere JA, Gilbert WV (2013) Roles for transcript leaders in translation and mRNA decay revealed by transcript leader sequencing. Genome Res 23 : 977–987. doi: 10.1101/gr.150342.112 23580730
43. Pelechano V, Wei W, Steinmetz LM (2013) Extensive transcriptional heterogeneity revealed by isoform profiling. Nature 497 : 127–131. doi: 10.1038/nature12121 23615609
44. Brar GA, Yassour M, Friedman N, Regev A, Ingolia NT, et al. (2012) High-resolution view of the yeast meiotic program revealed by ribosome profiling. Science 335 : 552–557. doi: 10.1126/science.1215110 22194413
45. Law GL, Bickel KS, MacKay VL, Morris DR (2005) The undertranslated transcriptome reveals widespread translational silencing by alternative 5' transcript leaders. Genome Biol 6: R111. 16420678
46. Wang XQ, Rothnagel JA (2001) Post-transcriptional regulation of the gli1 oncogene by the expression of alternative 5' untranslated regions. J Biol Chem 276 : 1311–1316. 11032829
47. Tuch BB, Mitrovich QM, Homann OR, Hernday AD, Monighetti CK, et al. (2010) The transcriptomes of two heritable cell types illuminate the circuit governing their differentiation. PLoS Genet 6: e1001070. doi: 10.1371/journal.pgen.1001070 20808890
48. Badhai J, Schuster J, Gidlof O, Dahl N (2011) 5'UTR variants of ribosomal protein S19 transcript determine translational efficiency: implications for Diamond-Blackfan anemia and tissue variability. PLoS One 6: e17672. doi: 10.1371/journal.pone.0017672 21412415
49. Ingolia NT, Ghaemmaghami S, Newman JR, Weissman JS (2009) Genome-wide analysis in vivo of translation with nucleotide resolution using ribosome profiling. Science 324 : 218–223. doi: 10.1126/science.1168978 19213877
50. Dunn JG, Foo CK, Belletier NG, Gavis ER, Weissman JS (2013) Ribosome profiling reveals pervasive and regulated stop codon readthrough in Drosophila melanogaster. Elife 2: e01179. doi: 10.7554/eLife.01179 24302569
51. Ingolia NT, Lareau LF, Weissman JS (2011) Ribosome profiling of mouse embryonic stem cells reveals the complexity and dynamics of mammalian proteomes. Cell 147 : 789–802. doi: 10.1016/j.cell.2011.10.002 22056041
52. Lew RR (2011) How does a hypha grow? The biophysics of pressurized growth in fungi. Nat Rev Microbiol 9 : 509–518. doi: 10.1038/nrmicro2591 21643041
53. Sonenberg N, Hershey JWB, Mathews MB (2000) Translational Control of Gene Expression. Cold Spring Harbor, NY: Cold Spring Harbor Lab. Press.
54. Webster RH, Sil A (2008) Conserved factors Ryp2 and Ryp3 control cell morphology and infectious spore formation in the fungal pathogen Histoplasma capsulatum. Proc Natl Acad Sci U S A 105 : 14573–14578. doi: 10.1073/pnas.0806221105 18791067
55. Sewall TC, Mims CW, Timberlake WE (1990) Conidium differentiation in Aspergillus nidulans wild-type and wet-white (wetA) mutant strains. Dev Biol 138 : 499–508. 2180753
56. Hood HM, Neafsey DE, Galagan J, Sachs MS (2009) Evolutionary roles of upstream open reading frames in mediating gene regulation in fungi. Annu Rev Microbiol 63 : 385–409. doi: 10.1146/annurev.micro.62.081307.162835 19514854
57. Johansson J, Mandin P, Renzoni A, Chiaruttini C, Springer M, et al. (2002) An RNA thermosensor controls expression of virulence genes in Listeria monocytogenes. Cell 110 : 551–561. 12230973
58. Loh E, Kugelberg E, Tracy A, Zhang Q, Gollan B, et al. (2013) Temperature triggers immune evasion by Neisseria meningitidis. Nature 502 : 237–240. doi: 10.1038/nature12616 24067614
59. Worsham PL, Goldman WE (1988) Quantitative plating of Histoplasma capsulatum without addition of conditioned medium or siderophores. J Med Vet Mycol 26 : 137–143. 3171821
60. Langmead B, Salzberg SL (2012) Fast gapped-read alignment with Bowtie 2. Nat Methods 9 : 357–359. doi: 10.1038/nmeth.1923 22388286
61. Wu TD, Nacu S (2010) Fast and SNP-tolerant detection of complex variants and splicing in short reads. Bioinformatics 26 : 873–881. doi: 10.1093/bioinformatics/btq057 20147302
62. Grabherr MG, Haas BJ, Yassour M, Levin JZ, Thompson DA, et al. (2011) Full-length transcriptome assembly from RNA-Seq data without a reference genome. Nat Biotechnol 29 : 644–652. doi: 10.1038/nbt.1883 21572440
63. Trapnell C, Williams BA, Pertea G, Mortazavi A, Kwan G, et al. (2010) Transcript assembly and quantification by RNA-Seq reveals unannotated transcripts and isoform switching during cell differentiation. Nat Biotechnol 28 : 511–515. doi: 10.1038/nbt.1621 20436464
64. Mortazavi A, Williams BA, McCue K, Schaeffer L, Wold B (2008) Mapping and quantifying mammalian transcriptomes by RNA-Seq. Nat Methods 5 : 621–628. doi: 10.1038/nmeth.1226 18516045
65. Price MN, Dehal PS, Arkin AP (2010) FastTree 2—approximately maximum-likelihood trees for large alignments. PLoS One 5: e9490. doi: 10.1371/journal.pone.0009490 20224823
66. Langmead B, Trapnell C, Pop M, Salzberg SL (2009) Ultrafast and memory-efficient alignment of short DNA sequences to the human genome. Genome Biol 10: R25. doi: 10.1186/gb-2009-10-3-r25 19261174
67. Chen D, Patton JT (2001) Reverse transcriptase adds nontemplated nucleotides to cDNAs during 5'-RACE and primer extension. Biotechniques 30 : 574–580, 582. 11252793
68. Eisen MB, Spellman PT, Brown PO, Botstein D (1998) Cluster analysis and display of genome-wide expression patterns. Proc Natl Acad Sci U S A 95 : 14863–14868. 9843981
69. de Hoon MJ, Imoto S, Nolan J, Miyano S (2004) Open source clustering software. Bioinformatics 20 : 1453–1454. 14871861
70. Saldanha AJ (2004) Java Treeview—extensible visualization of microarray data. Bioinformatics 20 : 3246–3248. 15180930
71. Quan J, Tian J (2009) Circular polymerase extension cloning of complex gene libraries and pathways. PLoS One 4: e6441. doi: 10.1371/journal.pone.0006441 19649325
72. Woods JP, Heinecke EL, Goldman WE (1998) Electrotransformation and expression of bacterial genes encoding hygromycin phosphotransferase and beta-galactosidase in the pathogenic fungus Histoplasma capsulatum. Infect Immun 66 : 1697–1707. 9529100
73. Homann OR, Johnson AD (2010) MochiView: versatile software for genome browsing and DNA motif analysis. BMC Biol 8 : 49. doi: 10.1186/1741-7007-8-49 20409324
74. Robinson JT, Thorvaldsdottir H, Winckler W, Guttman M, Lander ES, et al. (2011) Integrative genomics viewer. Nat Biotechnol 29 : 24–26. doi: 10.1038/nbt.1754 21221095
75. Team RC (2012) R: A Language and Environment for Statistical Computing.
76. van der Walt S, Colbert SC, Varoquaux G (2011) The NumPy Array: A Structure for Efficient Numerical Computation. Computing in Science & Engineering 13 : 22–30.
77. Hagberg AA, Schult DA, Swart PA (2008) Exploring network structure, dynamics, and function using NetworkX. In: Varoquaux G, Vaught T, Millman J, editors. Proceedings of the 7th Python in Science Conference. Pasadena, CA USA. pp. 11–15.
78. Hunter JD (2007) Matplotlib: A 2D Graphics Environment. Computing in Science & Engineering 9 : 90–95.
79. Pérez F, Granger BE (2007) IPython: A System for Interactive Scientific Computing. Computing in Science & Engineering 9 : 21–29.
80. Edgar R, Domrachev M, Lash AE (2002) Gene Expression Omnibus: NCBI gene expression and hybridization array data repository. Nucleic Acids Res 30 : 207–210. 11752295
81. Wheeler DL, Barrett T, Benson DA, Bryant SH, Canese K, et al. (2008) Database resources of the National Center for Biotechnology Information. Nucleic Acids Res 36: D13–21. 18045790
Štítky
Genetika Reprodukční medicínaČlánek vyšel v časopise
PLOS Genetics
2015 Číslo 7
Nejčtenější v tomto čísle
- Functional Constraint Profiling of a Viral Protein Reveals Discordance of Evolutionary Conservation and Functionality
- Reversible Oxidation of a Conserved Methionine in the Nuclear Export Sequence Determines Subcellular Distribution and Activity of the Fungal Nitrate Regulator NirA
- Modeling Implicates in Nephropathy: Evidence for Dominant Negative Effects and Epistasis under Anemic Stress
- Nutritional Control of DNA Replication Initiation through the Proteolysis and Regulated Translation of DnaA