
mTOR Directs Breast Morphogenesis through the PKC-alpha-Rac1 Signaling Axis
The protein kinase mTOR is frequently activated in breast cancers, where it enhances cancer cell growth, survival, and metastastic spread to distant organs. Thus, mTOR is an attractive, clinically relevant molecular target for drugs designed to treat metastatic breast cancers. However, mTOR exists in two distinct complexes, mTORC1 and mTORC2, and the relative roles of each complex have not been elucidated. Moreover, as pathways that regulate normal tissue growth and development are often highjacked to promote cancer, understanding mTOR function in normal mammary epithelial development will likely provide insight into its role in tumor progression. In this study, we assessed the role of mTORC1 and mTORC2 complexes in normal mammary epithelial cell branching, survival, and invasion. Interestingly, while mTORC1 was not required for branching, survival and invasion of mammary epithelial cells, mTORC2 was necessary for these processes in both mouse and human models. Furthermore, we found that mTORC2 exerts its effects primarily through downstream activation of a PKC-alpha-Rac1 signaling axis rather than the more well-studied Akt signaling pathway. Our studies identify a novel role for the mTORC2 complex in mammary morphogenesis, including cell survival and motility, which are relevant to breast cancer progression.
Published in the journal:
. PLoS Genet 11(7): e32767. doi:10.1371/journal.pgen.1005291
Category:
Research Article
doi:
https://doi.org/10.1371/journal.pgen.1005291
Summary
The protein kinase mTOR is frequently activated in breast cancers, where it enhances cancer cell growth, survival, and metastastic spread to distant organs. Thus, mTOR is an attractive, clinically relevant molecular target for drugs designed to treat metastatic breast cancers. However, mTOR exists in two distinct complexes, mTORC1 and mTORC2, and the relative roles of each complex have not been elucidated. Moreover, as pathways that regulate normal tissue growth and development are often highjacked to promote cancer, understanding mTOR function in normal mammary epithelial development will likely provide insight into its role in tumor progression. In this study, we assessed the role of mTORC1 and mTORC2 complexes in normal mammary epithelial cell branching, survival, and invasion. Interestingly, while mTORC1 was not required for branching, survival and invasion of mammary epithelial cells, mTORC2 was necessary for these processes in both mouse and human models. Furthermore, we found that mTORC2 exerts its effects primarily through downstream activation of a PKC-alpha-Rac1 signaling axis rather than the more well-studied Akt signaling pathway. Our studies identify a novel role for the mTORC2 complex in mammary morphogenesis, including cell survival and motility, which are relevant to breast cancer progression.
Introduction
Post-natal mammary epithelial morphogenesis is a complex process during which an extensively branched ductal network develops from a rudimentary epithelial bud [1]. Branching morphogenesis is most active during puberty and is regulated by endocrine hormones and local paracrine interactions with mesenchymal stroma [2]. In response to hormonal and growth factor cues, mammary epithelial cells (MECs) within the terminal end buds (TEBs), the club-shapes structures at the distal epithelial tips [1, 2], proliferate and collectively invade surrounding stroma. Differentiation of epithelial progenitors in the TEB populates the ducts with mature luminal MECs, and apoptosis canalizes the lumen. TEB bifurcation results from mechanical restraints at the TEB midline, forming new primary ducts. Side-branches sprout laterally from the trailing ducts as proliferative out-pouchings. Primary and side branching reiterates, filling the entire mammary fat pad [1, 2]. The dynamic processes that occur during puberty in the mammary epithelium are carefully coordinated by many molecular signaling pathways.
The intracellular serine/threonine kinase mammalian target of rapamycin (mTOR) regulates cellular metabolism, protein and lipid synthesis, cell survival, and cytoskeletal organization, processes that are required for proper mammary morphogenesis. mTOR regulates these processes through phosphorylation of its target substrates, including translation initiation factor 4E (eIF4E)-binding protein 1 (4E-BP1), p70S6 kinase (S6K), Akt, SGK1, and protein kinase C-alpha (PKC-alpha) [3]. A complex of associated protein co-factors regulates mTOR substrate specificity. As such, mTOR functions in two distinct complexes, each defined by the specific co-factors in complex with mTOR kinase and by their relative sensitivity to rapamycin. The rapamycin-sensitive mTOR complex (mTORC)-1 requires the co-factor regulatory-associated protein of mammalian target of rapamycin (Raptor), whereas mTORC2 requires the co-factor rapamycin-insensitive companion of mammalian target of rapamycin (Rictor). Although mTORC2 is relatively insensitive to acute rapamycin treatment, more recent studies determined that prolonged rapamycin treatment can inhibit mTORC2 complex assembly [4–7]. The intracellular serine/threonine kinase Akt is phosphorylated at S473 directly by mTORC2 and is key effector for many of the biological effects initiated by mTORC2. Akt is also linked to activation of mTORC1 downstream of PI3-kinase, making Akt a point of intersection between mTORC1, mTORC2, and their associated effectors [3].
Though mTOR regulates MEC growth in cell lines [8, 9] and milk protein expression [8, 10–12], mTOR-mediated regulation of mammary ductal morphogenesis remains under-investigated. The signaling complexity of mTOR, its pleiotropic functions, and a lack of mTORC2-specific inhibitors present a challenge to dissecting the relative roles of mTORC1 and mTORC2 in mammary development. Given the importance of mTOR in breast cancer progression and treatment, an understanding of mTORC1 and mTORC2 in untransformed MECs is needed. We assessed the impact of tissue-specific Rictor and Raptor ablation on mammary morphogenesis. Rictor loss impaired mTORC2 activity, reduced ductal lengthening and secondary branching, and reduced MEC proliferation and survival in vivo and ex vivo. Surprisingly, genetic disruption of mTORC1 via Raptor ablation resulted in distinct and milder effects on the developing mammary ductal epithelium, revealing non-overlapping roles for mTORC1 and mTORC2 during mammary morphogenesis. Interestingly, we found that mTORC2 controls mammary morphogenesis through downstream effectors PKC-alpha and Rac1, but not Akt.
Results
Rictor/mTORC2 regulates ductal branching, lengthening, and cell survival in the mammary gland in vivo
To assess the role of Rictor/mTORC2 during mammary morphogenesis in the context of the native mammary microenvironment, we bred MMTV-Cre mice [13] to RictorFL/FL mice [14], allowing mammary-specific Cre recombinase to disrupt Rictor expression at floxed (FL) Rictor alleles. Immunohistochemistry (IHC) for Rictor revealed expression in luminal and myoepithelial MECs in Rictor+/+MMTV-Cre (RictorWT) mice (Fig 1A–upper panel). Rictor expression was not seen in RictorFL/FLMMTV-Cre (RictorMGKO) luminal MECs, and was slightly reduced in the myoepithelium, consistent with luminal but not myoepithelial Cre expression in MMTV-Cre mice. Akt phosphorylation at S473, the mTORC2 phosphorylation site, was decreased in MECs of RictorMGKO mice versus RictorWT, confirming decreased mTORC2 signaling upon Rictor ablation (Fig 1A–lower panel). Immunofluorescent (IF) staining for cytokeratin (CK)-8 and CK14, molecular markers of luminal and myoepithelial MECs, respectively, confirmed that Rictor loss did not affect the relative spatial organization of luminal and myoepithelial MECs (Fig 1B–upper panel), but revealed the presence of apically mis-localized nuclei in RictorMGKO MECs (yellow arrows), versus basally located nuclei and an organized, smooth apical border in RictorWT samples (white arrows). IF for the tight junction (TJ) protein Zona Occludens-1 (ZO-1) revealed apical ZO-1 localization in RictorWT samples. However, ZO-1 was aberrantly localized along baso-lateral membranes in RictorMGKO MECs (Fig 1B–lower panel). In contrast, the baso-lateral localization of the adherens junction (AJ) protein p120 was relatively unaltered by Rictor loss. These results suggest that Rictor loss disrupts the proper apical distribution of ZO-1 in MECs. The apically mis-localized nuclei apparent in histological mammary sections from 6-week old RictorMGKO female mice contributed to an irregular apical border (Fig 1C, black arrows). Additional structural alterations were seen in TEBs, including sloughing of body cells (the multi-layered TEB population comprised of mature and progenitor luminal MECs; Fig 1C–lower panel, arrow) within TEB lumens, and stromal thickening at the neck between maturing ducts and TEBs (Fig 1C–lower panel, *). Morphological alterations were seen throughout whole mounted, hematoxylin-stained RictorMGKO mammary glands (Figs 1D, arrows, and S1A). Because mammary ducts lengthen distally at a predictable rate during puberty, we measured ductal length in mammary glands from 6 week - (mid-puberty) and 10 week-old (late puberty) mice. Ductal length was significantly reduced in RictorMGKO mammary glands at both time points (Fig 1E–left panel, and S1B Fig). Primary (Y-shaped) and side (T-shaped) branches were counted in each mammary gland, revealing a significant reduction in T-shaped side branches at 6 and 10 weeks of age in RictorFL/FLMMTV-Cre samples as compared to RictorWT (Fig 1E–right panel).

IHC analysis of Ki67 in both ducts and TEBs was used as a relative measure of cellular proliferation in the mammary epithelium (Figs 1F—upper panel, and S1C–upper panel), revealing decreased Ki67+ nuclei in RictorMGKO samples as compared to RictorWT at 6 weeks of age but not at 10 weeks (Fig 1G—left panel). Cell death in ductal MECs or TEBs, measured using TUNEL analysis (Figs 1F—lower panel, and S1C–lower panel), demonstrated a remarkable increase in TUNEL+ MECs in RictorMGKO samples at 6 and 10 weeks of age (Fig 1G—right panel). These results demonstrate that Rictor loss impairs mTORC2 activity, P-Akt, MEC growth, and MEC survival during mammary morphogenesis.
Defects in MEC survival, branching, and motility are recapitulated by Rictor loss in an ex vivo model of mammary morphogenesis
Western analysis of whole mammary lysates harvested from 10-week old female mice confirmed decreased P-Akt S473 in RictorMGKO mammary glands, and revealed increased phosphorylation of the mTORC1 effector ribosomal protein S6 ([15]; Fig 2A) confirming that Rictor loss decreases mTORC2 activity, but not mTORC1. To dissect more precisely how Rictor signaling affects mammary morphogenesis, we used primary mammary epithelial cells (PMECs) and primary mammary organoids (PMO’s) harvested from RictorFL/FL mice. Adenoviral infection of RictorFL/FL PMECs with Ad.Cre significantly reduced Rictor and P-Akt S473 levels relative to cells infected with control Ad.LacZ, and increased P-S6 levels (Fig 2B), similar to the impact of Rictor ablation in vivo. Consistent with structural alterations were seen in our RictorMGKO model in vivo (e.g. sloughing of body cells in TEBs, irregular ductal tracts, multiple cell layers), confocal analysis of Rictor-deficient PMOs stained for E-cadherin revealed multiple cell layers in acinar structures and poor lumen formation relative to control PMOs infected with Ad.LacZ, which formed a well-defined lumen surrounded by a single layer of epithelial cells (S1D Fig). Rictor loss did not significantly impact PMEC proliferation, as measured by bromodeoxyuridine (BrdU) incorporation into genomic DNA (Fig 2C–left panel). However, the percentage of TUNEL+ PMEC nuclei was increased >2-fold following Ad.Cre infection (Fig 2C–right panel), consistent with increased cell death in Rictor-null MECs in vivo. Similar results were seen using MCF10A immortalized human MECs, in which Rictor gene targeting with Rictor-specific zinc finger nucleases (ZFNs) genetically impaired Rictor expression and decreased P-Akt S473 (Fig 2D), thus validating our findings in a human MEC model. Increased cell death was also seen in MCF10A-RictorZFN cells as compared to parental MCF10A cells, as shown by AnnexinV-FITC binding (Fig 2E). Therefore, Rictor is necessary for mTORC2 signaling and cell survival in human and mouse MECs.

We cultured adenovirus transduced RictorFL/FL mammary organoids in three-dimensional (3D) Matrigel to assess collective epithelial morphogenesis (Fig 2F). Mammary organoids accurately model epithelial autonomous molecular events of mammary morphogenesis in a stroma-free environment that preserves the native relationship between luminal and myoepithelial MECs and permits cell-cell and cell-matrix interactions in three dimensions [16]. GFP fluorescence in organoids infected with Ad.GFP or Ad.Cre-IRES-GFP confirmed efficient infection in basal and luminal cells of organoids (S2A and S2B Fig). IF staining for pan-cytokeratin confirmed that organoids were epithelial-derived (S2C Fig). Ad.Cre infection of RictorFL/FL PMECs substantially reduced organoid size and branching (Fig 2F and 2G) and reduced Rictor expression levels (Fig 2H). In contrast, Ad.Cre infection of RictorFL/+ PMECs only modestly reduced Rictor expression levels (Fig 2H) and did not significantly affect organoid size or the number of branches formed in RictorFL/+ organoids (Fig 2F and 2G). These data suggest that Rictor is necessary for multicellular morphogenesis of the mammary epithelium, faithfully recapitulating ex vivo the consequences of Rictor ablation that are seen in vivo and demonstrating the utility of this model to examine branching mammary gland morphogenesis.
Previous studies demonstrated that Rictor knock-down reduces migration of breast cancer cell lines [17–19]. We therefore assessed PMEC invasion and motility through Matrigel-coated transwell filters upon Rictor ablation ex vivo. Fewer RictorFL/FL PMECs invaded through Matrigel when infected with Ad.Cre, as compared to RictorFL/FL PMECs infected with control Ad.LacZ (Fig 2I). Similarly, invasion through Matrigel-coated transwells was profoundly reduced in MCF10A-RictorZFN cells as compared to parental MCF10A cells (Fig 2J). Under these conditions, there were a similar number of viable cells remaining in the upper transwell chamber after 24 hours of culture of both MCF10A and MCF10A-RictorZFN cells (S2D Fig), suggesting that cell death may not be the primary reason underlying the reduced ability of MCF10A-RictorZFN cells to migrate/invade in these transwell assays, but rather that cell invasion, per se, is decreased in the absence of Rictor. Collectively, these data demonstrate that Rictor promotes MEC invasion and migration, two processes necessary for mammary ductal lengthening and branching.
Akt activation, while necessary for normal branching morphogenesis, is not sufficient to rescue morphogenesis, survival, and motility defects in the absence of Rictor
Because Rictor loss reduced P-Akt S473, we tested the hypothesis that Akt phosphorylation by Rictor-regulated mTOR complex 2 is necessary for survival and morphogenesis of MECs. Adenoviral expression of myristoylated Akt1 (Ad.Aktmyr) was used to express a membrane-localized (and thus, constitutively active) variant of Akt1. Indeed, expression of this Akt variant in mammary epithelium delays involution and the onset of apoptosis in vivo [20]. Additionally, we repeated experiments using an alternative adenoviral, constitutively active Akt construct, Ad.AktDD. Ad.Aktmyr or Ad.AktDD restored P-Akt S473 in Ad.Cre-infected RictorFL/FL PMECs (Figs 3A and S3A). Surprisingly, RictorFL/FL organoids infected with Ad.Cre + Ad.Aktmyr or Ad.AktDD were morphologically similar to and harbored little to no statistically significant difference in the numbers of branches compared to those infected with Ad.Cre alone (Figs 3B and S3B). Further, size of Rictor-deficient organoids was not fully rescued by expression of Ad.Aktmyr or Ad.AktDD (Figs 3C and S3C). We found that blockade of Akt using the allosteric Akt inhibitor 5J8 blocked Akt phosphorylation at S473 (Fig 3D), reduced the number of branches per organoids, and reduced organoid size by nearly 50% (Fig 3E). These data suggest that while Akt is necessary for mammary branching and growth, restoring Akt function is not sufficient to completely rescue defects caused by loss of Rictor/mTORC2 function. Indeed, expression of Ad.Aktmyr did not reduce the number of Rictor-null PMECs undergoing cell death (Fig 3F), nor did it increase the number Rictor-null PMECs invading through Matrigel-coated transwells (Fig 3G). Taken together, these observations suggest Rictor is necessary for Akt phosphorylation in MECs, but that Akt is not the primary effector of mTORC2 that regulates MEC survival, invasion, and side branching. Thus, while Akt is necessary for proper mammary epithelial morphogenesis, it is not sufficient to compensate for loss of Rictor/mTORC2 function.

Protein kinase C (PKC)-alpha activates the small GTPase Rac1 downstream of Rictor
Previous studies showed that mTORC2 phosphorylates PKC-alpha [21] Consistent with these findings, Rictor loss reduced P-PKC-alpha in PMECs, as well as total PKC-alpha (Fig 4A). We also observed decreased P-PKC-alpha by IF in mammary gland sections from 6 week old RictorMGKO mice, as compared to RictorWT controls (S4A Fig). Adenoviral PKCα expression rescued P-PKC-alpha in Rictor-null PMECs (Fig 4B), rescued branching morphogenesis in Rictor-null organoids (Fig 4C) and increased Rictor-null organoid size (Fig 4D). Similar to what was seen in mouse PMECs, P-PKC-alpha and total PKC-alpha were diminished in MCF10A-RictorZFN cells relative to parental MCF10A (Fig 4E). Restoration of PKC-alpha by adenoviral transduction increased P-PKC-alpha in both parental MCF10A and MCF10A-RictorZFN cells (Fig 4F).

Rac1, a small GTPase involved in actin cytoskeletal dynamics, is necessary for migration of many breast cancer cell lines, regulates apical polarity in MECs, and is a downstream effector of mTORC2 signaling. Importantly, Rac1 is also a known effector of PKC-alpha in MECs [22–24], but the linear relationship between Rictor, PKC-apha, and Rac1 in MECs is currently unknown. We examined Rac1 activation in MCF10A cells using agarose beads conjugated to recombinant p21-activated kinase binding domain (PBD), which specifically binds to active GTP-bound Rac. Western analysis to detect Rac1 in PBD pull-downs revealed decreased Rac-GTP in MCF10A-RictorZFN cells as compared to parental MCF10A (Fig 4G). However, Ad.PKC-alpha increased Rac-GTP in Rictor-null cells, confirming that PKC-alpha activates Rac downstream of Rictor. Additionally, Ad.PKC-alpha increased invasion of MCF10A-RictorZFN cells through Matrigel-coated transwells (Fig 4H), and significantly reduced apoptosis in MCF10A-RictorZFN, as measured by Annexin V-FITC staining (Fig 4I). A pharmacological PKC-alpha inhibitor profoundly decreased invasion of parental MCF10A cells through Matrigel-coated transwells (Fig 4J), providing validation that PKC-alpha is necessary for MEC motility. These data suggest Rictor-mediated PKC-alpha signaling in MECs controls Rac1 activation, branching morphogenesis, cell survival and motility.
Restoring Rac activity rescues branching morphogenesis, survival, and motility induced by loss of Rictor
To confirm the role of Rictor in Rac1 activation in vivo, we examined mammary epithelium in situ for GTP-bound Rac1 using a glutathione-S-transferase (GST)-PBD fusion protein as a probe for Rac-GTP. IF detection of GST-PBD binding was decreased in RictorMGKO mammary glands compared to RictorWT (Figs 5A, 5B, and S4B). Importantly, IF detection of GST-PBD binding in WT PMECs was abolished by a pharmacological Rac1 inhibitor (Figs 5C and S4C), confirming the specificity of the assay for detection of Rac1-GTP. In contrast to the abundant Rac1-GTP detected in WT PMECs, RictorFL/FL PMECs infected with Ad.Cre displayed a 10-fold decrease in GST-PBD binding to Rac-GTP relative to Ad.LacZ infected controls (Figs 5C and S4C). Phalloidin staining revealed cortical actin overlapping with GST-PBD binding in Ad.LacZ-infected RictorFL/FL PMECs (S4D Fig). However, Ad.Cre-infected RictorFL/FL PMECs showed increased formation of actin stress fibers, bearing no overlap with GST-PBD. Constitutively active Rac1 (Ad.caRac1) expression (Fig 5D) restored GST-PBD binding in Rictor-null PMECs (Fig 5E), suggesting that Rictor is necessary for Rac1-GTP in PMECs.

Ad.caRac1 was used to determine if restoration of Rac1-GTP could rescue invasion in Rictor-null MECs. Ad.caRac1 increased invasion 2.5-fold over Ad.LacZ in Rictor-null PMECs (Fig 5F). P-Akt S473 was unaffected by caRac1 (Fig 5D), suggesting that while Akt and Rac1 are both effectors of Rictor-dependent signaling, they exist in two separable pathways in MECs. Despite having no impact on P-Akt, Ad.caRac1 decreased cell death in Rictor-null PMECs (Figs 5G and S4E), suggesting that Rictor-dependent Rac1-GTP is necessary for PMEC survival. Ad.caRac1 also rescued branching morphogenesis of Rictor-deficient organoids (Fig 5H). Conversely, Rac inhibition using a pharmacologic Rac1 inhibitor decreased organoid size and branching in WT organoids (Fig 5I), confirming that Rac1 is necessary for mammary epithelial branching morphogenesis and appears to function downstream of mTORC2. Thus, Rictor is required for Rac1-GTP signaling, and restoration of Rac1 activity rescued branching morphogenesis and survival of Rictor-deficient PMECs. To determine if Rictor/mTORC2-mediated branching morphogenesis and ductal outgrowth are dependent on PKC-alpha/Rac versus Akt in the context of the native mammary gland environment in vivo, we transduced PMEC from RictorFL/FL mice with control Ad.GFP versus Ad.Cre in the presence or absence of Ad.PKC-alpha, Ad.caRac, or Ad.Aktmyr and transplanted them into the cleared inguinal mammary fat pads of 4 week old recipient female mice. We harvested mammary glands from these animals 6 weeks post-transplantation and assessed epithelial architecture and branching morphogenesis in whole-mount preparations. Consistent with data from MMTV-Cre/RictorFL/FL mice, transplanted Rictor-deficient MEC produced structures characterized by shortened ductal outgrowths with fewer branches relative to GFP controls (Fig 5J and 5K). Restored PKC-alpha or Rac activity (Fig 5J and 5K) rescued these defects and produced epithelial outgrowth that resembled endogenous epithelium in contralateral controls (S4F Fig). Consistent with our ex vivo organoid culture analyses, restored Akt activity was unable to fully rescue defects produced by loss of Rictor (Fig 5J and 5K). These data suggest that Rictor/mTORC2-dependent mammary epithelial morphogenesis relies primarily upon downstream activation of PKC-alpha and Rac-GTPase.
Rapamycin-mediated inhibition of mTORC1 and mTORC2 mimics loss of Rictor/mTORC2
Rapamycin is a pharmacologic inhibitor of mTOR originally thought to preferentially inhibit mTORC1 over mTORC2. However, sustained rapamycin treatment impairs both mTORC1 and mTORC2 in a cell type-dependent manner [25–28]. Consistent with this idea, acute rapamycin treatment for 1 hour (1 h) decreased P-S6 (an mTORC1 effector) but not P-Akt (an mTORC2 effector), whereas sustained rapamycin treatment (24 h) decreased both P-S6 and P-Akt S473 (Fig 6A). Rapamycin treatment for 10 days significantly decreased branching morphogenesis and organoid size in WT organoids (Fig 6B). Although PMEC survival was not affected by acute rapamycin treatment, cell death increased after 24 h with rapamycin treatment (Fig 6C). Proliferation of WT PMECs, as measured by BrdU incorporation, was unaffected by acute (30 min) or sustained (24 h) pre-treatment with rapamycin (Fig 6D). The effects of sustained rapamycin treatment, including reduced MEC survival, branching morphogenesis formation, and diminished organoid size were similar to the effects achieved by Rictor ablation in MECs. Also similar to what was seen with Rictor-deficient MECs, the phenotypic effects of rapamycin treatment were rescued by Ad.PKC-alpha (Fig 6E) and Ad.caRac1 (Fig 6F), including rescue of branching morphogenesis and colony size. Ad.caRac1 also rescued rapamycin-mediated inhibition of cell motility (Figs 6G and S5). Because the mTOR inhibitor rapamycin impairs mTORC1 and mTORC2, and recapitulates the morphological and molecular effects of Rictor ablation in MECs, these results suggest that Rictor is acting in complex with mTOR to regulate MEC survival, motility, and branching morphogenesis, supporting a role for mTORC2 in the developing mammary gland. However, these findings do not rule out the contribution of mTORC1 to mTOR-mediated mammary morphogenesis.

Raptor/mTORC1 loss produces relatively mild defects in mammary branching morphogenesis and epithelial growth in vivo and ex vivo
To understand how mTORC1 participates in mammary morphogenesis, we infected PMECs harvested from female RaptorFL/FL mice [29] with Ad.Cre. Western analysis confirmed loss of Raptor and decreased P-S6 in serum-deprived cells (Fig 7A). However, P-Akt S473 was unaffected by Raptor ablation, confirming that genetic ablation of Raptor causes selective inhibition of mTORC1, while Rictor ablation inhibits mTORC2. RaptorFL/FL mammary organoids infected with Ad.LacZ formed multi-branched colonies, as expected (Fig 7B). Surprisingly, infection with Ad.Cre did not affect branching morphogenesis in RaptorFL/FL organoids, the number of branches per organoid, or colony size (Fig 7B). Additionally, Raptor ablation had no significant impact on PMEC migration in wound healing assays (Fig 7C).
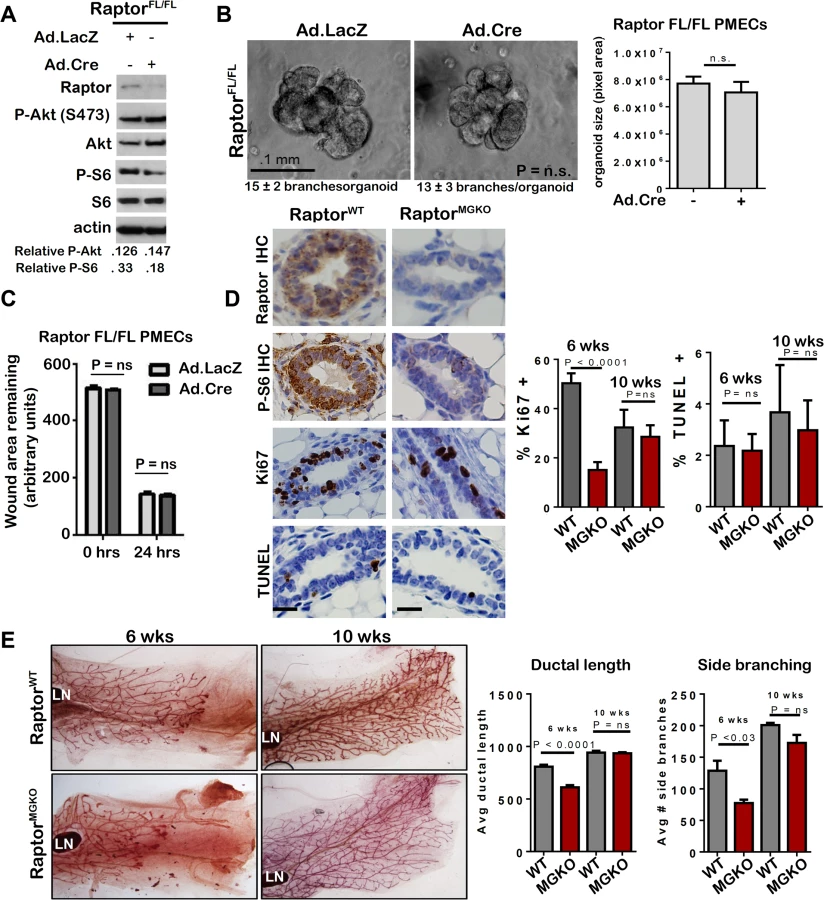
RaptorFL/FLMMTV-Cre (RaptorMGKO) mice were used to assess the impact of Raptor ablation on mammary morphogenesis in vivo. IHC detected Raptor and the mTORC1 effector P-S6 in RaptorWT mammary glands at 10 weeks of age but did not detect P-S6 in age-matched RaptorMGKO mice (Fig 7D). Western analysis of whole mammary lysates from 10 week-old mice confirmed loss of Raptor (S6A Fig). Immunofluorescent (IF) staining for cytokeratin (CK)-8 and CK14, molecular markers of luminal and myoepithelial MECs, respectively, confirmed that Raptor loss did not affect the relative spatial organization of luminal and myoepithelial MECs (S6B Fig–upper panel). Additionally, no alterations in localization or staining pattern of ZO-1 were observed (S6B Fig–lower panel). Proliferation, as measured by IHC for Ki67, was significantly decreased in RaptorMGKO ducts in 6-week old mice, but not in TEBs (S6C Fig). By 10 weeks, however, proliferation in ducts had recovered to levels seen in RaptorWT (Fig 7D). TUNEL analysis revealed similar ratios of TUNEL+ MECs in RaptorMGKO and RaptorWT samples harvested from 6 and 10 week old animals (Fig 7D). Consistent with these observations, only mild defects in side branching and ductal length were found in mammary glands from 6-week old RaptorMGKO mice (Fig 7E), and these were resolved by 10 weeks of age.
Taken together, these results demonstrate that mTOR uses Rictor to activate PKCα/Rac1-dependent survival, motility, and branching morphogenesis in the mammary epithelium and that Rictor does not rely fully on Akt signaling to promote ductal morphogenesis in the breast.
Discussion
Postnatal mammary epithelial morphogenesis requires precise coordination of cell proliferation, apoptosis, differentiation, and motility in order to turn rudimentary epithelial buds into an organized, branched ductal network permeating the entire mammary fat pad by the end of puberty [1, 2]. mTOR is a central regulator of proliferation, apoptosis, differentiation, and motility, integrating numerous upstream signals to generate the desired biological outcome. Therefore, we assessed how mTOR signaling contributes to mammary morphogenesis. We found that pharmacologic mTOR inhibition reduced the size and branching complexity of mammary organoids in culture, phenotypes recapitulated by mTORC2 loss of function via Rictor ablation, but not upon mTORC1 inhibition through Raptor ablation. We also observed a disorganized epithelial architecture and stromal thickening around TEB upon tissue-specific Rictor ablation. The MMTV-Cre model has been reported to be leaky, leading to expression in tissues other than luminal mammary epithelium [30] thus it is possible that some of these defects may be due to loss of Rictor in stromal components. Alternatively, changes in basal epithelium may be a secondary effect of luminal cell misolocalization in the absence of Rictor, or Rictor expression in the luminal compartment may regulate expression and function of mTOR signaling intermediates in the basal cell layer through an indirect, juxtacrine signaling mechanism. We are actively investigating the role of Rictor/mTORC2 in luminal versus basal epithelium in our ongoing research. As our epithelial branching and survival phenotypes were recapitulated in the ex vivo stroma-free organoid culture model, however, it is likely that the effects on stroma are, at least in part, secondary to the loss of Rictor in epithelium.
Genetic inhibition of mTORC2 also reduced ductal branching and lengthening in vivo, diminished P-Akt and P-PKC-alpha, and impaired activation of the GTPase Rac1. Akt restoration only modestly enhanced branching morphogenesis in Rictor-deficient mammary organoids and was not sufficient to rescue cell survival or PMEC invasion through Matrigel. However, Akt inhibition did decrease organoid branching and colony size suggesting that Akt provides a critical signal in growth control, but is not sufficient to drive branching morphogenesis in the absence of Rictor. This is consistent with the data from our analysis of transplanted Rictor-deficient/AktMyr expressing MEC in vivo and with the phenotype of Akt1 deletion, which did not affect mammary epithelial cell differentiation but did impair lactation [31]. Deletion of Akt1 and one allele of Akt2 enhanced this defect [32, 33]. Moreover, Akt activation did not completely inhibit luminal apoptosis during MCF10A acinar morphogenesis in culture [34], suggesting that other factors also regulate cell survival during normal mammary epithelial development. In contrast to Akt, restoration of PKC-alpha signaling to Rac1, or Rac1 activation independently of upstream signals, fully rescued all phenotypes resulting from Rictor loss in culture and in transplanted Rictor-deficient MEC in vivo, suggesting that Rictor-dependent mTORC2 is essential for PKC-alpha-Rac1 signaling to drive mammary morphogenesis. While not directly tested here, at least one additional study has elucidated mechanisms downstream of Rac1 that can control cell survival. One report using lymphoma cells demonstrated direct inhibition of apoptosis through Rac1-stimulated phosphorylation of the Bcl-2 family member, Bad, which occurred in an Akt-independent manner [35]. We observed a modest decrease in cell viability upon prolonged treatment with the Rac1 inhibitor in organoid culture coupled with the decreased branch extension, consistent with previous studies that also reported regulation of branching initiation and extension via PI3K-mediated Akt and Rac1, respectively [36].
Interestingly, levels of mTORC1 target P-S6 are elevated in MEC upon Rictor loss relative to controls. This could reflect shift of mTOR kinase to complex 1 in the absence of a stable mTORC2 complex. It will be of great interest to track mTOR kinase association with the two complexes over the course of mammary epithelial development to better understand its functions. Activation of the Akt signaling pathway upon mTOR inhibition via a negative feedback loop has been observed in many cell types, including breast cancer cell lines (Reviewed in [37]). In our study, rapamycin preferentially inhibited mTORC1 upon acute treatment (e.g. reduction in P-S6 without affecting P-Akt-S473 levels) and as prolonged treatment inhibited both complexes (e.g. reduction in both P-S6 and P-Akt-S473). These data are consistent with the observation that rapamycin is an effective inhibitor for activity of both complexes in many cell types [5], including MECs. The differences in response to rapamycin between normal MECs and breast cancer cell lines could be due to differences in insulin-like growth factor receptors (IGFRs), which are expressed at higher levels in cancer cells and mediate feedback to Akt upon mTOR inhibition (Reviewed in [37–39]).
Given the known roles of mTORC1 in cell growth, metabolism, and protein and lipid synthesis [3], it was surprising that Raptor loss produced only a transient delay in ductal lengthening. It is possible that other signaling pathways may compensate for loss of mTORC1 function in Raptor-deficient mammary epithelium, such as RSK-mediated activation of S6 [40]; [41]. However, we observed similar decreases in cellular proliferation in the absence of Raptor and Rictor expression at 6 weeks that recovered by 10 weeks, suggesting that MEC proliferation may rely on both mTORC1 and mTORC2. Decreased MEC proliferation upon genetic mTORC1 ablation is consistent with other reports of rapamycin-mediated cell growth inhibition in lactating mouse mammary explants, in lactating mice, and in milk-producing HC11 cells. Based on these previous studies, it will be important to determine the effects of Raptor and Rictor ablation on growth, differentiation, and milk production in alveolar mammary epithelium during pregnancy and lactation in vivo.
The PI3-kinase (PI3K)/mTOR pathway is aberrantly activated up to 60% of clinical breast cancers, facilitating tumor cell growth, survival, metabolism, and invasion [42, 43]. Moreover, increased PI3K activity in MMTV-Cre/PTENFL/FL mice increases mammary epithelial branching and decreases apoptosis during pubertal development [44], suggesting that PI3K signaling is important in branching and survival in the breast. This idea is consistent with the phenotype produced by MMTV-Cre-driven Rictor loss, in which loss of a PI3K pathway mediator produces decreased branching and survival. While inhibitors of mTORC1 show limited clinical efficacy as single agents, anti-PI3K agents combined with dual mTORC1/2 inhibitors appear to be more effective [45–48], underscoring the clinical relevance of mTORC2 in breast cancer. Importantly, these recent clinical observations parallel the data shown here demonstrating that mTORC2 inhibition due to either sustained rapamycin treatment or to Rictor deletion profoundly affected the complex series of events driving mammary morphogenesis, and these mTORC2-dependent processes occur in a manner unique and separable from mTORC1. Interestingly, preferential targeting of mTORC2 versus mTORC1 reduced breast cancer cell motility and survival in culture and in vivo [18, 49], and Rictor knockdown suppressed anchorage-independent growth of MCF7 breast tumor cells [50]. Although at least one report suggests elevated Rictor levels correlate with higher overall and recurrence-free survival [51], Rictor overexpression was observed in clinical invasive breast cancer specimens relative to normal breast tissue, as well as in lymph node metastases [18], supporting the clinical relevance of mTORC2 in invasive breast cancer. Given our findings that Rictor/mTORC2 is required in the normal mammary epithelium for PKC-alpha-Rac1 activation which drives MEC survival, motility, and invasion, it will be interesting to determine if the mTORC2-PKC-alpha-Rac signaling axis is used by breast cancer cells to drive metastasis. If so, mTORC2-specific targeting or PKC-alpha inhibition could represent potential therapeutic strategies to limit metastatic spread of breast tumors, and to limit survival of disseminated tumor cells.
Although data shown herein are the first demonstration of mTORC2-mediated regulation of normal MEC migration and invasion, several lines of evidence suggest that cancer cells exploit Rictor-dependent signaling pathways to facilitate invasion and metastasis. For example, siRNA-mediated Rictor knockdown inhibited MCF7 and MDA-MB-231 breast cancer cell migration [18, 49]. Rictor knockdown inhibited transforming growth factor beta (TGF-beta)-mediated epithelial-to-mesenchymal transition (EMT) in breast cancer lines [52]. In contrast to our findings that untransformed MECs use Rictor to activate PKC-alpha and Rac1-mediated invasion, breast cancer cells used Rictor to drive motility through protein kinase C-zeta (PKC-zeta; [18]), integrin-linked kinase (ILK; [52]) and Akt [49]. Although Akt phosphorylation at S473 required Rictor/mTORC2 in primary MECs, restoring Akt function was not sufficient to rescue survival, motility, or branching morphogenesis in the absence of Rictor. Restoration of Rac1 activity, an essential regulator of mammary epithelial branching morphogenesis [16, 53] and a downstream effector of mTORC2 and PKC-alpha, rescued survival and migration defects induced by genetic mTORC2 inhibition. While not specifically linked to Rictor in breast cancer cells, Rac1-mediated invasion and metastasis of breast cancer cells has been reported previously [54–56]. Together, these data suggest that Rictor/mTORC2-dependent Rac signaling could promote breast cancer invasion, paralleling its function normal MEC branching morphogenesis. It is possible that breast cancer cells can engage multiple pathways (PKC-zeta, ILK, Akt, Rac, and others) to regulate tumor cell metastasis, and it is interesting to speculate that Rictor may lie at the intersection of each of these pathways.
In summary, our data demonstrate distinct, non-overlapping functions of mTORC1and mTORC2 in post-natal mammary morphogenesis. Whereas Raptor-dependent mTORC1 signaling regulates proliferation, Rictor-dependent mTORC2 is essential for cell survival, cell junctions, motility, and branching morphogenesis. These findings underscore the importance of understanding the distinct roles for mTORC1 and mTORC2 in normal physiology of the breast and in breast cancer in order to intelligently develop and administer mTOR-directed therapies.
Materials and Methods
Mice
All animals were housed under pathogen-free conditions, and experiments were performed in accordance with AAALAC guidelines and with Vanderbilt University Institutional Animal Care and Use Committee approval. RictorFL/FL mice (C57BL/6) were kindly provided by Dr. Mark Magnuson (Vanderbilt University) and have been previously described [14]. RaptorFL/FL mice ([29], C57BL/6) were purchased from the Jackson Laboratories (Bar Harbor, ME). MMTV-Cre mice ([13] FVB) were purchased from the Jackson Laboratories. All analyses were performed on age-matched siblings resulting from F1 (1 : 1, FVB:C57BL/6) intercrosses.
PMEC and organoid cell culture
Primary mammary organoids were generated from freshly collected, partially disaggregated mouse mammary glands using a modification of previously described methods [16]. Primary mouse mammary epithelial cells (PMECs) were harvested as described previously [57]. Organoids were immediately embedded in growth factor reduced Matrigel (BD Bioscience) at 50 organoids/100 microliters. Once polymerized, Matrigel-embedded cultures were overlain with Growth Media [DMEM:F12 supplemented with 5 micrograms/ml porcine insulin (Sigma-Aldrich), 10 picograms/ml each estrogen and progesterone (Sigma-Aldrich), 5 nanograms/ml human epidermal growth factor (R&D Systems), 100 I.U./ml penicillin-streptomycin (Life Technologies)]. PMEC were maintained in Growth Media. For some experiments, cells were maintained for 24 hour in Starvation Media [Growth Media supplemented with penicillin-streptomycin only] or treated with Fibroblast-Conditioned Media (DMEM:F12 supplemented 100 I.U./ml penicillin-streptomycin cultured with mouse mammary fibroblasts for 48 hours and passed through a 0.2 micron filter) for wound closure migration studies. Rapamycin (Sigma-Aldrich, 20 nanomolar), InSolution Rac1 inhibitor (Calbiochem/Millipore, 20 micromolar), and adenoviral particles (Ad.Cre, Ad.LacZ, Ad.caRac1, Ad.Aktmyr, and Ad.PKC-alpha, Vector Biolabs) were purchased. Freshly collected organoids were incubated with adenoviral particles (5 X 10⁸ particle forming units/ml) with constant rocking for 3–5 hours at 37°C, washed, and embedded in Matrigel. We analyzed 20–30 independent organoids isolated from 5–6 independent mice in 2–3 experiments for each condition.
Morphogenesis in organoids was scored by counting the number of branches/organoid in 10 or more organoids/culture condition. For structures that appeared more spherical and less branched (e.g. cultures treated with Ad.Cre or inhibitors), we counted bifrucations and/or small protrusions from ball-shaped structures as branches in order to be as rigorous and conservative in our quantifications as possible. Organoid size was scored using NIH Image J software to quantify pixel area in 10 or more organoids/culture condition.
MCF10A cell culture
MCF10A and MCF10A RictorZFN were purchased from Sigma-Aldrich and cultured in Growth Medium [DMEM:F12 supplemented with 5% Horse Serum (Life Technologies), 10 μg/ml porcine insulin (Sigma-Aldrich), 20 nanograms/ml human epidermal growth factor (R&D Systems), 10 nanograms/ml cholera toxin (Sigma-Aldrich), 100 micrograms/ml hydrocortisone (Sigma-Aldrich), 100 I.U./ml penicillin-streptomycin (Life Technologies)]. For some experiments, cells were maintained for 24 hour in Starvation Media [Growth Media without serum or EGF] prior to stimulation and/or analysis. PKC-alpha inhibitor GO6976 (Sigma-Aldrich, 2 nm) and adenoviral particles (Ad.RFP and Ad.PKC-alpha, Vector Biolabs) were purchased. Cells were incubated with adenoviral particles (5 X 10⁸ particle forming units/ml) for 3–5 hours at 37°C and cells were allowed to recover for 48 hours prior to experimental analysis.
Immunofluorescence
Matrigel-emdedded organoids cultured on coverslips were fixed 8 minutes in 1 : 1 methanol:acetone at -20°C, permeabilized in 0.5% Triton-X 100/PBS for 10 min, blocked [130 millimolar NaCl, 7 millimolar Na2HPO4, 3.5 millimolar NaH2PO4, 7.7 millimolar NaN3, 0.1% bovine serum albumin, 0.2% Triton-X 100, 0.05% Tween-20] and stained with rabbit anti-pan-cytokeratin (Santa Cruz Biotechnology, 1 : 100) and AF621-goat anti-rabbit (1 : 100), counterstained with TO-PRO-3 Iodide (Invitrogen), and imaged using the Vanderbilt Cell Imaging Shared Resource Zeiss LSM 510 confocal microscope and LSM Image Browser software. For E-cadherin staining, the primary antibody used was anti-E-cadherin (BD Transduction Laboratories) and visualized with anti-mouse Alexa 594 secondary antibody (Invitrogen, Molecular Probes). Confocal images of 3D structures were visualized using an LSM 510 META inverted confocal microscope with a 20X/0.75 plan apochromat objective.
Western blotting
Cells and tissues were homogenized in ice-cold lysis buffer [50 millimolar Tris pH 7.4, 100 millimolar NaF, 120 millimolar NaCl, 0.5% NP-40, 100 micromolar Na3VO4, 1X protease inhibitor cocktail (Roche)], sonicated 10 seconds, and cleared by centrifugation at 4°C, 13,000 x g for 5 min. Protein concentration was determined using BCA (Pierce). Proteins were separated by SDS-PAGE, transferred to nitrocellulose membranes, blocked in 3% gelatin in TBS-T [Tris-buffered saline, 0.1% Tween-20), incubated in primary antibody overnight and in HRP-conjugated anti-rabbit or anti-mouse for 1 hour, and developed using ECL substrate (Pierce). Antibodies used: alpha-actin (Sigma-Aldrich; 1 : 10,000); AKT and S473 P-Akt (Cell Signaling; 1 : 2,000 and 1 : 500, respectively); S6 and P-S6 (Cell Signaling; 1 : 1,000); Rictor (Santa Cruz; 1 : 250); Raptor (Cell Signaling; 1 : 500); Rab11 (Cell Signaling; 1 : 1,000); PKC-alpha and T638/641 P-PKC-alpha (Cell Signaling; 1 : 2,000); Rac (BD Transduction; 1 : 200). GST-Pak-PBD effector pulldown assays were performed using reagents from Millipore as per manufacturer’s protocol.
Histological analysis
Mammary glands were whole-mounted on slides, cleared of adipose, and stained with hematoxylin as described previously [57]. Sections (5 micron) were stained with hematoxylin and eosin. In situ TUNEL analysis was performed on paraffin-embedded sections using the ApopTag kit (Calbiochem). IHC on paraffin-embedded sections was performed as described previously [58] using: Ki67 (Santa Cruz Biotechnologies), P-S6 (Cell Signaling Technologies); P-Akt S473 (Cell Signaling Technologies); Rictor (Santa Cruz), E-cadherin (Transduction Labs). Immunodetection was performed using the Vectastain kit (Vector Laboratories), AF488-conjugated anti-rabbit, or AF621-conjugated anti-mouse (Life Technologies), according to the manufacturer’s directions.
In situ Rac-GTP assay
Methanol-fixed PMECs were probed 1 hour with GST-PBD (Millipore) diluted 1 : 50 in PBS. GST (lacking PBD) was used as a negative control. Samples were washed then probed with AF488-conjugated anti-GST (1 : 100), stained with DAPI or AF621-phalloidin, and mounted.
Transwell migration and wound closure assays
MECs (105) were added to upper chambers of Matrigel-coated transwells in starvation medium and incubated 5 hours to score migration in response to 10% serum-containing medium in the lower chamber. Filters were swabbed and stained with 0.1% crystal violet, [59] and cells on the lower surface were counted. For wound closure, 50,000 MECs were plated on Matrigel-coated 24 well plates, grown to confluence, serum-starved for 24 hours, and wounded with a P200 pipette tip. Migration in response to mammary fibroblast conditioned medium [60] was scored by measuring the [width of the wound area at 24 hours] ÷ [width of the wound area at 0 hours] as described previously [61].
Microscope image acquisition
Mammary gland whole-mounts and transwell filters were imaged with Olympus SZX12 Inverted Microscope. Slides were imaged with Olympus BX60 Stereo Microscope. Organoids, annexin V-FITC-staining, and wound closure assays were imaged with Olympus IX71 Inverted Microscope. All images were acquired by Olympus DP 72 Digital Camera and CellSens software at ambient temperature.
Ethics statement
All animals were housed under pathogen-free conditions, and experiments were performed in accordance with AAALAC guidelines and with Vanderbilt University Institutional Animal Care and Use Committee approval. The laboratory animal care program of Vanderbilt University (PHS Assurance #A3227-01) has been accredited by AAALAC International since 1967 (File #000020). The AAALAC Council on Accreditation's most recent review of VU's program was done in 2011 and resulted in "Continued Full Accreditation.” Isofluorane was used for anesthesia, as well as euthanasia. For human euthanasia, cervical dislocation was used following isofluorane overdose.
Supporting Information
Zdroje
1. Gjorevski N. and Nelson C.M., Integrated morphodynamic signalling of the mammary gland. Nat Rev Mol Cell Biol, 2011. 12(9): p. 581–93. doi: 10.1038/nrm3168 21829222
2. McNally S. and Martin F., Molecular regulators of pubertal mammary gland development. Ann Med, 2011. 43(3): p. 212–34. doi: 10.3109/07853890.2011.554425 21417804
3. Laplante M. and Sabatini D.M., mTOR signaling in growth control and disease. Cell, 2012. 149(2): p. 274–93. doi: 10.1016/j.cell.2012.03.017 22500797
4. Phung T.L., et al., Pathological angiogenesis is induced by sustained Akt signaling and inhibited by rapamycin. Cancer Cell, 2006. 10(2): p. 159–70. 16904613
5. Sarbassov D.D., et al., Prolonged rapamycin treatment inhibits mTORC2 assembly and Akt/PKB. Mol Cell, 2006. 22(2): p. 159–68. 16603397
6. Rosner M. and Hengstschlager M., Cytoplasmic and nuclear distribution of the protein complexes mTORC1 and mTORC2: rapamycin triggers dephosphorylation and delocalization of the mTORC2 components rictor and sin1. Hum Mol Genet, 2008. 17(19): p. 2934–48. doi: 10.1093/hmg/ddn192 18614546
7. Hong, S.M., et al., Rapamycin inhibits both motility through down-regulation of p-STAT3 (S727) by disrupting the mTORC2 assembly and peritoneal dissemination in sarcomatoid cholangiocarcinoma. Clin Exp Metastasis, 2012.
8. Jankiewicz M., Groner B., and Desrivieres S., Mammalian target of rapamycin regulates the growth of mammary epithelial cells through the inhibitor of deoxyribonucleic acid binding Id1 and their functional differentiation through Id2. Mol Endocrinol, 2006. 20(10): p. 2369–81. 16772532
9. Kim S.H., Zukowski K., and Novak R.F., Rapamycin effects on mTOR signaling in benign, premalignant and malignant human breast epithelial cells. Anticancer Res, 2009. 29(4): p. 1143–50. 19414357
10. Galbaugh T., et al., EGF-induced activation of Akt results in mTOR-dependent p70S6 kinase phosphorylation and inhibition of HC11 cell lactogenic differentiation. BMC Cell Biol, 2006. 7: p. 34. 16984645
11. Moriya H., et al., Secretion of three enzymes for fatty acid synthesis into mouse milk in association with fat globules, and rapid decrease of the secreted enzymes by treatment with rapamycin. Arch Biochem Biophys, 2011. 508(1): p. 87–92. doi: 10.1016/j.abb.2011.01.015 21281598
12. Pauloin A. and Chanat E., Prolactin and epidermal growth factor stimulate adipophilin synthesis in HC11 mouse mammary epithelial cells via the PI3-kinase/Akt/mTOR pathway. Biochim Biophys Acta, 2012. 1823(5): p. 987–96. doi: 10.1016/j.bbamcr.2012.02.016 22426621
13. Andrechek E.R., et al., Amplification of the neu/erbB-2 oncogene in a mouse model of mammary tumorigenesis. Proc Natl Acad Sci U S A, 2000. 97(7): p. 3444–9. 10716706
14. Shiota C., et al., Multiallelic disruption of the rictor gene in mice reveals that mTOR complex 2 is essential for fetal growth and viability. Dev Cell, 2006. 11(4): p. 583–9. 16962829
15. Burnett P.E., et al., RAFT1 phosphorylation of the translational regulators p70 S6 kinase and 4E-BP1. Proc Natl Acad Sci U S A, 1998. 95(4): p. 1432–7. 9465032
16. Ewald A.J., et al., Collective epithelial migration and cell rearrangements drive mammary branching morphogenesis. Dev Cell, 2008. 14(4): p. 570–81. doi: 10.1016/j.devcel.2008.03.003 18410732
17. McDonald P.C., et al., Rictor and integrin-linked kinase interact and regulate Akt phosphorylation and cancer cell survival. Cancer Res, 2008. 68(6): p. 1618–24. doi: 10.1158/0008-5472.CAN-07-5869 18339839
18. Zhang F., et al., mTOR complex component Rictor interacts with PKCzeta and regulates cancer cell metastasis. Cancer Res, 2010. 70(22): p. 9360–70. doi: 10.1158/0008-5472.CAN-10-0207 20978191
19. Agarwal N.K., et al., Rictor regulates cell migration by suppressing RhoGDI2. Oncogene, 2013. 32(20): p. 2521–6. doi: 10.1038/onc.2012.287 22777355
20. Schwertfeger K.L., Richert M.M., and Anderson S.M., Mammary gland involution is delayed by activated Akt in transgenic mice. Mol Endocrinol, 2001. 15(6): p. 867–81. 11376107
21. Ikenoue T., et al., Essential function of TORC2 in PKC and Akt turn motif phosphorylation, maturation and signalling. EMBO J, 2008. 27(14): p. 1919–31. doi: 10.1038/emboj.2008.119 18566587
22. Wullschleger S., Loewith R., and Hall M.N., TOR signaling in growth and metabolism. Cell, 2006. 124(3): p. 471–84. 16469695
23. Iden S. and Collard J.G., Crosstalk between small GTPases and polarity proteins in cell polarization. Nat Rev Mol Cell Biol, 2008. 9(11): p. 846–59. doi: 10.1038/nrm2521 18946474
24. Muthuswamy S.K. and Xue B., Cell polarity as a regulator of cancer cell behavior plasticity. Annu Rev Cell Dev Biol, 2012. 28: p. 599–625. doi: 10.1146/annurev-cellbio-092910-154244 22881459
25. Sun S.Y., et al., Activation of Akt and eIF4E survival pathways by rapamycin-mediated mammalian target of rapamycin inhibition. Cancer Res, 2005. 65(16): p. 7052–8. 16103051
26. O'Reilly K.E., et al., mTOR inhibition induces upstream receptor tyrosine kinase signaling and activates Akt. Cancer Res, 2006. 66(3): p. 1500–8. 16452206
27. Wang X., et al., Enhancing mammalian target of rapamycin (mTOR)-targeted cancer therapy by preventing mTOR/raptor inhibition-initiated, mTOR/rictor-independent Akt activation. Cancer Res, 2008. 68(18): p. 7409–18. doi: 10.1158/0008-5472.CAN-08-1522 18794129
28. Li, Y., et al., Protein phosphatase 2A and DNA-dependent protein kinase are involved in mediating rapamycin-induced Akt phosphorylation. J Biol Chem, 2013.
29. Guertin D.A., et al., Ablation in mice of the mTORC components raptor, rictor, or mLST8 reveals that mTORC2 is required for signaling to Akt-FOXO and PKCalpha, but not S6K1. Dev Cell, 2006. 11(6): p. 859–71. 17141160
30. Meyer D.S., et al., Luminal expression of PIK3CA mutant H1047R in the mammary gland induces heterogeneous tumors. Cancer Res, 2011. 71(13): p. 4344–51. doi: 10.1158/0008-5472.CAN-10-3827 21482677
31. Boxer R.B., et al., Isoform-specific requirement for Akt1 in the developmental regulation of cellular metabolism during lactation. Cell Metab, 2006. 4(6): p. 475–90. 17141631
32. Chen C.C., et al., Akt is required for Stat5 activation and mammary differentiation. Breast Cancer Res, 2010. 12(5): p. R72. doi: 10.1186/bcr2640 20849614
33. Chen C.C., et al., Autocrine prolactin induced by the Pten-Akt pathway is required for lactation initiation and provides a direct link between the Akt and Stat5 pathways. Genes Dev, 2012. 26(19): p. 2154–68. doi: 10.1101/gad.197343.112 23028142
34. Debnath J., Walker S.J., and Brugge J.S., Akt activation disrupts mammary acinar architecture and enhances proliferation in an mTOR-dependent manner. J Cell Biol, 2003. 163(2): p. 315–26. 14568991
35. Zhang B., Zhang Y., and Shacter E., Rac1 inhibits apoptosis in human lymphoma cells by stimulating Bad phosphorylation on Ser-75. Mol Cell Biol, 2004. 24(14): p. 6205–14. 15226424
36. Zhu W. and Nelson C.M., PI3K regulates branch initiation and extension of cultured mammary epithelia via Akt and Rac1 respectively. Dev Biol, 2013. 379(2): p. 235–45. doi: 10.1016/j.ydbio.2013.04.029 23665174
37. Baselga J., Targeting the phosphoinositide-3 (PI3) kinase pathway in breast cancer. Oncologist, 2011. 16 Suppl 1: p. 12–9. doi: 10.1634/theoncologist.2011-S1-12 21278436
38. Pollack M.N., Insulin, insulin-like growth factors, insulin resistance, and neoplasia. Am J Clin Nutr, 2007. 86(3): p. s820–2. 18265475
39. Sachdev D. and Yee D., The IGF system and breast cancer. Endocr Relat Cancer, 2001. 8(3): p. 197–209. 11566611
40. Fenton T.R. and Gout I.T., Functions and regulation of the 70kDa ribosomal S6 kinases. Int J Biochem Cell Biol, 2011. 43(1): p. 47–59. doi: 10.1016/j.biocel.2010.09.018 20932932
41. Serra, V., et al., RSK3/4 mediate resistance to PI3K pathway inhibitors in breast cancer. J Clin Invest, 2013.
42. Miller T.W., Balko J.M., and Arteaga C.L., Phosphatidylinositol 3-kinase and antiestrogen resistance in breast cancer. J Clin Oncol, 2011. 29(33): p. 4452–61. doi: 10.1200/JCO.2010.34.4879 22010023
43. Miller T.W., et al., Mutations in the phosphatidylinositol 3-kinase pathway: role in tumor progression and therapeutic implications in breast cancer. Breast Cancer Res, 2011. 13(6): p. 224. doi: 10.1186/bcr3039 22114931
44. Li G., et al., Conditional loss of PTEN leads to precocious development and neoplasia in the mammary gland. Development, 2002. 129(17): p. 4159–70. 12163417
45. Wander S.A., Hennessy B.T., and Slingerland J.M., Next-generation mTOR inhibitors in clinical oncology: how pathway complexity informs therapeutic strategy. J Clin Invest, 2011. 121(4): p. 1231–41. doi: 10.1172/JCI44145 21490404
46. Janku F., et al., PIK3CA mutations in patients with advanced cancers treated with PI3K/AKT/mTOR axis inhibitors. Mol Cancer Ther, 2011. 10(3): p. 558–65. doi: 10.1158/1535-7163.MCT-10-0994 21216929
47. Janku F., et al., PI3K/AKT/mTOR inhibitors in patients with breast and gynecologic malignancies harboring PIK3CA mutations. J Clin Oncol, 2012. 30(8): p. 777–82. doi: 10.1200/JCO.2011.36.1196 22271473
48. Janku F., et al., PIK3CA mutation H1047R is associated with response to PI3K/AKT/mTOR signaling pathway inhibitors in early-phase clinical trials. Cancer Res, 2013. 73(1): p. 276–84. doi: 10.1158/0008-5472.CAN-12-1726 23066039
49. Li H., et al., Targeting of mTORC2 prevents cell migration and promotes apoptosis in breast cancer. Breast Cancer Res Treat, 2012. 134(3): p. 1057–66. doi: 10.1007/s10549-012-2036-2 22476852
50. Hietakangas V. and Cohen S.M., TOR complex 2 is needed for cell cycle progression and anchorage-independent growth of MCF7 and PC3 tumor cells. BMC Cancer, 2008. 8: p. 282. doi: 10.1186/1471-2407-8-282 18831768
51. Wazir U., et al., Prognostic and therapeutic implications of mTORC1 and Rictor expression in human breast cancer. Oncol Rep, 2013. 29(5): p. 1969–74. doi: 10.3892/or.2013.2346 23503572
52. Serrano I., et al., Role of the integrin-linked kinase (ILK)/Rictor complex in TGFbeta-1-induced epithelial-mesenchymal transition (EMT). Oncogene, 2013. 32(1): p. 50–60. doi: 10.1038/onc.2012.30 22310280
53. Kim H.Y. and Nelson C.M., Extracellular matrix and cytoskeletal dynamics during branching morphogenesis. Organogenesis, 2012. 8(2): p. 56–64. doi: 10.4161/org.19813 22609561
54. Schnelzer A., et al., Rac1 in human breast cancer: overexpression, mutation analysis, and characterization of a new isoform, Rac1b. Oncogene, 2000. 19(26): p. 3013–20. 10871853
55. Fritz G., et al., Rho GTPases in human breast tumours: expression and mutation analyses and correlation with clinical parameters. Br J Cancer, 2002. 87(6): p. 635–44. 12237774
56. Katz E., et al., Targeting of Rac GTPases blocks the spread of intact human breast cancer. Oncotarget, 2012. 3(6): p. 608–19. 22689141
57. Brantley-Sieders D.M., et al., The receptor tyrosine kinase EphA2 promotes mammary adenocarcinoma tumorigenesis and metastatic progression in mice by amplifying ErbB2 signaling. J Clin Invest, 2008. 118(1): p. 64–78. 18079969
58. Qu S., et al., Gene targeting of ErbB3 using a Cre-mediated unidirectional DNA inversion strategy. Genesis, 2006. 44(10): p. 477–86. 16991114
59. Brantley-Sieders D.M., et al., EphA2 receptor tyrosine kinase regulates endothelial cell migration and vascular assembly through phosphoinositide 3-kinase-mediated Rac1 GTPase activation. J Cell Sci, 2004. 117(Pt 10): p. 2037–49. 15054110
60. Cheng N., et al., Transforming growth factor-beta signaling-deficient fibroblasts enhance hepatocyte growth factor signaling in mammary carcinoma cells to promote scattering and invasion. Mol Cancer Res, 2008. 6(10): p. 1521–33. doi: 10.1158/1541-7786.MCR-07-2203 18922968
61. Liang C.C., Park A.Y., and Guan J.L., In vitro scratch assay: a convenient and inexpensive method for analysis of cell migration in vitro. Nat Protoc, 2007. 2(2): p. 329–33. 17406593
Štítky
Genetika Reprodukční medicínaČlánek vyšel v časopise
PLOS Genetics
2015 Číslo 7
Nejčtenější v tomto čísle
- Functional Constraint Profiling of a Viral Protein Reveals Discordance of Evolutionary Conservation and Functionality
- Reversible Oxidation of a Conserved Methionine in the Nuclear Export Sequence Determines Subcellular Distribution and Activity of the Fungal Nitrate Regulator NirA
- Modeling Implicates in Nephropathy: Evidence for Dominant Negative Effects and Epistasis under Anemic Stress
- Nutritional Control of DNA Replication Initiation through the Proteolysis and Regulated Translation of DnaA