
BMI and Risk of Serious Upper Body Injury Following Motor Vehicle Crashes: Concordance of Real-World and Computer-Simulated Observations
Background:
Men tend to have more upper body mass and fat than women, a physical characteristic that may predispose them to severe motor vehicle crash (MVC) injuries, particularly in certain body regions. This study examined MVC-related regional body injury and its association with the presence of driver obesity using both real-world data and computer crash simulation.
Methods and Findings:
Real-world data were from the 2001 to 2005 National Automotive Sampling System Crashworthiness Data System. A total of 10,941 drivers who were aged 18 years or older involved in frontal collision crashes were eligible for the study. Sex-specific logistic regression models were developed to analyze the associations between MVC injury and the presence of driver obesity. In order to confirm the findings from real-world data, computer models of obese subjects were constructed and crash simulations were performed. According to real-world data, obese men had a substantially higher risk of injury, especially serious injury, to the upper body regions including head, face, thorax, and spine than normal weight men (all p<0.05). A U-shaped relation was found between body mass index (BMI) and serious injury in the abdominal region for both men and women (p<0.05 for both BMI and BMI2). In the high-BMI range, men were more likely to be seriously injured than were women for all body regions except the extremities and abdominal region (all p<0.05 for interaction between BMI and sex). The findings from the computer simulation were generally consistent with the real-world results in the present study.
Conclusions:
Obese men endured a much higher risk of injury to upper body regions during MVCs. This higher risk may be attributed to differences in body shape, fat distribution, and center of gravity between obese and normal-weight subjects, and between men and women.
: Please see later in the article for the Editors' Summary
Published in the journal:
. PLoS Med 7(3): e32767. doi:10.1371/journal.pmed.1000250
Category:
Research Article
doi:
https://doi.org/10.1371/journal.pmed.1000250
Summary
Background:
Men tend to have more upper body mass and fat than women, a physical characteristic that may predispose them to severe motor vehicle crash (MVC) injuries, particularly in certain body regions. This study examined MVC-related regional body injury and its association with the presence of driver obesity using both real-world data and computer crash simulation.
Methods and Findings:
Real-world data were from the 2001 to 2005 National Automotive Sampling System Crashworthiness Data System. A total of 10,941 drivers who were aged 18 years or older involved in frontal collision crashes were eligible for the study. Sex-specific logistic regression models were developed to analyze the associations between MVC injury and the presence of driver obesity. In order to confirm the findings from real-world data, computer models of obese subjects were constructed and crash simulations were performed. According to real-world data, obese men had a substantially higher risk of injury, especially serious injury, to the upper body regions including head, face, thorax, and spine than normal weight men (all p<0.05). A U-shaped relation was found between body mass index (BMI) and serious injury in the abdominal region for both men and women (p<0.05 for both BMI and BMI2). In the high-BMI range, men were more likely to be seriously injured than were women for all body regions except the extremities and abdominal region (all p<0.05 for interaction between BMI and sex). The findings from the computer simulation were generally consistent with the real-world results in the present study.
Conclusions:
Obese men endured a much higher risk of injury to upper body regions during MVCs. This higher risk may be attributed to differences in body shape, fat distribution, and center of gravity between obese and normal-weight subjects, and between men and women.
: Please see later in the article for the Editors' Summary
Introduction
Motor vehicle accidents are the leading cause of injury-related death in the United States. In 2005, approximately 45,000 persons died and more than 3 million persons were injured in motor vehicle accidents in the United States [1]. The estimated economic cost of motor vehicle accidents in 2005 was approximately 230 billion dollars [2]. Establishing the mechanisms, risk factors, and potential preventive strategies for motor vehicle accidents is a major goal of public health efforts.
A large body mass with excess adiposity may contribute to motor vehicle crash (MVC) injuries in several ways, although little is known about the relation between obesity and the risk of injury. Our previous study identified sex differences in the relations between MVC fatality and body mass index (BMI) [3]. Men had a higher risk of death at both the high and low ends of the BMI continuum, whereas this pattern was not present in women. The cause of this differential association between BMI and MVC-related death between men and women is presently unknown.
One potential mechanism for sex differences in the risk of injury in MVCs is that body shape and fat distribution are important markers of mortality and injury risk. Fat distribution differs between men and women, including the amount and proportion of subcutaneous and visceral fat along with related waist and hip girths. The gynoid pattern with lower body adiposity, as defined in 1947 by Vague [4], is most frequently observed in women, whereas upper body adiposity is typical of men [5]–[7]. Does the sex difference in body shape and fat distribution affect injury severity and pattern during an MVC?
We investigated the association between obesity as defined by BMI and regional injuries during MVCs on the basis of both real-world nationally representative data and simulated crash data using computational models of obese occupants. The aim of this study was to explore the potential contribution of sex-specific differences in body shape towards the pattern and severity of injuries. We hypothesized that the risk of regional body injuries would increase with BMI in both men and women and that this weight-related increase would be more significant among men.
Methods
Real-World Data Analysis
Study population
We used data from the Crashworthiness Data System (CDS) of the National Automotive Sampling System (NASS). The NASS CDS is a nationally representative database containing information on accidents, vehicles, and occupants [8],[9].
We initially included as potential subjects 13,710 passenger car or truck drivers aged 18 y and older involved in frontal-collision MVCs from 2001 to 2005. From this cohort, 2,547 subjects were excluded for the following reasons: pregnant female driver (n = 111), sex unknown (n = 8), death from other reasons (n = 51), death with injury unknown (n = 51), treatment status unknown (n = 242), and lack of information on height or weight (n = 2,287). In addition, 222 subjects with a BMI (in kg/m2) less than 17.3 (n = 111) or greater than 46.0 (n = 111)—the points that approximately corresponded to the 1st and 99th percentiles of the BMI distribution in the database—were excluded to avoid potential bias that might have been caused by measurement or input errors. Therefore, a total of 10,941 subjects were included in the analysis, of whom 61.4% were men and 38.6% women.
Outcome definition
The primary outcome variable was drivers' regional body injury as measured by using the Abbreviated Injury Scale (AIS), the most widely used anatomic scale for rating severity of injuries. The body regions included the head, face, thorax, abdomen, spine, upper extremities, and lower extremities. Having a regional body injury was defined as an AIS >0 for any of the evaluated body regions, whereas having a serious regional body injury was defined as an AIS >2 [10].
Statistical analysis
Data are presented as means (for continuous variables) or as percentages (for categorical variables) with 95% confidence intervals (CIs). The characteristics of drivers, collisions, and the environment were compared by using t-tests (for continuous variables) or chi-square tests (for categorical variables) between the sexes. Logistic regression was used to examine the relations between each regional body injury with BMI (BMI and BMI2) after adjustment for potential confounding factors for male and female drivers separately. Before building sex-specific regression models, the data for men and women were pooled, and the interaction between sex and BMI (BMI and BMI2) was tested by using the same logistic regression model to examine whether the interaction term was significant. The potential confounding factors included in the regression model were age, race, type of vehicle, vehicle age and weight, alcohol or drug use, seatbelt use, airbag deployment, ejection, rollover, number of vehicles involved, road speed limit, light, and weather conditions. Sensitivity analysis for every factor was tested by including or excluding it in the model to detect its impact on the models and results. Seat belt use is an important variable because unbelted drivers are at much higher risk of injury and could therefore skew the results. Thus, models were estimated for belted, unbelted, and pooled drivers to detect any potential skewing of the results.
Two logistic regression models were developed: (1) the all subjects model, which included all subjects, and (2) the change of velocity model (ΔV model), which included information on the change of velocity during the crash (ΔV, km/h). Approximately 44% of the subjects had no ΔV information in the NASS CDS datasets. ΔV was measured by NHTSA as part of the NASS data collection process using a computer program (WinSMASH, National Highway Traffic Safety Administration, Washington [D.C.]) that reconstructs a single 2-D vehicle-to-vehicle impact or a vehicle-to-large-object impact that resembles a barrier collision [8]. The characteristics of the subjects with and without ΔV information were compared. In addition, the relations between BMI and regional body injuries between subjects with and without ΔV information were examined by testing the interaction terms between BMI and the ΔV group indicator by the same logistic regression model.
To produce nationally representative estimates, all analyses incorporated sampling weights. Weighted means, percentages, odds ratios (ORs), and standard errors (SEs) were calculated by using Stata software (Version 10.0, Stata Corp.) to adjust for the complex NASS CDS sampling design. Statistical significance was set at p<0.05 (two-tailed). Since there were a large number of regression tests in present study, a conservative approach would be to apply the Bonferroni correction. However, following the guidelines by Bailar and Mosteller [11], we chose not to apply the Bonferroni correction per se, but rather reported the per test alpha level the Bonferroni correction would require (i.e., α is set as 0.05 divided by the number of tests, 0.05/168 = 0.0003). Therefore, we referred to each p-value as “not statistically significant” if p≥0.05, as “significant at the uncorrected nominal 0.05 level” if p<0.05, and as “significant even at the Bonferroni corrected level” if p<0.0003.
Computer Modeling and Crash Simulation
Mathematical Dynamic Models, MADYMO version 7.0 (TNO, The Netherlands), was used for model simulation of a vehicle frontal impact tests. Male (BMI 30 and 35, height 1.77 m) and female (BMI 30 and 35, height 1.52 m) obese dummy models were developed on the basis of the well-validated, widely used, and computationally efficient MADYMO hybrid III dummy models: 50th percentile male (BMI 25, height 1.77 m) and 5th percentile female (BMI 22, height 1.52 m), respectively.
To take account of subcutaneous adipose tissue of obese subjects into the computer models, mask files of adipose tissue (color-coded for each anatomical region) acquired from grey-scale MRI datasets were utilized in this study [12],[13]. The exempt status of using the existing de-identified datasets for reconstruction was reviewed and approved by the Institutional Review Board of St. Luke's-Roosevelt Hospital. Each dataset consists of ∼43 mask files of adipose tissue generated from DICOM (Digital Imaging and Communications in Medicine) images with a 256 by 256 pixel resolution for each slice. A specialized computer tool was developed to reconstruct the adipose tissue regions into a 3-D geometry by discrete points in a triangulated manner. On the basis of the geometry data, finite element models for torso subcutaneous adipose tissue were developed. The torso adipose tissue model, which has the hyperelastic properties [14] and density (900 kg/m3) [15] of human subcutaneous adipose tissue, was then integrated into the standard MADYMO dummy models to represent obese occupants. The inertial parameters and sizes of limbs were increased as BMI increased.
The standard and obese dummy models were validated against experimental data from a set of sled tests with postmortem human surrogates (PMHS) [16]. The averaged test data from five nonobese males (mean height 1.77 m, weight 63.5 kg, BMI 20.3) and three obese subjects (mean height 1.79 m, weight 128.0 kg, BMI 40.1) were used to validate the standard male (BMI 25) and obese male (BMI 35) dummy models, respectively. The dummy models were seated in the rear seat with a force-limiting, pre-tensioning seatbelt system. The specific characteristics of the restraint system and crash pulse used in the PMHS tests were replicated in MADYMO model simulation to compare kinematics and trajectories.
Once the models were validated, they were used to examine the risk of injury to drivers during frontal crashes. A baseline configuration (referred to as Case 1) of the occupant restraint system is the following. The seat belt was equipped with buckle and retractor pre-tensioners and a load limiter with a maximum force of 4 kN. A crash deceleration pulse from a full rigid frontal barrier impact (ΔV = 56 km/h) [17] and a mass flow rate for airbag deployment [18] from literature were used. The seat belt webbing elongation was set to 10% at 10 kN force. Case studies were performed to consider a variety of restraint systems and crash pulses.
Case 2: No pre-tensioners and load limiter were equipped.
Case 3: The mass flow rate of the airbag was depowered by about 20%.
Case 4: The steering wheel angle was tilted 10 degrees downward.
Case 5: The crash deceleration pulse was scaled up to 1.2 times.
From the MADYMO simulation results, the following four regional body injuries were measured. The head injury criterion (HIC) is a measure of the likelihood of head injury based on acceleration at the center of gravity of the dummy's head. The neck injury criterion, called Nij, proposes critical limits for all four possible modes of neck loading: tension or compression combined with either flexion (forward) or extension (rearward) bending moment. The chest acceleration and chest deflection are used for thoracic injury criteria. The lower extremity criterion (LEC) is a measure of femur load for tolerance of leg injury. The details of these injury criteria can be found in literature [19]. No criteria for the face, spine, abdomen, and upper extremity, however, were specified.
Results
The characteristics of the drivers, crashes, and environment of the crash by sex are shown in Table 1. Male drivers had on average higher mean BMI than female drivers. A greater proportion of female drivers than male drivers were driving passenger cars, were wearing seatbelts, and were in vehicles in which an airbag deployed. Female drivers were also driving relatively newer cars. Male drivers were driving vehicles with a higher vehicle weight and ΔV during the crash and were more likely to be involved in crashes involving alcohol use, ejection, and rollover. Male drivers were also more likely to have single-vehicle collisions than were female drivers. More male drivers had MVCs on roads with speed limits of 80 to 105 km/h, whereas more female drivers had crashes on roads with speed limits of 48 to 80 km/h. In addition, male drivers were involved in MVCs more frequently at night than were female drivers.

Except for injuries to the head, face, and abdomen, the percentages of injury (injured versus not injured) to the thorax, spine, and upper and lower extremities were all higher for women than for men. However, the percentages of serious injury (seriously injured versus not seriously injured) to all body regions except for the thorax, abdomen, and upper extremity were greater for men than for women. Shown in Table 2 are the coefficients derived from the logistic regression of BMI (BMI and BMI2) for each regional body injury measured by each of two outcomes, injured versus not injured (left) and seriously injured versus not seriously injured (right), in the all subjects model (upper) and in the ΔV model (lower). In the all subjects model, the sex difference was present only for injuries to the lower extremities for the injured versus not injured outcome. In the ΔV model, regional body injuries to the face, thorax, and abdomen differed significantly between male and female drivers for the injured versus not injured outcome and regional body injuries to the head, thorax, and spine differed significantly between male and female drivers for the seriously injured versus not seriously injured outcome.
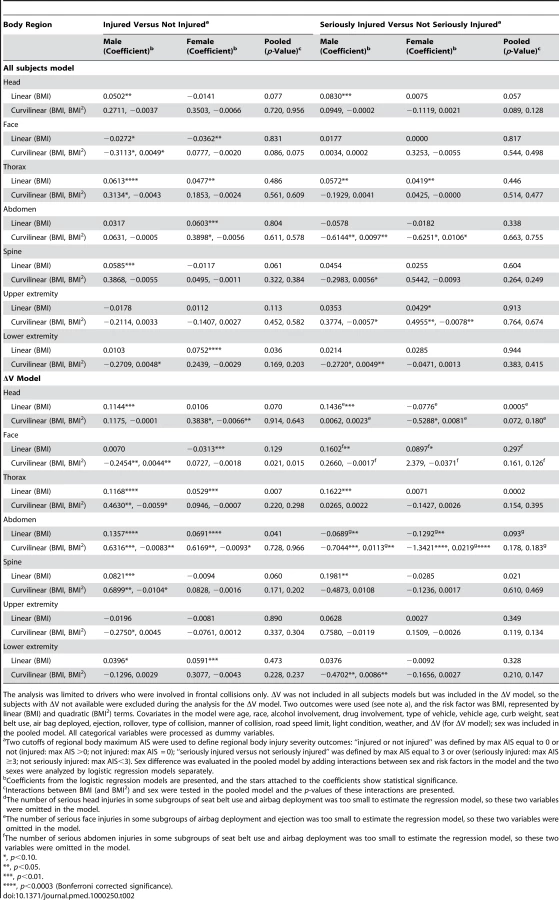
The adjusted ORs derived from the logistic regression in the ΔV model of the BMI continuum for head, face, thorax, and spine injuries are shown in Figure 1. The adjusted ORs for the abdomen, upper extremity, and lower extremity are shown in Figure 2. Compared to nonobese male drivers, obese male drivers had a higher risk for injury and serious injury to the head, thorax, and spine. Male drivers had a higher risk of being injured in the head, thorax, and spine for both outcomes, injured versus not injured and seriously injured versus not seriously injured, than did female drivers. In addition, a U-shaped relation between BMI and serious injury in the abdominal region was found for both male and female drivers.


Information was missing on ΔV for approximately 44% of drivers. Drivers' age, BMI, and proportions of race-ethnicities did not differ significantly between the groups for which ΔV was available or not. A higher proportion of subjects in the ΔV group were injured in the thorax, spine, and upper and lower extremities, and a lower proportion of subjects were seriously injured in the spine. The interaction terms between ΔV group and BMI (or BMI and BMI2) were not significant except for abdomen and upper extremity injuries for the injured versus not injured outcome and for face injury for the seriously injured versus not seriously injured outcome.
Figure 3 illustrates the standard and obese dummies used in the model simulations for male and female. All of the male dummies have the same height as 1.77 m. The weights of the male dummies are 78.4, 92.7, and 110.0 kg for the BMI 25, 30, and 35 models, respectively. The weight of torso subcutaneous adipose tissue was 9.4 kg for the BMI 30 model and 13.5 kg for BMI 35 model. All of the female dummies have the same height of 1.52 m. The weights of the female dummies are 49.3, 69.4, and 80.8 kg for the BMI 22, 30, and 35 models, respectively. The weight of torso subcutaneous adipose tissue was 14.3 kg for the BMI 30 model and 17.2 kg for BMI 35 model.

Figure 4 shows the result of model validation study. The body kinematics of standard and obese dummies was consistent with that of PMHS subjects. Even though the body excursion of the obese dummy was predicted to be less than that of the PMHS subjects due to dummy's lighter weight (110 kg) than the subjects (mean weight 128 kg) used in the experiment, the decreased torso pitch induced by increased hip excursion of the obese subjects was well predicted in the model simulation. The ratios of shoulder excursion to hip excursion were 1.12 (simulation) and 1.23±0.37 (experiment) for obese subjects, and 1.82 (simulation) and 2.05±0.80 (experiment) for nonobese subjects.
![Comparison of head, shoulder, hip, and knee excursions between model simulation and experiment <em class="ref">[16]</em>.](https://pl-master.mdcdn.cz/media/cache/media_object_image_large/media/image/1b4e9b288e3902b919323ebcec78e776.png)
Videos S1 and S2 are the animated results of the model simulation to compare the kinematics of the standard and obese dummies (BMI 35) during a frontal crash (Case 1) for male and female, respectively. From the simulation outcomes, the regional body injuries (head injury criterion [HIC], neck injury criterion [Nij], thorax, and lower extremity criterion [LEC]), which are based on the mechanical responses (regional acceleration, force, moment, deflection) from the six different dummies shown in Figure 3, were measured for each simulation case (total five cases). Figures 5–9 show the variations of the injury measures as BMI increases, for head, neck, thorax (chest acceleration and deflection), and lower extremity, respectively. From the results, obese males have a much increased risk of injury (especially head, chest acceleration, chest deflection, and lower extremity) as compared to the standard male. Meanwhile, obese females have much increased (chest acceleration), slightly increased (head and lower extremity), or decreased (neck and chest deflection) risk of injury as compared to the standard female.


According to the results of sensitivity analysis, no factors showed a significant impact on the models except for ΔV; however, crashes with ΔV available have been analyzed separately in our study. Results for belted and unbelted drivers were calculated separately and compared to the results for all drivers. Both belted and unbelted drivers showed very similar injury patterns with the results of both combined, especially for upper body regions, in all outcome models that could be estimated successfully (101 out of 112 models). In the other 11 cases (for example, serious facial injury in the all-subjects model for females, serious upper extremity injury in the ΔV models for both sexes), sample sizes in some covariate combinations were insufficient to estimate the models. Given this robust experience with sensitivity analysis, we have reported results for combined analyses that retain seat belt use as an indicator covariate in all models.
Discussion
This study used both real-world and computer crash simulation data to examine injury patterns in MVCs, associations between BMI and regional body injury, and the differences in these associations by sex. From the real-world data, we found that obese male drivers have a substantially higher risk for injury, especially serious injury, to the upper body regions of the head, face, thorax, and spine. Obese female drivers, by contrast, have a slightly increased risk for injury to the thorax, abdomen, and lower extremities but a decreased risk for injury to the face. In addition, we found a U-shaped relation between BMI and serious injury in the abdominal body region for both men and women. The sex difference in the association between BMI and risk of injury and serious injury was found in head, thorax, and spine. In the high BMI range, male drivers were more likely to be seriously injured than were female drivers for all body regions except for extremities and abdominal region. The computer simulation crash test results confirmed the findings from real-world observations showing that obese men experienced a higher risk of upper body injury than did nonobese men.
The associations between obesity and regional body injury are not well understood. In the present study, these associations are identified and we find that obese male drivers have a higher risk for injury and serious injury to the head, face, thorax, and spine than do nonobese male drivers. The findings were also confirmed by computer simulations of crash tests in this study. This finding of a higher risk of head injury for obese male drivers is consistent with an earlier study that was based on the same database [20]. However, the study population in that study was passengers and both male and female passengers were pooled together, thus different injury patterns for two sexes were not addressed in the study. The findings of the present study differ from other previous studies. Studies conducted by Boulanger et al. [21] and Moran et al. [22] found that obese patients suffered less head injury in MVCs than did nonobese patients. Those authors explained that these fewer head injuries were because of the small head/torso mass ratio of obese persons and because the torso could sustain the crash impact and spare the head from injury. The different results in the present study might be due to differences in the definitions of obesity and health outcomes and the databases used. Our findings for thoracic injury confirm the results of previous studies in which obese drivers had a greater risk of injury than did nonobese drivers [21]–[23].
Both obese men and obese women showed an increased risk of abdominal injury in the present study, which contrasts with the results of previous studies [21],[22],[24]. However, for the risk of serious abdominal injury, the current results confirm the previous results that overweight (25≤BMI<30) persons have a lower risk, but obese (BMI ≥30) persons have a much higher risk than the nonobese. For obese persons, the increase in energy transfer and momentum might override this protection effect and cause more severe injury [24].
Obese male drivers had a higher risk of injury in all upper body regions, including the head, face, thorax, abdomen, and spine, than did obese female drivers. For serious injury, the risk was higher in obese male drivers than in female drivers in the upper body regions of the head, thorax, and spine. The reasons for these differences are still unknown; however, the body fat distribution, body shape, and center of gravity may play an important role in the different injury patterns and severity of injury between men and women. In our analysis of the center of gravity with use of MRI technology, we found that men have a higher center of gravity than do women, especially among the obese [25]. A higher center of gravity interacting with a change of velocity might cause a greater force toward the upper body regions in male drivers.
The higher risk of injury for male drivers associated with a high BMI could be caused by some combination of momentum effects, comorbidities of obesity, and the body's response to crash and injury as the result of the anatomical and physiological changes with obesity [23],[26]–[30]. Current vehicle cabin design is in accordance with the Federal Motor Vehicle Safety Standard that used the 50th percentile male Hybrid III Crash Dummy (H3CD, 1.78 m, 77.11 kg in the driver's position, BMI = 24.3 kg/m2) [22]. These cabin designs may not be optimal for drivers whose body size and shape differ considerably from the standard specifications and may contribute to an increased risk of injury for persons in the high BMI ranges [31],[32].
Socioeconomic status (SES) has been associated with obesity, thus the different pattern of crash and injury severity between obese and nonobese people may result from SES inequality. In this study, we have adjusted several SES-related variables, such as race/ethnicity, vehicle age, vehicle type, and vehicle curb weight. However, most SES variables, such as education, income, and occupation are not available in NASS CDS database. In the current study, sex difference was found for the pattern of regional body injury between men and women. SES should have a similar effect on injury pattern for both genders after controlling vehicle-related variables, thus this sex difference of body regional injury could not be explained by possible SES inequality. Several previous studies have demonstrated the role of SES on the severity of MVCs [33]–[35]. During the analyses in this study, the variables related to the severity of MVCs, such as the change in velocity (ΔV) and type of collision were adjusted; however, the obese people experienced more severe outcomes even when controlling for severity of crashes.
The results of our study should be interpreted in light of several limitations and strengths. Approximately 19.6% of the drivers who were eligible for the study were subsequently excluded from the analyses. Missing data was the leading cause of these exclusions and might have caused bias in either direction in the associations found in both sexes. However, it was not likely that such exclusions affected the results beyond decreasing the precision of the statistical estimates [22]. Bias may have occurred in the ΔV model, because ΔV information was not available for 44.6% of the drivers. Our additional analyses, however, indicated no significant differences in demographic variables between the groups for which ΔV information was available or not. Significant differences were found in some collision and environment-related variables, which may have been because of the difficulties of measuring ΔV in some kinds of collisions and environments [8]. Our analyses were restricted to frontal collisions, which may have somewhat reduced the effects of inaccuracies on ΔV measurements. Because of the lack of comorbidity data in the NASS CDS, comorbidity was not included in the models. Baseline illness such as vision impairment was not controlled in our analysis because it was not available in the database. Sitting height may be more appropriate as an anthropometry index for occupants sitting in the vehicles; however, it was not available in the database. A potential limitation of the computational study is that the hybrid III ellipsoidal dummy models were used as baseline models. Even though the body kinematics was well predicted with those models, details of biomechanical responses (i.e., regional stress and strain) of bone, joint, and tissue could not be obtained. Future efforts could go towards a more robust validation and simulation with more “human-like” models such as the facet or finite element model, when fully validated models for both male and female are available.
Our study had several strengths. This study examined the patterns of associations between BMI and regional body injury severity and the differences in these associations by sex. Our study integrated both real-world data and computer simulation crash tests designed to evaluate regional body injuries during MVC. The findings of the present study may contribute to our understanding of the potential mechanism of sex-specific effect of obesity on MVC injury. If the mechanisms can be established, corresponding applications to vehicle safety designs could be customized and provided to obese people for better protection. All potential covariates and confounders from literature and our previous studies were included in our regression models, and simultaneously adjusting for these covariates and confounders allowed us to identify the correlation between BMI and regional body injury severity over and above these factors. The large number of observations in the NASS CDS dataset used enabled us to describe the associations between BMI and regional body injury at an individual level with a high degree of statistical precision. We focused on frontal collisions and used separate analyses for men and women to eliminate potential differences in sex, causal pathways, and confounding factors between drivers and passengers among different collision types.
Conclusions
Our study identified the relation of BMI to regional body injuries and their severity using both real-world and computer crash simulation data. Our findings are consistent with the previously observed BMI-related fatality risk profile. This observation implies that mechanical factors may be implicated in this risk. Such factors, if further elucidated, can be addressed by motor vehicle design changes. In addition, the observed sex differences may be related to differences in body shape, center of gravity, and adipose tissue distribution. A more precise connection between these factors cannot be made at this time without further investigations into the biomechanical responses of the human body considering a variety of dummy models configurations with different height and weight, various crash acceleration/deceleration pulses and occupant restraint systems, and other aspects that may lead to injury. Nonetheless, our findings may have important implications for high-risk cohort identification (e.g., obese male drivers), traffic safety intervention, policymaking, and for motor vehicle design to protect more vulnerable body regions.
Supporting Information
Zdroje
1. National Center for Injury Prevention and Control 2006 Injury fact book 2006. Atlanta (Georgia) Centers for Disease Control and Prevention
2. NHTSA 2005 Traffic safety facts 2005: a compilation of motor vehicle crash data from the fatality analysis reporting system and the general estimates system. Washington (D.C.) US Department of Transportation (DOT HS 810631)
3. ZhuS
LaydePM
GuseCE
LaudPW
PintarF
2006 Obesity and risk for death due to motor vehicle crashes. Am J Public Health 96 734 739
4. VagueJ
1996 Sexual differentiation. A determinant factor of the forms of obesity. 1947. Obes Res 4 201 203
5. EnziG
GasparoM
BiondettiPR
FioreD
SemisaM
1986 Subcutaneous and visceral fat distribution according to sex, age, and overweight, evaluated by computed tomography. Am J Clin Nutr 44 739 746
6. RossR
ShawKD
RissanenJ
MartelY
de GuiseJ
1994 Sex differences in lean and adipose tissue distribution by magnetic resonance imaging: anthropometric relationships. Am J Clin Nutr 59 1277 1285
7. LarssonI
Berteus ForslundH
LindroosAK
LissnerL
NaslundI
2004 Body composition in the SOS (Swedish Obese Subjects) reference study. Int J Obes Relat Metab Disord 28 1317 1324
8. NHTSA 2000 National Automotive Sampling System (NASS), Crashworthiness Data System (CDS), Analytic User's Manual. Washington (D.C.) US Department of Transportation
9. NHTSA 2000 National Automotive Sampling System (NASS) Crashworthiness Data System (CDS), Coding and Editing Manual. Washington (D.C.) US Department of Transportation
10. Association for the Advancement of Automotive Medicine 1990 The abbreviated injury scale: 1990 revision. Des Plaines (Illinois) Association for the Advancement of Automotive Medicine
11. BailarJC3rd
MostellerF
1988 Guidelines for statistical reporting in articles for medical journals. Amplifications and explanations. Ann Intern Med 108 266 273
12. ShenW
ChenJ
2008 Application of imaging and other noninvasive techniques in determining adipose tissue mass. Methods Mol Biol 456 39 54
13. ShenW
PunyanityaM
WangZ
GallagherD
St-OngeMP
2004 Total body skeletal muscle and adipose tissue volumes: estimation from a single abdominal cross-sectional image. J Appl Physiol 97 2333 2338
14. ToddBA
ThackerJG
1994 Three-dimensional computer model of the human buttocks, in vivo. J Rehabil Res Dev 31 111 119
15. FidanzaF
KeysA
AndersonJT
1953 Density of body fat in man and other mammals. J Appl Physiol 6 252 256
16. KentRW
FormanJL
BostromO
2009 Is there really a “cushion effect”?: a biomechanical investigation of crash injury mechanisms in the obese. Obesity. In press
17. RouhanaSW
BedewiPG
KankanalaSV
PrasadP
ZwolinskiJJ
2003 Biomechanics of 4-point seat belt systems in frontal impacts. Stapp Car Crash J 47 367 399
18. KiuchiT
1998 A simulation study on inflation induced injury and NCAP with depowered airbag. 2518 2525 Proceedings of the 16th International Technical Conference on the Enhanced Safety of Vehicles; 1998; Windsor (Ontario): National Highway Traffic Safety Administration.
19. EppingerR
SunE
KuppaS
SaulR
2000 Supplement: development of improved injury criteria for the assessment of advanced automotive restraint systems - II, National Highway Traffic Safety Administration, Technical Report. Washington (D.C.) US Department of Transportation
20. TagliaferriF
CompagnoneC
YoganandanN
GennarelliTA
2009 Traumatic brain injury after frontal crashes: relationship with body mass index. J Trauma 66 727 729
21. BoulangerBR
MilzmanD
MitchellK
RodriguezA
1992 Body habitus as a predictor of injury pattern after blunt trauma. J Trauma 33 228 232
22. MoranSG
McGwinGJr
MetzgerJS
WindhamST
ReiffDA
2002 Injury rates among restrained drivers in motor vehicle collisions: the role of body habitus. J Trauma 52 1116 1120
23. MockCN
GrossmanDC
KaufmanRP
MackCD
RivaraFP
2002 The relationship between body weight and risk of death and serious injury in motor vehicle crashes. Accid Anal Prev 34 221 228
24. ArbabiS
WahlWL
HemmilaMR
Kohoyda-InglisC
TaheriPA
2003 The cushion effect. J Trauma 54 1090 1093
25. ZhuS
MaX
ShenW
McGinleyE
LaudP
2008 Does body composition play a role in motor vehicle injury? Abstract of the 8th International Symposium on In Vivo Body Composition Studies; New York, New York; 87-P
26. StoohsRA
GuilleminaultC
ItoiA
DementWC
1994 Traffic accidents in commercial long-haul truck drivers: the influence of sleep-disordered breathing and obesity. Sleep 17 619 623
27. Teran-SantosJ
Jimenez-GomezA
Cordero-GuevaraJ
1999 The association between sleep apnea and the risk of traffic accidents. Cooperative Group Burgos-Santander. N Engl J Med 340 847 851
28. PericasJ
MunozA
FindleyL
AntoJM
Barbe 1998 Automobile accidents in patients with sleep apnea syndrome. An epidemiological and mechanistic study. Am J Respir Crit Care Med 158 18 22
29. YeeB
CampbellA
BeasleyR
NeillA
2002 Sleep disorders: a potential role in New Zealand motor vehicle accidents. Intern Med J 32 297 304
30. GeorgeCF
2001 Reduction in motor vehicle collisions following treatment of sleep apnoea with nasal CPAP. Thorax 56 508 512
31. ZizzaC
HerringAH
StevensJ
PopkinBM
2004 Length of hospital stays among obese individuals. Am J Public Health 94 1587 1591
32. NevilleAL
BrownCV
WengJ
DemetriadesD
VelmahosGC
2004 Obesity is an independent risk factor of mortality in severely injured blunt trauma patients. Arch Surg 139 983 987
33. BlowsS
IversRQ
ConnorJ
AmeratungaS
NortonR
2003 Car insurance and the risk of car crash injury. Accid Anal Prev 35 987 990
34. HarperJS
MarineWM
GarrettCJ
LezotteD
LowensteinSR
2000 Motor vehicle crash fatalities: a comparison of Hispanic and non-Hispanic motorists in Colorado. Ann Emerg Med 36 589 596
35. LaflammeL
EngstromK
2002 Socioeconomic differences in Swedish children and adolescents injured in road traffic incidents: cross sectional study. BMJ 324 396 397
Štítky
Interní lékařstvíČlánek vyšel v časopise
PLOS Medicine
2010 Číslo 3
- Alternativní léčebné možnosti u hypercholesterolemie při intoleranci statinů
- Vliv kombinace nutraceutik na remodelaci levé komory srdeční u osob s metabolickým syndromem
- Nutraceutika a jejich ovlivnění mírného kardiometabolického rizika
- Princip účinku medu v léčbě chronických i infikovaných ran
- Superoxidovaný roztok a jeho využití v léčbě ran
Nejčtenější v tomto čísle
- BMI and Risk of Serious Upper Body Injury Following Motor Vehicle Crashes: Concordance of Real-World and Computer-Simulated Observations
- Unravelling the Genetics of Ischaemic Stroke
- Providing Alcohol-Related Screening and Brief Interventions to Adolescents through Health Care Systems: Obstacles and Solutions
- Human Resource and Funding Constraints for Essential Surgery in District Hospitals in Africa: A Retrospective Cross-Sectional Survey