
Drivers of Inequality in Millennium Development Goal Progress: A Statistical Analysis
Background:
Many low - and middle-income countries are not on track to reach the public health targets set out in the Millennium Development Goals (MDGs). We evaluated whether differential progress towards health MDGs was associated with economic development, public health funding (both overall and as percentage of available domestic funds), or health system infrastructure. We also examined the impact of joint epidemics of HIV/AIDS and noncommunicable diseases (NCDs), which may limit the ability of households to address child mortality and increase risks of infectious diseases.
Methods and Findings:
We calculated each country's distance from its MDG goals for HIV/AIDS, tuberculosis, and infant and child mortality targets for the year 2005 using the United Nations MDG database for 227 countries from 1990 to the present. We studied the association of economic development (gross domestic product [GDP] per capita in purchasing-power-parity), the relative priority placed on health (health spending as a percentage of GDP), real health spending (health system expenditures in purchasing-power-parity), HIV/AIDS burden (prevalence rates among ages 15–49 y), and NCD burden (age-standardised chronic disease mortality rates), with measures of distance from attainment of health MDGs. To avoid spurious correlations that may exist simply because countries with high disease burdens would be expected to have low MDG progress, and to adjust for potential confounding arising from differences in countries' initial disease burdens, we analysed the variations in rates of change in MDG progress versus expected rates for each country. While economic development, health priority, health spending, and health infrastructure did not explain more than one-fifth of the differences in progress to health MDGs among countries, burdens of HIV and NCDs explained more than half of between-country inequalities in child mortality progress (R2-infant mortality = 0.57, R2-under 5 mortality = 0.54). HIV/AIDS and NCD burdens were also the strongest correlates of unequal progress towards tuberculosis goals (R2 = 0.57), with NCDs having an effect independent of HIV/AIDS, consistent with micro-level studies of the influence of tobacco and diabetes on tuberculosis risks. Even after correcting for health system variables, initial child mortality, and tuberculosis diseases, we found that lower burdens of HIV/AIDS and NCDs were associated with much greater progress towards attainment of child mortality and tuberculosis MDGs than were gains in GDP. An estimated 1% lower HIV prevalence or 10% lower mortality rate from NCDs would have a similar impact on progress towards the tuberculosis MDG as an 80% or greater rise in GDP, corresponding to at least a decade of economic growth in low-income countries.
Conclusions:
Unequal progress in health MDGs in low-income countries appears significantly related to burdens of HIV and NCDs in a population, after correcting for potentially confounding socioeconomic, disease burden, political, and health system variables. The common separation between NCDs, child mortality, and infectious syndromes among development programs may obscure interrelationships of illness affecting those living in poor households—whether economic (e.g., as money spent on tobacco is lost from child health expenditures) or biological (e.g., as diabetes or HIV enhance the risk of tuberculosis).
: Please see later in the article for the Editors' Summary
Published in the journal:
. PLoS Med 7(3): e32767. doi:10.1371/journal.pmed.1000241
Category:
Research Article
doi:
https://doi.org/10.1371/journal.pmed.1000241
Summary
Background:
Many low - and middle-income countries are not on track to reach the public health targets set out in the Millennium Development Goals (MDGs). We evaluated whether differential progress towards health MDGs was associated with economic development, public health funding (both overall and as percentage of available domestic funds), or health system infrastructure. We also examined the impact of joint epidemics of HIV/AIDS and noncommunicable diseases (NCDs), which may limit the ability of households to address child mortality and increase risks of infectious diseases.
Methods and Findings:
We calculated each country's distance from its MDG goals for HIV/AIDS, tuberculosis, and infant and child mortality targets for the year 2005 using the United Nations MDG database for 227 countries from 1990 to the present. We studied the association of economic development (gross domestic product [GDP] per capita in purchasing-power-parity), the relative priority placed on health (health spending as a percentage of GDP), real health spending (health system expenditures in purchasing-power-parity), HIV/AIDS burden (prevalence rates among ages 15–49 y), and NCD burden (age-standardised chronic disease mortality rates), with measures of distance from attainment of health MDGs. To avoid spurious correlations that may exist simply because countries with high disease burdens would be expected to have low MDG progress, and to adjust for potential confounding arising from differences in countries' initial disease burdens, we analysed the variations in rates of change in MDG progress versus expected rates for each country. While economic development, health priority, health spending, and health infrastructure did not explain more than one-fifth of the differences in progress to health MDGs among countries, burdens of HIV and NCDs explained more than half of between-country inequalities in child mortality progress (R2-infant mortality = 0.57, R2-under 5 mortality = 0.54). HIV/AIDS and NCD burdens were also the strongest correlates of unequal progress towards tuberculosis goals (R2 = 0.57), with NCDs having an effect independent of HIV/AIDS, consistent with micro-level studies of the influence of tobacco and diabetes on tuberculosis risks. Even after correcting for health system variables, initial child mortality, and tuberculosis diseases, we found that lower burdens of HIV/AIDS and NCDs were associated with much greater progress towards attainment of child mortality and tuberculosis MDGs than were gains in GDP. An estimated 1% lower HIV prevalence or 10% lower mortality rate from NCDs would have a similar impact on progress towards the tuberculosis MDG as an 80% or greater rise in GDP, corresponding to at least a decade of economic growth in low-income countries.
Conclusions:
Unequal progress in health MDGs in low-income countries appears significantly related to burdens of HIV and NCDs in a population, after correcting for potentially confounding socioeconomic, disease burden, political, and health system variables. The common separation between NCDs, child mortality, and infectious syndromes among development programs may obscure interrelationships of illness affecting those living in poor households—whether economic (e.g., as money spent on tobacco is lost from child health expenditures) or biological (e.g., as diabetes or HIV enhance the risk of tuberculosis).
: Please see later in the article for the Editors' Summary
Introduction
Remarkable efforts have been made towards meeting the health MDGs over the past 8 years (Box 1), yet many of the poorest countries are falling behind. As noted in the Report of the Secretariat to the World Health Assembly, “At the mid-point in the countdown to 2015, the target date set by the United Nations Millennium Declaration, there are several examples of success. However, great inequalities still exist within and between countries, and current trends suggest that many low-income countries will not reach the Millennium Development Goal targets” [1].
Box 1. Health Millennium Development Goals, Targets, and Indicators
In 2001, 192 United Nations member states agreed upon three Millennium Development Goals (MDGs) to reduce child mortality rates by two-thirds (MDG #4), maternal mortality ratios by three-quarters (MDG #5), and halt and reverse the spread of HIV, tuberculosis, and malaria by 2015 (MDG #6). Note: Health outcome indicators available for study on a longitudinal basis are italicised.
Goal 4: Reduce child mortality
-
Target 4.A: Reduce by two-thirds, between 1990 and 2015, the under-five mortality rate
-
4.1 Under-five mortality rate
4.2 Infant mortality rate
-
4.3 Proportion of 1 year-old children immunised against measles
-
Goal 5: Improve maternal health
-
Target 5.A: Reduce by three quarters, between 1990 and 2015, the maternal mortality ratio
-
5.1 Maternal mortality ratio
-
5.2 Proportion of births attended by skilled health personnel
-
-
Target 5.B: Achieve, by 2015, universal access to reproductive health
-
5.1 Contraceptive prevalence rate
-
5.2 Adolescent birth rate
-
5.3 Antenatal care coverage (at least one visit and at least four visits)
-
5.4 Unmet need for family planning
-
Goal 6: Combat HIV/AIDS, malaria and other diseases
-
Target 6.A: Have halted by 2015 and begun to reverse the spread of HIV/AIDS
-
6.1 HIV prevalence among population aged 15–24 years
-
6.2 Condom use at last high-risk sex
-
6.3 Proportion of population aged 15–24 years with comprehensive correct knowledge of HIV/AIDS
-
6.4 Ratio of school attendance of orphans to school attendance of non-orphans aged 10–14 years
-
-
Target 6.B: Achieve, by 2010, universal access to treatment for HIV/AIDS for all those who need it
-
6.5 Proportion of population with advanced HIV infection with access to antiretroviral drugs
-
-
Target 6.C: Have halted by 2015 and begun to reverse the incidence of malaria and other major diseases
-
6.6 Incidence and death rates associated with malaria
-
6.7 Proportion of children under 5 sleeping under insecticide-treated bed nets
-
6.8 Proportion of children under 5 with fever who are treated with appropriate anti-malarial drugs
-
6.9 Incidence, prevalence and death rates associated with tuberculosis
-
6.10 Proportion of tuberculosis cases detected and cured under directly observed treatment short course
-
What explains these inequalities in progress toward the health MDGs [2]? Slow progress in low-income countries cannot simply be explained by their public health MDG targets being more challenging. Reducing child mortality by two-thirds (MDG 4.1) or maternal mortality by three-quarters (MDG 5.1) may be more difficult when death rates are already low, as in rich countries. One possibility is that countries simply lack the financial resources needed to combat epidemics (i.e., low gross domestic product [GDP] per capita). Even when funds are available, they may be allocated to other forms of social spending, military expenditure, or reserves, rather than to health (i.e., low health spending for each dollar of GDP). A third possibility is that when funds enter the health system, inadequate health infrastructure—such as a lack of doctors, pharmaceuticals, or hospitals—prevent these allocations from reaching those who need them most (i.e., low absorptive capacity for spending).
However, another contributing factor could be coexisting epidemics. For example, the spread of HIV has slowed progress towards achievement of the tuberculosis goals by directly increasing the risk of active tuberculosis disease and subsequent death [3]. There are also multiple pathways by which higher adult HIV prevalence might increase child mortality (beyond the obvious mother to child transmission), estimated to account for a significant fraction of deaths in sub-Saharan Africa [4]. These include direct effects on the welfare of children (reduced earning capacity of parents, cost of treatment, impoverishment of orphans) and indirect mechanisms involving depletion of resources (illness and death of health workers and teachers, diversion of resources from child health care) [5]–[7].
In recent years, attention has turned to the contributions made by long-term noncommunicable conditions to the overall burden of disease in poor countries [8]. These include cardiovascular disorders, chronic obstructive pulmonary disease, diabetes, and common cancers as well as disabling mental illness and injuries. It is increasingly clear that the greatest burden of NCDs is among the poor [9]–[13]. Their plight is not simply an inevitable consequence of aging, as is sometimes argued [14]. Instead, traditional diets are giving way to cheaper, unhealthy alternatives (the so-called “nutrition transition”) [15], transnational tobacco companies aggressively market their products in the developing world, and urbanization and associated changes in employment have reduced physical activity [16]–[18]. Crucially, in the present context, the nature of the transition means that many families face a double burden of what are sometimes referred to as diseases of affluence and poverty [19]. For example, 44% of families with an undernourished member in Brazil also had an overweight member, with high prevalence also observed in China (23%) and Russia (58%) [20]. A survey of very-low-income populations in Maceio, Brazil found that 30% of all families had both an underweight and overweight–obese member living under the same roof [21].
As with HIV/AIDS, NCDs and their risk factors can impact adversely on attainment of the health MDGs (Table 1). In some cases this is due to the biological consequences of NCDs and their risk factors. For example, in the case of tuberculosis, WHO notes that “Risk factors that seem to be of importance at the population level include poor living and working conditions associated with high risk of TB transmission, and factors that impair the host's defence against TB infection and disease, such as HIV infection, malnutrition, smoking, diabetes, alcohol abuse, and indoor air pollution.” (emphases added) [22]. Although the increased relative risk of tuberculosis associated with smoking and diabetes is less than for HIV infection, in some populations the higher prevalence of these factors leads to a greater population attributable risk. A recent study by Dye and colleagues in India estimated that diabetes accounts for 20% of smear-positive tuberculosis incidence, with the higher prevalence of diabetes in urban areas explaining one-fifth of the gap in smear-positive disease between urban and rural areas [23]; other studies in Latin America have attributed as much as one-quarter of pulmonary tuberculosis incidence to diabetes and, in India, over half of tuberculosis mortality to tobacco [11],[24],[25]. Among children, exposure to second-hand tobacco smoke and smoke-producing stoves increases risks of respiratory infections (one of the leading causes of death in the very poorest children) and sudden infant death.

However, expenditures on the risk factors for NCDs and the management of these disorders can also impact adversely on the financial well-being of families, placing them at risk in relation to the conditions included in the health MDGs. Thus, tobacco expenditures in Bangladesh have exceeded spending on health, education, and clothing by a factor of five [26]; this spending was found to have been displaced from nutrition and health care, where it would have added as much as 500 calories per day to the diets of otherwise potentially undernourished children [27]. Treatment for diabetes costs 15%–25% of incomes in households with an affected person in India [28], 25% of the minimum wage (20 times the per capita health expenditure) in Tanzania [29], 6–12 months' wages (US$160 per year) in Bangladesh [30], and roughly US$550 per person in Latin America (more than average per capita health expenditure) [31], while health care for smoking-related diseases accounts for 0.48% of GDP in Thailand [32]. Research from countries as diverse as Burkina Faso [33] and Thailand [34] find that the presence of a chronic illness in a family is one of the most important determinants of whether the household will incur catastrophic health expenditure.
New insights on the importance of NCDs are being obtained from longitudinal studies that track health expenditure in families, rather than previous facility-based studies of utilization. Thus, in South Africa a household survey found that 74% of reported health problems were “chronic,” 48% of which had received no treatment in the previous month. In a linked follow-up of households, among subjects with chronic illness, only 62% had an allopathic diagnosis and only 35% were receiving regular treatment [35]. A study in India found that chronic diseases represented 17.7% of illnesses but 32% of costs. Although hospitalizations were the single most costly component on average, they accounted for only 11% of total costs, compared to drugs, accounting for 49% of total costs [36].
Finally, the onset of an NCD also appears to restrict earning potential [37]–[41] and undermine a family's ability to provide for children. High background rates of chronic NCD morbidity and mortality among adults results in losses of adult care providers, and disability among adults prevents efforts to secure child health, or to obtain diagnoses and complete treatment for infectious diseases.
Table 1 further summarises the evidence of how high burdens of NCDs impede progress to health MDGs.
In this paper, we compare several of the leading explanations of slow progress towards health MDGs, including the effects of low economic development, a lack of health prioritisation by governments, low absolute health spending, and scarce health infrastructure. While some recent studies identify barriers to achieving progress towards MDGs in individual countries or regions (especially sub-Saharan Africa) or for individual diseases [42],[43], there remains a need to test the relationships across health MDGs and low-, middle-, and high-income countries. For what we believe is the first time, we also test the hypothesis that coexisting epidemics of HIV/AIDS and NCDs impede progress towards the health MDGs, after controlling for the potential economic and health system barriers to achieving the health MDGs.
Data and Methods
We extracted data on MDG indicators from the United Nations Millennium Development Goal Indicator Database 2009 edition for 227 countries spanning 1990 to 2008 [44]. Complete time series data related to some health MDGs in low income countries were missing from the UN repository (Text S1). This was a particular problem with maternal mortality and malaria. Much of the information on maternal mortality in low-income countries derives from the sisterhood method, which is designed to yield a lifetime risk [45] and, while data on the prevalence of malaria are now much more widely available, historical data are very limited [46]. Hence we limited the analysis to the indicators available for evaluating rates of progress toward the MDG target, which corresponded to child health, tuberculosis, and HIV. Fortunately, these are also the health MDGs where we hypothesise that an association with NCD burden might be expected. In Box 1, we highlight the MDG indicators used in the assessment.
We calculated the change in the appropriate variable that would be required by 2005 to place each country on target to achieve each MDG. For example, MDG 4, which aims “to reduce infant and child mortality by two-thirds by 2015,” would require a 40% reduction in infant and child mortality rates by 2005 assuming a uniform (linear) rate of progress. We note that this linear transformation of the outcome variable is statistically equivalent to an alternative approach of first modelling the real values, then offsetting by the baseline mortality data; however, to ensure consistency with our hypothesis, we present the transformed results. The health MDG targets are set out at http://www.un.org/millenniumgoals/.
To measure “unmet MDG progress,” we then divided the actual change in the variable achieved by 2005 by the target for that year: (1)
Using the above example, the resulting value would be 25% for a country achieving a 30% reduction in infant and child mortality rates (100×[(1−(30/40)]) or, put more simply, would be 25% adrift from where it should be by 2005. Countries which exceeded the MDG target were coded as negative unmet progress (although the results were unchanged when the score was truncated at zero unmet progress). For countries which moved in reverse, or experienced rises in mortality rates (e.g. a total of 13 countries for infant mortality), it was possible to have greater than 100% unmet MDG progress.
Data on MDG 5, “to reduce maternal mortality by two-thirds,” were available only on a comparative basis for 2005. MDG 6, “to halt and reverse the incidence, prevalence and mortality of HIV, malaria and other diseases [including tuberculosis],” was coded as a dichotomous variable. Countries which experienced rises in tuberculosis mortality and HIV prevalence rates were assigned the value 1, denoting unmet progress, whereas those which had no change or reduction were assigned 0. This enabled comparisons of progress in both MDG 4 and 6 based on the probability of (or the percentage of) MDG success.
We used the World Bank's methods [47] to designate countries as low-, middle-, and high-income, based not on their yearly GDP per capita but on their average GDP per capita from 1990 to 2005. This avoids classifying countries with successful growth strategies as higher-income, or poor economic performers as lower-income, which could potentially bias a statistical analysis of mortality changes among them.
To study the determinants of progress to the MDGs, we modelled the MDG indicators as:(2)
where i is country. GDP is GDP per capita in purchasing-power-parity from the Penn World Tables version 6.2 for the year 2003 (because there were data for 92 additional countries in this version of the tables than in more recent editions); HGDP is health spending as a percentage of GDP from the WHO Statistical Information Database for the year 2005; HS is health spending per capita in purchasing-power-parity and PHY is the number of physicians per 10,000 population, both from the WHO Statistical Information Database for the year 2005 [48]; HIV is HIV prevalence among ages 15–49 y, the HIV indicator available from the UN MDG database for the years 2006/2007; and NCD is the WHO Global Burden of Disease estimates of NCD mortality rates for the year 2004 (the most recent year available from WHO [49]; this includes WHO classification scheme Group 2 causes, age-standardised to the WHO World Standard Population to adjust for potential errors arising from differences in the population age-structure [50], given that NCDs contribute a greater share of deaths at older ages) [48]. Log transformations were applied to GDP and NCD data to adjust for positive skew and aid model fitting. Note that we analysed the variance in the rates of change in MDG progress relative to baseline rates of change, correcting for spurious correlations that may exist simply because countries with high disease burdens would be expected to have low MDG progress. We specifically controlled for the initial burden of disease estimates and rates of change in those estimates among countries when performing our regressions by incorporating expected mortality rates in the calculation of unmet MDG progress. Huber/White sandwich estimators of standard errors are presented for consistency in the presence of potential heteroskedasticity. To facilitate the interpretation of the models, we have transformed estimated coefficients into elasticities and interpreted the effect sizes based on units to improve clarity and comparability. Data were analysed using STATA 10.1. All data are available upon request from the authors.
Results
Inequalities in Progress to Health MDGs
Figure 1 compares progress toward health MDGs among low-, middle-, and high-income countries and by World Bank region. Out of 71 low-income countries for which data are available, rising death rates have been recorded in 37 countries for tuberculosis since 1990 (MDG 6.9); in seven and nine countries for infant and child mortality rates, respectively, since 1990 (MDG 4.1 and 4.2); and in 17 countries for HIV prevalence (MDG 6.1) from 2001 to 2007 (the period for which data are available). Compared to high - and middle-income countries, low-income countries are about one-quarter less likely to be on pace to reach the HIV and TB targets set out in MDG 6 (23.7%, 95% CI 7.8%–39.4%) and the child mortality targets in MDG 4 (27.6%, 95% CI 10.5%–44.7%).

As shown in Figure 2, sub-Saharan Africa had the slowest progress (82.1% unmet progress in child mortality, 79.5% in tuberculosis mortality, and 31.7% in HIV prevalence), followed by Europe and Central Asia (2.4% unmet progress in child mortality, 76.2% in tuberculosis mortality, and 40.0% in HIV prevalence).

At current rates of progress, fewer than half of low-income countries will achieve the 2015 targets set for HIV prevalence or infant, child, and tuberculosis mortality rates. Inequalities between the global north and south have been rising, as progress towards MDGs has not only been much slower in the south, but has moved into reverse for a substantial number of the lowest-income countries, as indicated by the >100% unmet progress (Text S2).
Economic Development, Health Systems, and Health MDGs
We now examine each of the possible explanations for inequalities in progress towards the MDGs postulated earlier.
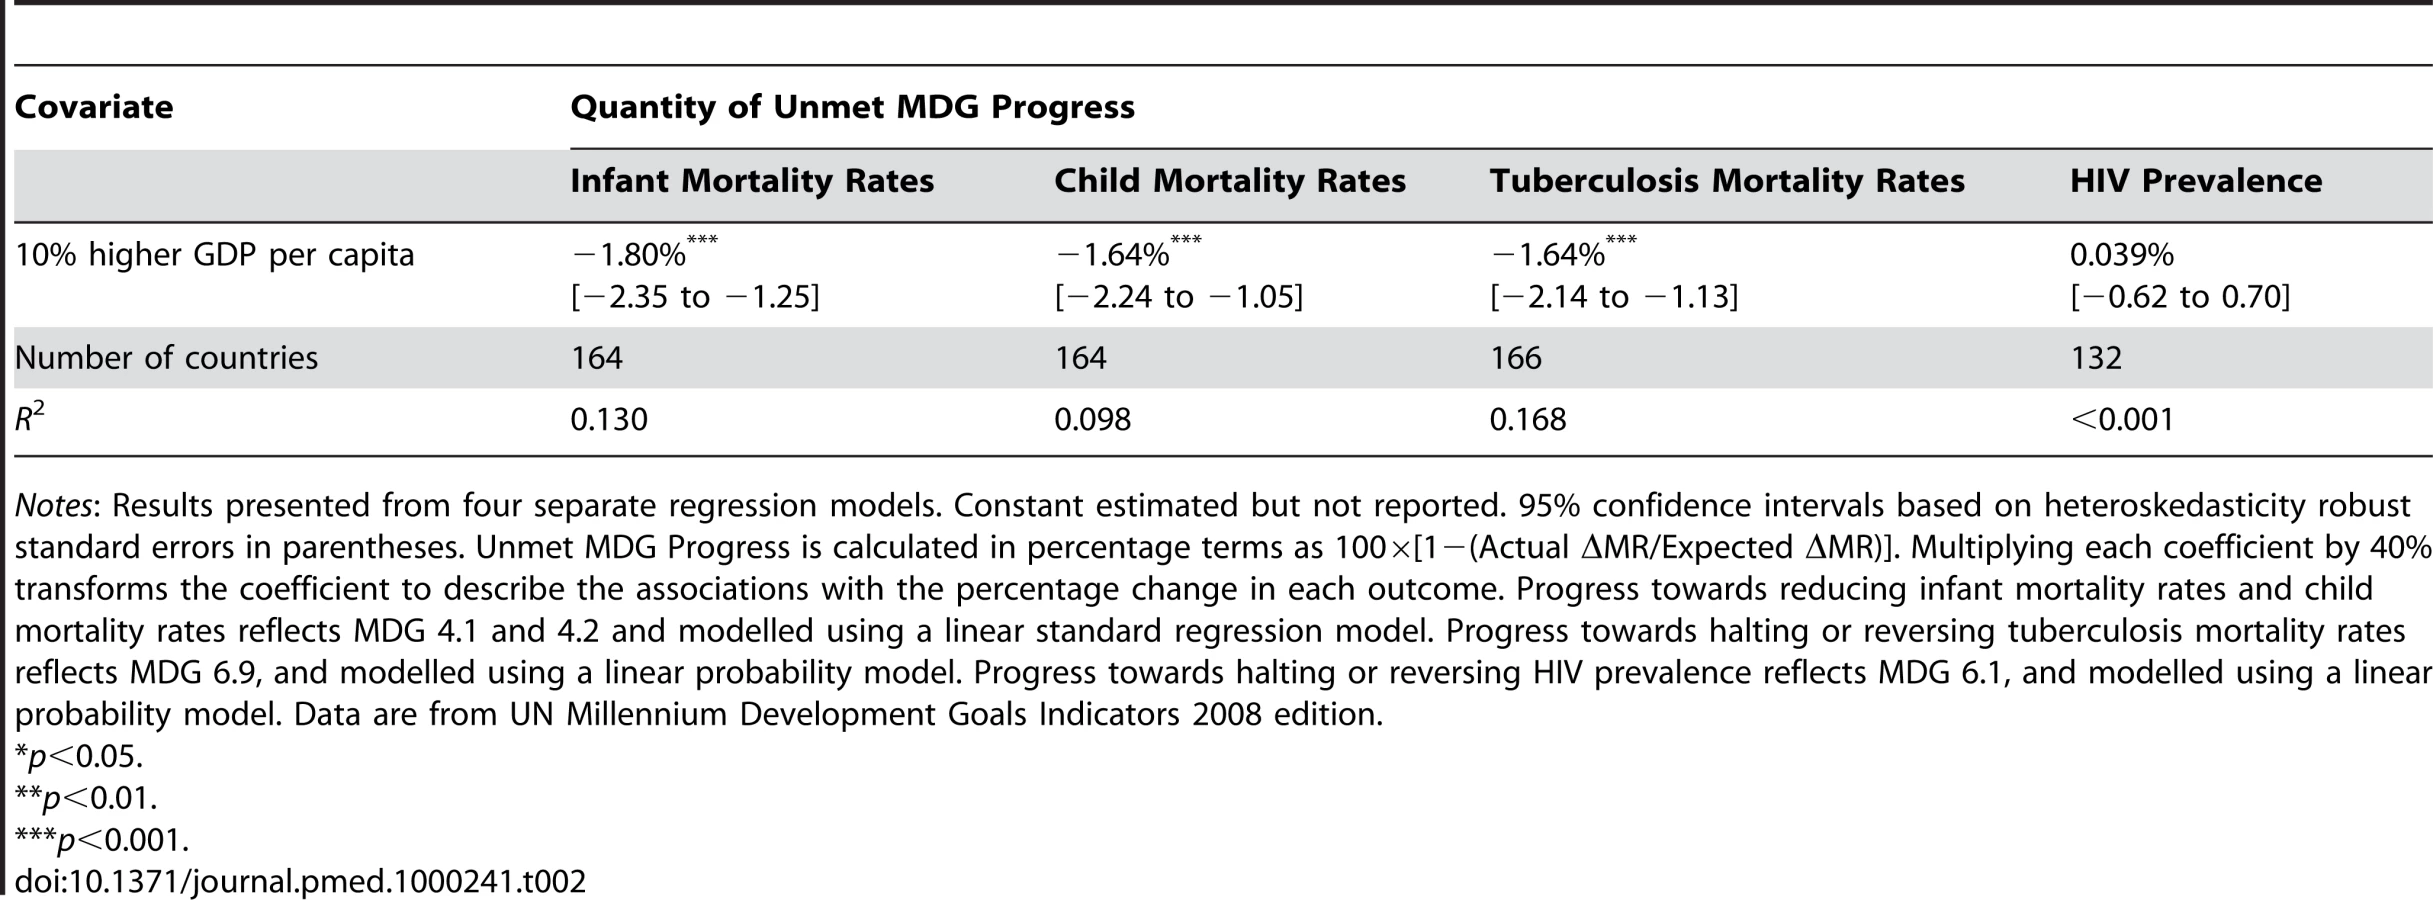
The first possibility is that poor countries simply lack the financial resources to tackle their public health goals. Table 2 shows the results of a statistical model relating the level of earnings (GDP per capita in purchasing-power-parity) to unmet MDG progress. The model reveals that scaling up current forms of economic development is not sufficient for success [11]. Each 10% higher GDP per capita was associated with 1.80% greater progress towards the infant mortality targets (95% CI 1.25%–2.35%), 1.64% greater progress towards the under-5 mortality target (95% CI 1.05%–2.24%), and 1.64% greater progress toward the tuberculosis mortality targets (95% CI 1.13%–2.14%). However, less than one-sixth of unmet progress in combating infant, child, and tuberculosis mortality, and almost none of progress in combating HIV, could be attributed to differences in economic development in this regression analysis (see also Text S2 for representative values).
Another possibility is that overall financial resources are theoretically sufficient but not being used to strengthen health systems. We next included health spending as a percentage of GDP as a measure of governmental priority given to health. While each 1% higher health spending as a percentage of GDP was associated with faster progress to the MDGs, the effects were not statistically significant except for declines in HIV prevalence (each percentage increase in spending/GDP changes HIV prevalence by −4.50% (95% CI−8.39% to−0.61%) (Table 3).

But perhaps financial resources or the proportion of these resources apportioned to health are not as relevant as the absolute number of dollars devoted to health per capita or the physical capacity in the health care system. Hence, we next evaluated the effects of real health spending and physicians per capita on health MDG progress. We found no effect of greater health spending (Table 4), but when we added physicians per capita to the model (Table 5) we found that each 1 additional doctor per 10,000 population was strongly associated with greater progress towards reducing progress toward infant mortality targets (1.43%, 95% CI 0.38%–2.49%) and under-5 mortality rates (1.44%, 0.31%–2.57%). After including physicians per capita in the model, GDP per capita also no longer had a significant association with progress on child mortality (p = 0.3721), which is consistent with a potential pathway linking GDP to greater human capital and subsequent greater progress towards the MDGs. However, we found that greater numbers of physicians per capita was associated with slower progress in tuberculosis mortality rates (−0.98%, 95% CI−0.24% to −1.73%), which could indicate bias due to better surveillance or, possibly, the contribution of poorly regulated health care provision to the emergence of drug resistance [51],[52]. The full model—including real GDP per capita, health as a percentage of GDP, real health spending per capita, and physicians per capita—explained roughly one-fifth of country inequalities, which leaves a sizable residual to be accounted for.


Associations of HIV and NCDs with Child Mortality Progress (MDG 4)
We next evaluated whether coexisting epidemics, specifically high burdens of HIV/AIDS or NCDs accompanying high burdens of child disease and tuberculosis, could be contributing to the MDG inequalities observed. Coexisting epidemics can create a “health trap.” That is, failure to control one disease impedes progress on the other and (possibly) vice-versa; this could occur both because of biological risks from comorbidities, and because additional household spending or loss of income resulting from one disease can deplete resources needed to combat threats to child health (e.g., ability to pay for medical care for sick children) [53] or comorbid infectious diseases (e.g., paying for transportation to refill antituberculosis medication) [54].
First, we evaluated the relationship between tuberculosis and child health MDGs and HIV prevalence among ages 15–49 y. Table 6 shows that a high background rate of HIV prevalence explains a much higher share of the inequalities between countries in health MDG progress than the other economic and health system variables. Each 1% higher HIV prevalence rate was associated with 8.46% lower progress in infant mortality (95% CI 5.57%–11.41%) and 9.25% lower progress in under-5 mortality (95% CI, 5.97%–12.5%). After adjusting for HIV prevalence, more physicians per capita had no effect on progress towards child mortality goals.

In Table 7 we included the age-standardised mortality rates from NCDs. Over and above the previous correlates of health MDG progress, we found each 10% greater NCD burden, which corresponded roughly to one standard deviation in the global country sample and has been proposed as a feasible target by WHO [55], was associated with a 6.32% reduction in progress toward infant mortality targets (95% CI 2.03%–10.6%) and a 5.78% reduction in progress toward under-5 mortality targets (95% CI 1.03%–10.5%). Our full model (Equation 2, above) depicted in Table 7 explained 56% of variation in country progress in infant mortality and 53% of variation in under-5 mortality.

To put these associations into perspective, we found that the association between a 1% lower HIV prevalence or 10% lower NCD mortality and progress towards child mortality MDGs was of magnitude similar to a 40% rise in GDP (corresponding to at least 5 years of economic growth in low-income countries) (see Text S9 for further decomposition analysis).
Associations of HIV and NCDs with Infectious Disease Progress (MDG #6)
Tables 6 and 7 also present the associations of HIV and NCD burdens with progress on tuberculosis and HIV MDGs. Each 1% higher HIV prevalence was associated with a 5.35% lower rate of progress on tuberculosis mortality (95% CI −6.62% to −4.08%). Each 10% higher NCD mortality was associated with a 7.56% reduction in progress toward tuberculosis mortality targets (95% CI −4.73% to 10.4%). These estimates were similar in magnitude to estimates of the population-attributable tuberculosis risk from tobacco and diabetes by Dye and colleagues at WHO [7]. We found no effect of NCDs on HIV prevalence, which would be expected because the chronic NCDs increase risks of death for persons living with HIV and, as a result, would exert a downward effect on prevalence. Including chronic NCDs also improved the fit of the models, such that our full model explained 57% of variation in tuberculosis mortality among countries. Consistent with the expectation that NCDs would not further explain HIV inequalities, the model (including rates of NCDs, baseline HIV prevalence, measures of economic development, health prioritisation, health spending, and health infrastructure) was only able to account for 5% of variations in HIV prevalence.
The association of a 1% lower HIV prevalence or 10% lower NCD burden with progress towards the tuberculosis MDG was of a similar magnitude as a 80% rise in GDP.
Robustness Checks
We performed a series of robustness checks on both our data and model specification, as set out in Text S2–S9. This included measures of the initial disease burden, urbanization rates, and hospital beds per capita, as well as using different transformations of the predictor variables and differing samples (low HIV-prevalence according to the WHO StopTB cutpoints and low MDG progress countries), finding that the results were consistent among the various models (Text S3). We also compared the association among low-, middle-, and high-income countries; the associations between NCDs and MDG progress were consistent at all levels of income, but greatest in low-income countries where the burden of NCDs is largest (Text S4). We had some inevitable concerns about the quality of the data on adult mortality from NCDs. Although the Global Burden of Disease study (http://www.who.int/topics/global_burden_of_disease/en/), from which these data were obtained, was an enormous advance over previously available data sources, many of the data from poor countries are based on estimates derived from models that, in some cases, include child mortality derived from surveys. It is possible that this could introduce an element of circularity. We examined this possibility first by including a control for the different ways of estimating data on NCD mortality [56],[57] as well as by excluding the 42 countries in our sample that derived adult mortality from child mortality. Neither approach changed our results qualitatively or statistically (tests for effect homogeneity: χ2(1) = 3.60, p = 0.0551 and χ2(1) = 1.82, p = 0.1767 respectively) (Text S7). We also performed a series of diagnostic tests on our residuals, finding no evidence of leverage points (Cook's distance <4 in all cases) or influence points (based on leverage versus normalized squared residual plots). After removing potential outliers based on residuals greater than two standard deviations, none of our results changed (Text S5). Thus, our results were not an artefact of a few extremely poorly performing outlier countries. We also evaluated potential multicollinearity using variance inflation factors, finding that our results were within accepted statistical limits (Text S5).
Discussion
Our results indicate that progress in achieving the health MDGs for infant and child mortality and tuberculosis is associated significantly with the burden of adult NCDs and HIV prevalence among adults aged 15–49. The evidence emerging from these models is consistent with a growing body of research finding that high burdens of NCDs contribute to worse child health and poorer tuberculosis outcomes, both as a result of biological risks from comorbidities and as a consequence of reduced household resources (in both human and financial terms) when faced with multiple comorbidities (Table 1). An abundance of evidence indicates that poor households face the greatest burdens of both HIV and NCDs (though the diagnostic infrastructure for the latter is focused on higher income groups), and are also the households most affected by child mortality and tuberculosis.
We estimated that a 1% lower HIV prevalence or 10% lower NCD risks would have an association with progress to child health MDGs similar to a 40% or greater rise in GDP, while it would equate to an 80% or greater rise in GDP for tuberculosis (corresponding to about a decade of economic growth in low-income countries). We found weaker evidence that health spending or health infrastructure, as measured by physicians per capita, was a major correlate of inequalities in progress by countries towards these MDGs. While our models explained over half of the observed inequalities among countries in progress towards child health and tuberculosis goals, a large residual in our measure of HIV/AIDS progress remained to be accounted for even after evaluating economic development, health priority, health spending, and health infrastructure as potential explanations of country inequalities.
Although researchers have sought to identify barriers to achieving progress towards MDGs in individual countries or regions (especially sub-Saharan Africa) [42],[43], this study is, to our knowledge, the first attempt to analyse and compare the determinants of global inequalities in progress to the health MDGs. Inevitably, this initial analysis has several important limitations which are relevant both to future research and to the updates to the MDG process scheduled for 2010.
First, a comparative analysis of progress towards achievement of health MDGs risks generating ecologic fallacies where the unit of analysis is the country. However, our findings are consistent with a large body of micro-level evidence indicating the importance of NCDs among adults for the health of their dependent children and for the control of infectious diseases (Table 1), as well as the role of HIV in both child health and infectious disease MDGs.
Second, we cannot be certain that the associations we have observed between HIV prevalence, NCDs, and progress towards health MDGs are causal. One limitation is that we use cross-sectional data to infer longitudinal relationships, making it possible to observe a correlation cross-sectionally across countries which does not occur longitudinally within individual country time series. However, we have taken advantage of longitudinal data to evaluate the rate of progress, or change, in MDG indicators. We also need to consider two other possibilities: that either (i) poor performance on health MDGs contributes to growing levels of NCDs; or (ii) a third underlying factor is implicated in both poor chronic disease outcomes and slow progress on health MDGs. Beginning with the first mechanism, although there is now extensive evidence from the field of life course epidemiology linking adverse conditions in childhood to several NCDs in adulthood, the effects are, by their nature, seen only after a lag of several decades. Also, while some NCDs have established infectious aetiologies, such as cervical cancer and peptic ulcers, and inflammation related to infections may play a role in ischaemic heart disease [58],[59] and diabetes [60], these infectious agents make a relatively small contribution to the total burden of NCDs, compared to the major risk factors of poor diet, low physical activity, smoking, and alcohol. Hence, the first mechanism seems implausible. It is impossible to exclude the second in a cross-sectional analysis but we tested the most plausible such factors (poverty, health system financing, and health care infrastructure) and found a significant relationship between HIV/AIDS, chronic diseases, and health MDGs independently of these.
Third, country-wide indicators potentially mask within-country inequalities [61]. In the future it will be important for the UN to obtain data that can be disaggregated into different groups within populations, as the determinants of inequalities in MDG progress within-country may differ from the drivers of between-country inequalities that our study has investigated.
Finally, the data available to assess MDG progress from existing sources are limited. Although the UN database is the most comprehensive source, many important health system performance indicators are missing on a comparative longitudinal basis. Time series data relating to many health MDGs in low-income countries are presently incomplete, in particular maternal mortality ratios and HIV prevalence. This limited the number of health indicators we were able to study. Of the data which do exist from poor countries, such as infant and under-5 mortality rates, most are based on demographic projections from sentinel sites or small surveys. Scaling up surveillance will be critical for a better understanding of each country's performance. If the quality of these data is subject to error, we would expect regression to the mean to reduce the likelihood of finding such robust and strongly significant findings through so many tests and alternative model specifications. Yet the findings remained robust. Also, in spite of the important limitations of the existing data, we note that the indicators evaluated in this analysis are the same data followed by the UN. The ability to conduct an exercise such as this one—to evaluate why some countries have been more successful than others on the same targets—is a key benefit of the MDG process. Similarly, caution is needed in using the data on NCDs from the Global Burden of Disease study, although as we showed, our findings are robust to exclusion of those countries where there may be a degree of circularity because the estimates incorporate data on childhood mortality.
These findings have implications for global health policy. The dichotomy between adult noncommunicable mortality and the measures included in the MDGs (communicable diseases and child mortality) may obscure the interrelationships of illnesses affecting those living in poor households. Programs designed to achieve the existing health MDGs should take account of the relationships among all those diseases that can trap households in vicious cycles of mortality and poverty. Global health initiatives are now placing a much greater emphasis on health systems strengthening. However, in many cases, these are seen as a means to achieving their specific goals, such as improving uptake of immunization [62] or delivering antiretrovirals [63]. Our analysis, indicating correlations among diseases and their risks, suggests that their activities should be broadened to address the burden of other disorders that may also, albeit less directly, impact on their ability to achieve their goals.
Our findings also have implications for future research. There is a need to investigate why and how the burden of HIV and chronic NCDs may affect progress on child health and tuberculosis MDGs. Further expanding data availability is crucially needed to allow for more robust time series and panel data analysis in the future, so that longitudinal relationships among joint epidemics can be tracked with greater confidence.
Our findings suggest that achievement of feasible reductions in the impact of these chronic diseases on poor households could greatly enhance progress towards existing health MDGs. If not adequately addressed, high rates of NCDs in low-income countries may further impede progress towards the health MDGs.
Supporting Information
Zdroje
1. WHO 2008 Monitoring achievement of the health-related Millennium Development Goals; WHO, editor. Geneva. Available: http://www.who.int/gb/ebwha/pdf_files/A61/A61_15-en.pdf. Accessed: 15 March 2009
2. Gil-GonzalezD
Ruiz-CanteroMT
Alvarez-DardetC
2009 How political epidemiology research can address why the millennium development goals have not been achieved: developing a research agenda. J Epidemiol Community Health 63 278 280
3. AtunR
LebcirRM
McKeeM
HabichtJ
CokerRJ
2007 Impact of joined-up HIV harm reduction and multidrug resistant tuberculosis control programmes in Estonia: System dynamics simulation model. Health Policy 81 207 217
4. UNAIDS 2007 World Health Organization. AIDS epidemic update. Geneva: UNAIDS. Available: http://data.unaids.org/pub/EPISlides/2007/2007_epiupdate_en.pdf
5. AlbanA
AndersenNB
2007 HIV/AIDS' spread and impact on other health-related millennium development goals–secondary publication. Dan Med Bull 54 163 166
6. CorbettE
WattCJ
WalkerN
MaherD
2003 The growing burden of tuberculosis: global trends and interactions with the HIV epidemic. Arch Intern Med 163 1009 1021
7. DyeC
WattCJ
BleedDM
HosseiniSM
RaviglioneMC
2005 Evolution of tuberculosis control and prospecdts for reducing tuberculosis incidence, prevalence and deaths globally. JAMA 293 2767 2775
8. DaarA
SingerPA
PersadDL
PrammingSK
MatthewsDR
2007 Grand challenges in chronic non-communicable diseases. Nature 450 494 496
9. RileyL
KoAI
UngerA
ReisMG
2007 Slum health: diseases of neglected populations. BMC Int Health Hum Rights 7
10. World Bank 1999 Global Trends in Tobacco Use. Curbing the epidemic: Governments and the Economics of Tobacco Control Washington (D.C.) World Bank
11. JhaP
JacobB
GajalakshmiV
GuptaPC
DhingraN
2008 A nationally representative case-control study of smoking and death in India. N Engl J Med 358 1137 1147
12. MajraJ
GurA
2009 Poverty, tobacco, and health: an Indian scenario. J Health Popul Nutr 27 316 318
13. SuhrckeM
NugentR
StucklerD
2006 Chronic disease: An economic perspective. London Oxford Health Alliance
14. StucklerD
2008 Population causes and consequences of leading chronic diseases: A comparative analysis of prevailing explanations. Milbank Q 86 273 326
15. PopkinB
2002 What is unique about the experience in lower - and middle-income less-industrialised countries comparied with the very-high income countries?The shift in the stages of the nutrition transition differs from past experiences! Public Health Nutr 5 205 214
16. YachD
StucklerD
BrownellK
2006 Epidemiologic and economic consequences of the global epidemics of obesity and diabetes. Nat Med 12 62 66
17. HawkesC
2006 Uneven dietary development: linking the policies and processes of globalisation with the nutrition transition, obesity and diet-related chronic diseases. Global Health 2
18. RaynerG
HawkesC
LangT
BelloW
2005 Trade liberalisation and the diet and nutrition transition: a public health response. Department of Health Management & Food Policy, CITY University, London.
19. PopkinB
RichardsMK
MontieroCA
1996 Stunting is associated with overweight in children of four nations that are undergoing nutrition transition. Am J Nutr 126 3009 3016
20. DoakC
AdairLS
MonteiroC
PopkinBM
2000 Overweight and underweight coexist within households in Brazil, China and Russia. J Nutr 130
21. FlorencioT
FerreiraH
de FrancaAP
CavalcanteJC
SawyaAL
2001 Obesity and undernutrition in a very-low-income population in the city of Maceio, northeastern Brazil. Br J Nutr 86
22. LonnrothK
JaramilloE
WilliamsBG
DyeC
RaviglioneM
2009 Drivers of tuberculosis epidemics: the role of risk factors and social determinants. Soc Sci Med 68 2240 2246
23. StevensonC
ForouhiNF
RoglicG
WilliamsBG
LauerJA
2007 Diabetes and tuberculosis: The impact of the diabetes epidemic on tuberculosis incidence. BMC Public Health 7 234
24. Ponce-De-LeonA
Garcia-Garcia Md MdeL
Garcia-SanchoMC
Gomez-PerezFJ
Valdespino-GomezJL
2004 Tuberculosis and diabetes in southern Mexico. Diabetes Care 27 1047 1053
25. GajalakshmiV
PetoR
KanakaT
JhaP
2003 Smoking and mortality from tuberculosis and other diseases in India: retrospective study of 43000 adult male deaths and 35000 controls. Lancet 16 507 515
26. EfroymsonD
AhmedS
TownsendJ
AlamSM
DeyAR
2001 Hungry for tobacco: an analysis of the economic impact of tobacco consumption on the poor in Bangladesh. Tob Control 10 212 217
27. NonnemakerJ
SurM
2007 Tobacco expenditures and child health and nutritional outcomes in rural Bangladesh. Soc Sci Med 65 2517 2526
28. ShobhanaR
RaoPR
LavanyaA
WilliamsR
VijayV
2000 Expenditure on healthcare incurred by diabetic subjects in a developing country - a study from Southern India. Diabetes Res Clin Pract 48 37 42
29. NeuhannH
Warter-NeuhannC
LyaruuI
MsuyaL
2002 Diabetes care in Kilimajaro region: clinical presentation and problems of patients of the diabetes clinic at the regional referral hospital - an inventory before structured intervention. Diabetes Med 19 509 513
30. KibriyaM
AliL
BanikNG
Azad KhanAK
1999 Home monitoring of blood glucose (HMBG) in Type 2 diabetes mellitus in a developing country. Diabetes Res Clin Pract 46 253 257
31. BarceloA
AedoC
RajpathakS
RoblesS
2003 The cost of diabetes in Latin America and the Caribbean. Bull WHO 81 19 27
32. LeartsakulpanitchJ
NganthaveeW
SaloleE
2007 The economic burden of smoking-related disease in Thailand: a prevalence-based analysis. J Med Assoc Thai 90 1925 1929
33. SuT
KouyateB
FlessaS
2006 Catastrophic household expenditure for health care in a low-income society: a study from Nouna District, Burkina Faso. Bull WHO 84 21 27
34. SomkotraT
LagradaLP
2009 Which households are at risk of catastrophic health spending: experience in Thailand after universal coverage. Health Affairs 28 w467 468
35. GoudgeJ
GilsonL
RussellS
GumedeT
MillsA
2009 Affordability, availability and acceptability barriers to healthcare for the chronically ill: Longitudinal case studies from South Africa. BMC Health Serv Res 9 75
36. DrorD
van Putten-RademakerO
KorenR
2008 Cost of illness: evidence from a study in five resource-poor locations in India. Indian J Med Res 127 347 361
37. CawleyJ
2000 Body weight and women's labor market outcomes. NBER Working Paper No 7841. Cambridge (Massachusetts)
38. CawleyJ
2004 The impact of obesity on wages. Journal of Human Resources 32 451 474
39. CawleyJ
DanzigerS
2004 Obesity as a barrier to the transition from welfare to work. NBER Working Paper No 10508
40. DwyerD
MitchellOS
1999 Health problems as determinants of retirement: are self-rated measures endogenous. J Health Econ 18
41. FinkelsteinE
RuhmCJ
KosaKM
2005 Economic causes and consequences of obesity. Annu Rev Public Health 26 239 257
42. McGillavrayM
2008 Achieving the Millennium Development Goals. London Palgrave
43. SsewanyanaS
YoungerSD
2008 Infant mortality in Uganda: Determinants, trends and the Millennium Development Goals. J African Econ 17 34 61
44. United Nations 2008 Millennium Development Goal Indicator Database. UN.
45. GrahamW
BrassW
SnowRW
1989 Estimating maternal mortality: the sisterhood method. Stud Fam Plann 20 125 135
46. UNICEF 1999 Roll back malaria, The Global Fund. Malaria & children: Progress in intervention coverage. New York UNICEF
47. World Bank 1993 Investing in Health. Washington D.C. World Bank
48. World Health Organization 2009 Statistical Information System (WHOSIS). World Health Organization Geneva Available: http://www.who.int/whosis/whostat/EN_WHS09_Tables.xls
49. World Health Organization 2009 Mortality and burden of disease estimates for WHO Member States in 2004. Geneva World Health Organization Available: http://www.who.int/healthinfo/global_burden_disease/2004_report_update/en/index.html; http://www.who.int/whosis/whostat/EN_WHS09_Table2.pdf. Accessed 15 March 2009
50. AhmadO
Boschi-PintoC
LopezAD
MurrayCJL
LozanoR
2001 Age standardization of rates: a new WHO standard. Geneva: World Health Organisation. Available: http://www.who.int/healthinfo/paper31.pdf. Accessed 19 December 2009
51. GlynnJ
WarndorffDK
FinePE
MunthaliMM
SichoneW
PonnighausJM
1998 Measurement and determinants of tuberculosis outcome in Karonga District, Malawi. Bull WHO 76 295 305
52. KorenrompE
BierrenbachAL
WilliamsBG
DyeC
2009 The measurement and estimation of tuberculosis mortality. Int J Tuberc Lung Dis 13 283 303
53. FosterG
Williamson
2000 A review of current literature on the impact of HIV/AIDS on children in sub-Saharan Africa. AIDS 14 S275 284
54. WHO 2006 Diagnostics for tuberculosis: global demand and market potential. Geneva World Health Organization
55. WHO 2005 Preventing Chronic Diseases: A Vital Investment. WHO, editor. Geneva
56. WHO 2004 Global Burden of Disease Surveillance. World Health Organization
57. World Health Organization 2008 The World Health Report 2008 - primary Health Care. Geneva WHO
58. ClaytonT
ThompsonM
MeadeTW
2008 Recent respiratory infection and risk of cardiovascular disease: case-control study through a general practice database. Eur Heart J 29 96 103
59. MituschR
LuedemannJ
WoodWG
BergerK
SchminkeU
2005 Asymptomatic carotid atherosclerosis is associated with circulating Chlamydia pneumoniae DNA in younger normotensive subjects in a general population. Arterioscle Thromb Vasc Bio 25 386 391
60. RichardsonS
WillcoxA
BoneAJ
FoulisAK
MorganNG
2009 The prevalence of enteroviral capsid protein vp1 immunostaining in pancreatic islets in human type 1 diabetes. Diabeteologia 52 1143 1151
61. ReidpathD
MorelCM
MecaskeyJW
AlloteyP
2009 The Millennium Development Goals fail poor children: The case for equity-adjusted measures. PLoS Med 6 e1000062
62. NaimoliJ
2009 Global health partnerships in practice: taking stock of the GAVI Alliance's new investment in health systems strengthening. Int J Health Plan Mgmt 24 3 25
63. YuD
SouteyrandY
BandaMA
KaufmanJ
PerriensJH
2008 Investment in HIV/AIDS programs: Does it help strengthen health systems in developing countries? Global Health 4
64. KramerM
1987 Determinants of low birthweight, methodological assessment & meta-analysis. Bull WHO 65 663 733
65. JohnR
2008 Crowding out effect of tobacco expenditure and its implications on household resource allocation in India. Soc Sci Med 66 1356 1367
66. DiFranzaJ
LewRA
1995 Effect of maternal cigarette smoking on pregnancy complications and sudden infant death syndrome. J Fam Pract 40 385 394
67. JeonC
MurrayMB
2008 Diabetes mellitus increases the risk of active tuberculosis: a systematic review of 13 observational studies. PLoS Med 5 e152 doi:10.1371/journal.pmed.0050152
Štítky
Interní lékařstvíČlánek vyšel v časopise
PLOS Medicine
2010 Číslo 3
- Alternativní léčebné možnosti u hypercholesterolemie při intoleranci statinů
- Vliv kombinace nutraceutik na remodelaci levé komory srdeční u osob s metabolickým syndromem
- Nutraceutika a jejich ovlivnění mírného kardiometabolického rizika
- Princip účinku medu v léčbě chronických i infikovaných ran
- Superoxidovaný roztok a jeho využití v léčbě ran
Nejčtenější v tomto čísle
- BMI and Risk of Serious Upper Body Injury Following Motor Vehicle Crashes: Concordance of Real-World and Computer-Simulated Observations
- Unravelling the Genetics of Ischaemic Stroke
- Providing Alcohol-Related Screening and Brief Interventions to Adolescents through Health Care Systems: Obstacles and Solutions
- Human Resource and Funding Constraints for Essential Surgery in District Hospitals in Africa: A Retrospective Cross-Sectional Survey