
The Promise of Prevention: The Effects of Four Preventable Risk Factors on National Life Expectancy and Life Expectancy Disparities by Race and County in the United States
Background:
There has been substantial research on psychosocial and health care determinants of health disparities in the United States (US) but less on the role of modifiable risk factors. We estimated the effects of smoking, high blood pressure, elevated blood glucose, and adiposity on national life expectancy and on disparities in life expectancy and disease-specific mortality among eight subgroups of the US population (the “Eight Americas”) defined on the basis of race and the location and socioeconomic characteristics of county of residence, in 2005.
Methods and Findings:
We combined data from the National Health and Nutrition Examination Survey and the Behavioral Risk Factor Surveillance System to estimate unbiased risk factor levels for the Eight Americas. We used data from the National Center for Health Statistics to estimate age–sex–disease-specific number of deaths in 2005. We used systematic reviews and meta-analyses of epidemiologic studies to obtain risk factor effect sizes for disease-specific mortality. We used epidemiologic methods for multiple risk factors to estimate the effects of current exposure to these risk factors on death rates, and life table methods to estimate effects on life expectancy. Asians had the lowest mean body mass index, fasting plasma glucose, and smoking; whites had the lowest systolic blood pressure (SBP). SBP was highest in blacks, especially in the rural South—5–7 mmHg higher than whites. The other three risk factors were highest in Western Native Americans, Southern low-income rural blacks, and/or low-income whites in Appalachia and the Mississippi Valley. Nationally, these four risk factors reduced life expectancy at birth in 2005 by an estimated 4.9 y in men and 4.1 y in women. Life expectancy effects were smallest in Asians (M, 4.1 y; F, 3.6 y) and largest in Southern rural blacks (M, 6.7 y; F, 5.7 y). Standard deviation of life expectancies in the Eight Americas would decline by 0.50 y (18%) in men and 0.45 y (21%) in women if these risks had been reduced to optimal levels. Disparities in the probabilities of dying from cardiovascular diseases and diabetes at different ages would decline by 69%–80%; the corresponding reduction for probabilities of dying from cancers would be 29%–50%. Individually, smoking and high blood pressure had the largest effect on life expectancy disparities.
Conclusions:
Disparities in smoking, blood pressure, blood glucose, and adiposity explain a significant proportion of disparities in mortality from cardiovascular diseases and cancers, and some of the life expectancy disparities in the US.
: Please see later in the article for the Editors' Summary
Published in the journal:
. PLoS Med 7(3): e32767. doi:10.1371/journal.pmed.1000248
Category:
Research Article
doi:
https://doi.org/10.1371/journal.pmed.1000248
Summary
Background:
There has been substantial research on psychosocial and health care determinants of health disparities in the United States (US) but less on the role of modifiable risk factors. We estimated the effects of smoking, high blood pressure, elevated blood glucose, and adiposity on national life expectancy and on disparities in life expectancy and disease-specific mortality among eight subgroups of the US population (the “Eight Americas”) defined on the basis of race and the location and socioeconomic characteristics of county of residence, in 2005.
Methods and Findings:
We combined data from the National Health and Nutrition Examination Survey and the Behavioral Risk Factor Surveillance System to estimate unbiased risk factor levels for the Eight Americas. We used data from the National Center for Health Statistics to estimate age–sex–disease-specific number of deaths in 2005. We used systematic reviews and meta-analyses of epidemiologic studies to obtain risk factor effect sizes for disease-specific mortality. We used epidemiologic methods for multiple risk factors to estimate the effects of current exposure to these risk factors on death rates, and life table methods to estimate effects on life expectancy. Asians had the lowest mean body mass index, fasting plasma glucose, and smoking; whites had the lowest systolic blood pressure (SBP). SBP was highest in blacks, especially in the rural South—5–7 mmHg higher than whites. The other three risk factors were highest in Western Native Americans, Southern low-income rural blacks, and/or low-income whites in Appalachia and the Mississippi Valley. Nationally, these four risk factors reduced life expectancy at birth in 2005 by an estimated 4.9 y in men and 4.1 y in women. Life expectancy effects were smallest in Asians (M, 4.1 y; F, 3.6 y) and largest in Southern rural blacks (M, 6.7 y; F, 5.7 y). Standard deviation of life expectancies in the Eight Americas would decline by 0.50 y (18%) in men and 0.45 y (21%) in women if these risks had been reduced to optimal levels. Disparities in the probabilities of dying from cardiovascular diseases and diabetes at different ages would decline by 69%–80%; the corresponding reduction for probabilities of dying from cancers would be 29%–50%. Individually, smoking and high blood pressure had the largest effect on life expectancy disparities.
Conclusions:
Disparities in smoking, blood pressure, blood glucose, and adiposity explain a significant proportion of disparities in mortality from cardiovascular diseases and cancers, and some of the life expectancy disparities in the US.
: Please see later in the article for the Editors' Summary
Introduction
Life expectancy disparities in the United States (US) are extremely large and have persisted over time [1]–[6]. For example, black men and women in the US live 6.3 and 4.5 years, respectively, less than their white counterparts [3]. The life expectancy gap between the counties with the highest and lowest life expectancies is about 18.4 years for men and 14.3 years for women, with even larger disparities for race–county combinations [1],[2]. Previous research has shown that disparities in mortality from chronic diseases, especially cardiovascular diseases (CVD), cancers, and diabetes, are the main determinants of life expectancy disparities by race and by county in the US, with additional effects from HIV/AIDS and homicide in men [1]–[3],[7],[8]. Disparities for diseases related to smoking and alcohol use, and those related to health care access, also seem to be determinants of mortality disparities by socioeconomic status in European countries [9].
Preventable risk factors such as smoking, elevated blood pressure, and adiposity are responsible for hundreds of thousands of chronic disease deaths in the US [10]. Data from health examination and interview surveys show that there are large differentials by race, state of residence, and socioeconomic status in exposure to these risk factors [7],[11]–[17]. To ensure that prevention policies and programs not only improve average health status but also reduce disparities, it is essential to know how much the observed disparities in risk factor exposure contribute to disparities in mortality and life expectancy. The effects of modifiable risk factors on US mortality disparities have also been analyzed in selected cohorts [18]–[20]. National analysis in the US has been limited to the effects of smoking on male mortality disparities or to the effects of multiple risk factors on disparities in self-reported health status and disease diagnosis [21]–[23]. There is currently no estimate of the effects of multiple modifiable risk factors on life expectancy disparities in the US. This is in contrast to the extensive research on the socioeconomic and health care determinants of health disparities [24]–[29]. This lack of evidence limits the ability to assess how risk factor interventions are expected to affect health disparities above and beyond their aggregate national impacts, and what combination of risk factor interventions may be used, in combination with social and health care policies, to reduce mortality disparities.
We used multiple national data sources on risk factor exposures and epidemiologic evidence on their mortality effects to quantify how much four major chronic disease risk factors affect life expectancy disparities in the US, individually and in combination. Specifically, we examined how differentials in current risk factor exposure account for disparities in life expectancy and disease-specific mortality among population subgroups based on race and the location and socioeconomic characteristics of county of residence.
Methods
Population Subgroups
Previous analyses have demonstrated that grouping the US population by a combination of race and county characteristics (region, median county income by race, rural versus urban status of a county, and urban homicide risk) encompass a relatively large part of the overall observed race–county life expectancy disparities, while keeping the number of subgroups tractable and their definitions constant over time [1],[2]. Based on these findings, we used eight subgroups of the US race–county combinations, referred to as the Eight Americas in a previous work [1] and defined in Table 1, as our units of analysis. The Eight Americas also provide sufficient sample size for statistically reliable estimates of risk factors and disease-specific mortality.
![Definitions and selected characteristics of the Eight Americas <em class="ref">[1]</em>.](https://pl-master.mdcdn.cz/media/cache/media_object_image_large/media/image/7a4b1b65b6fe9fb19cf591688155e9a2.png)
Risk Factors in the Analysis
The risk factors in this analysis were four of five leading risk factors for mortality in the US based on our recent analysis [10]: smoking, high blood pressure (measured with usual systolic blood pressure, SBP), high blood glucose (measured with usual fasting plasma glucose, FPG), and adiposity (measured with body mass index, BMI). In 2005, smoking was responsible for an estimated 467,000 deaths, high blood pressure 395,000, high BMI 216,000, and high blood glucose 190,000 [10]. Inadequate/no physical activity was the fourth leading risk factor but was not included because the available data were not of sufficient quality to directly measure or indirectly estimate exposure in the Eight Americas.
We report disparities in life expectancy and probabilities of death across the Eight Americas using both the population-weighted standard deviation (SD) of life expectancy and the difference in life expectancy between the Americas with the highest and lowest life expectancies.
Calculating Mortality Attributable to Risk Factors
We estimated the number of deaths that would have been prevented in 2005 if past and current exposure to these risk factors had been at an alternative (lower) distribution. This can be interpreted as the excess number of deaths (or excess mortality rate) caused by the individual - and population-based determinants that have led to the observed distributions of risk factor exposure. We conducted all analyses separately by sex and age group (30–44, 45–59, 60–69, 70–79, and 80+ years), and separately for each of the Eight Americas.
Most chronic diseases are caused by multiple risk factors that act together, sometimes through overlapping pathways. For example, some CVD deaths in people who both smoke and have high SBP may be prevented by reducing either risk factor. Further, the effects of one risk factor, e.g. BMI, may be mediated partly through other risks, e.g. SBP and FPG. Therefore, simple addition of the effects of individual risk factors will generally overestimate the true combined impact of multiple factors. Our analyses systematically incorporated multicausality and mediated effects as described below.
For each America–age–sex unit of analysis, we first calculated the proportion of disease-specific deaths that would have been prevented if the exposure to these risks had been reduced to an alternative (lower) distribution; this metric is known as the population attributable fraction (PAF). The diseases included in the analysis were selected on the basis of a review of evidence on causal associations, with the sources of evidence and list of diseases with strong or convincing evidence presented in detail elsewhere [10].
In previous work, we had calculated the PAF using the distribution of individual risks in the population [10],[30] and had subsequently used a simple relationship to calculate the combined (joint) PAF for multiple risks [31]. In the current analysis, we used a computational approach that incorporated two important features of multiple risk analysis: First, the effects of BMI on CVD are mediated partly through SBP and FPG, which are also included in the analysis, with the remainder through other pathways (e.g., dyslipidemia and inflammation) [32]–[34]. Therefore, the combined effects of BMI, SBP, and FPG will be those of the latter two plus the non-SBP/FPG-mediated effect of BMI. Data sources for establishing the mediated component of the effect of BMI on CVD outcomes are described below. The second feature of multiple risks incorporated into our current analysis is their correlation, i.e., that some people have higher/lower exposure to multiple risk factors due to common socioeconomic or behavioral determinants. It is known that when risk factors are correlated, the simple approach to estimating PAFs that assumes independent distributions may be biased [35]. To incorporate risk factor correlation, we computed the PAF by summing the risks for individual BRFSS participants, weighted by their sampling probability (see Text S1 for details).
For each disease causally associated with these risk factors, the mortality rate attributable to the combined effects of risk factors was calculated by multiplying the joint PAF with the observed mortality rate in the corresponding America–age–sex unit of analysis. To calculate all-cause mortality attributable to risk factors, we summed the attributable disease-specific mortality rates in each America–age–sex unit of analysis. Mortality rates from different diseases can be added because the International Classification of Disease system assigns each death categorically to only one underlying disease cause; hence deaths from different diseases are mutually exclusive and additive.
Calculating the Effects of Risk Factors on Life Expectancy and Probabilities of Death
We calculated life expectancy for each America using standard life table methods, and used validated demographic techniques to estimate the mortality rates in the oldest ages where both population numbers from census and the number of deaths from vital registration are less reliable [36],[37]. We calculated life tables for each sex and America using the observed age-specific mortality rates as well as the mortality rates that would be expected if risk factor exposures had been at the alternative distribution. The differences between the two sets of life expectancies measure the life expectancy gain from having reduced risk factors to the alternative distribution. Similarly, we used life table methods to calculate the effects of risk factors on the probability of dying between the ages of 15 and 60 y (denoted 45Q15) and between the ages of 60 and 75 y (denoted 15Q60).
Data Sources
Risk factor exposure
National Health and Nutrition Examination Survey (NHANES) provides measured risk factor data by race at the national level; Behavioral Risk Factor Surveillance System (BRFSS) provides subnationally representative self-reported data on weight and height, smoking, and history of diagnosis with hypertension and diabetes. Self-reported weight and height data may be biased because of intentional misreporting. For SBP and FPG, respondents may not be aware of their risk status if they have not had recent health system encounter; after diagnosis, medication use and lifestyle modification may lower risk factor level. We used previously described and validated statistical methods [14]–[16] to combine data from NHANES and BRFSS for estimating unbiased risk factor levels in the BRFSS. BRFSS records could be assigned to the Eight Americas using race and county identifiers. We pooled the BRFSS data for 2003 and 2005 in this analysis because these years included all variables needed for predicting unbiased risk factor levels as well as county identifiers. County identifiers for 2006 and subsequent years were not available to us.
Disease-specific deaths
The number of deaths by underlying cause, age and sex in 2005 was obtained from the National Center for Health Statistics (NCHS), which maintains records for all deaths in the US. Although the US has automated (computerized) assignment of an International Classification of Diseases code for the underlying cause of death, the validity and comparability of cause of death statistics may be affected at the time of medical certification, especially for CVD and diabetes [38]–[40]. We adjusted for incomparability in cause of death assignment using previously described methods [38],[39]. These adjustments required information on multiple contributing causes of death and county of residence. We obtained county identifiers for all deaths in 2005 through a special request to the NCHS.
Linked mortality follow-up studies in the US have found that there is differential under - or overestimation of race-specific mortality rates [5]. This occurs because race is recorded by individuals or their families in the census and by the certifying physician or funeral facility on the death certificate. Differential recording is a potential source of bias in race-specific mortality rates and life expectancy. Studies using linked data have shown that this bias may be as much 3% among Asians, which are one of the Eight Americas. We used the National Mortality Followback Survey [5] to adjust for this bias in America 1, by age and sex. There was a corresponding reduction in deaths in America 3, the group to which Asians are most likely to be misclassified, so that the total number of deaths in the US remained constant.
Population
We obtained population estimates for 2005 by age, sex, race, and county of residence from the NCHS. We used post-enumeration surveys to adjust the population estimates for under-counting of Asian Americans [5]. The combination of adjustments for under-reporting of deaths and under-counting of population in census for Asian-Americans increased the mortality rate in this group (America 1) by 3%.
Effects of individual risk factors on disease-specific mortality
We estimated mortality effects for those diseases for which there was strong or convincing evidence of causal association, with evidence evaluated in previous work [10]. For each risk factor and disease we obtained relative risks (RRs) by age and sex from systematic reviews and meta-analyses of most recent epidemiologic studies, as described elsewhere [10].
We reviewed the evidence on whether RRs vary by race from trials and observational studies in the US and other countries (Table S1). The current evidence indicates that while the absolute effects (e.g., excess mortality rate) of risk factors vary by race, their proportional effects (i.e., RR) did not vary appreciably by race and ethnicity.
Effect of BMI mediated by SBP and FPG
We used a recent meta-analysis of epidemiologic studies that had estimated the effect of BMI on CVD that is mediated through SBP and FPG, and found additional studies (Table S2) that that had not been included in this meta-analysis. Based on a quantitative overview of these studies, we estimated that 50% (95% CI 30%–70%) of the excess risk (RR minus one) for the effect of BMI on CVD was mediated through SBP and FPG.
Alternative Risk Factor Exposure Distributions
We estimated the effects of risk factors on mortality and life expectancy in the Eight Americas relative to three different alternative exposure distributions (Table 2): (1) the lowest observed exposure in any of the Eight Americas, by age (because this exposure has been achieved in at least one of the Americas, it constitutes a feasible alternative); (2) an optimal distribution in which the hazardous effects of risk factors are minimized, as described in detail elsewhere [10],[41]; and (3) a distribution whose mean equals current clinical guidelines.

Analyses of Uncertainty
We quantified the uncertainty due to sampling variability using a simulation approach. In each of 1,000 simulation rounds, for each America–age–sex analysis unit, we drew (1) a random sample of the participants in the BRFSS; this sample was drawn with replacement and the sample size was equal to the original number of participants with no missing risk factor data (bootstrapping) [42]); (2) a RR for each disease causally associated with risk factors from a log-normal distribution whose standard error was from epidemiologic studies [10]; (3) the proportion of the excess risk of BMI mediated through SBP and FPG from a normal distribution with mean of 0.5 and SD of 0.1; and (4) a disease-specific mortality rate for each disease causally associated with risk factors, with the distribution of mortality rate obtained as described elsewhere [2]. The 1,000 simulated draws were used to estimate the sampling uncertainty for mortality and life expectancy impacts of risk factors.
All analyses were conducted using STATA 10.1 (StataCorp, Texas, USA). The simulations were run on the Orchestra Research Computing Custer supported by the Harvard Medical School Research Information Technology Group.
Results
Disparities in Risk Factor Exposure
There were substantial disparities in exposure to these four risk factors across the Eight Americas (Table 3). Asian American men and women (America 1) had the lowest BMI, FPG, and smoking, while whites had the lowest mean SBP. The highest SBP was observed in blacks, especially those in the rural South (America 7), whose mean SBP was 5–7 mmHg higher than whites in different age and sex groups. The highest mean BMI was in western Native American men (age-standardized mean 30.0 versus 26.7 kg/m2 in Asians) and Southern low-income rural black women (age-standardized mean 33.9 versus 26.2 kg/m2 in Asians). Mean FPG across the Eight Americas generally followed the same pattern as BMI. Western Native Americans (America 5) and low-income whites in the Appalachia and Mississippi Valley (America 4) had the highest smoking prevalence, with about 30% of men and women currently smoking. Smoking prevalence was also relatively high among blacks.

Effects of Risk Factors on Life Expectancy in the Eight Americas
In 2005, national life expectancy in the US was 75.1 y for men and 80.3 for women. Asians had the highest life expectancy at birth in the Eight Americas, reaching 86.8 y for women and 82.3 for men (Figure 1); these are, respectively, about 1 and 2 y higher than the highest life expectancies in the world (Japan for women and San Marino for men). Blacks had the lowest life expectancy in both men (68.1 y in the rural South and high-risk urban areas) and women (74.9 y in the rural South). There was a declining life expectancy gradient from America 1 to Americas 7 and 8, with the 14 - and 12-y gaps in men and women equal to those observed between middle - and high-income countries worldwide [1]. The population-weighted SD of the Eight Americas life expectancies was 2.7 y for men and 2.1 y for women.

Nationally, the four preventable risk factors have lowered life expectancy by an estimated 4.9 y for men and by 4.1 y for women. Had these four risk factors been reduced to their optimal distributions in all groups, gains in life expectancy would have been larger in the Americas with currently low life expectancy, although there would be benefits in other groups also (Figure 1). For example, Southern low-income rural black men and women (America 7) would have gained 6.7 and 5.7 y, respectively, versus 4.1 and 3.6 y in Asians (America 1). The life expectancy benefits were larger for men than for women in all Americas, except in western Native Americans (4.6 y for men versus 5.0 for women). Among whites, the largest gains were in Appalachia and Mississippi Valley (America 4), where men and women would gain 5.7 and 4.5 y life expectancy if risk factor exposures were at optimal levels. Had risk factor levels been at their optimal distributions in all Americas, the population weighted SD of life expectancies would be lowered by 0.50 y (18%) in men and 0.45 y (21%) in women; life expectancy gaps between the best - and worst-off Americas would be lowered by 1.9 y (13%; America 1 versus America 8) in men and 2.0 y (17%; America 1 versus America 7) in women.
The life expectancy gains under the other two more realistic alternative exposure distributions were smaller than those under optimal distributions, by 0.7–1.5 y in different Americas when the lowest observed exposure by age was used and by 1.0–1.6 y when the guidelines were met (Figure 1). These more modest risk factor reductions would nonetheless have larger benefits for those Americas with currently lower life expectancy, and hence reduce life expectancy disparities. These alternative risk factor distributions would lower population-weighted SD by 0.44–0.47 y, about the same as those expected when risks were lowered to their optimal levels.
When risk factors were analyzed individually, removing smoking would have led to the largest gains in life expectancy in men in all Eight Americas, and in white and Native American women (Table 4). Smoking reduction alone accounted for 42%–58% of the years gained by all four risks in men and 12%–46% in women in these Americas (noting that the effects of individual risk factors on life expectancy are not additive due to multicausality and competing risk from other diseases). Lowering blood pressure to its optimal distribution would have achieved between 27% (men in America 4) and 69% (women in America 1) of the benefits of all four risk factors. The largest benefit from any single risk factor among black women was from lower blood pressure, alone explaining about one-half of the life expectancy gain from all four risks (47%–49%). Adiposity was the second single most important risk factor in black women (40%–48%).

Effects of Risk Factors on Disease-Specific Probabilities of Death
Western Native Americans (America 5) and low-income blacks in the rural South (America 7) and high-risk urban areas (America 8) had the highest probability of dying between the ages of 15 to 60 y (45Q15) in the year 2005 (Figures 2 and 3). In these three Americas, about one out of four men and one out of six women who survived to age 15 are expected to die before their 60th birthday (versus 4% for men and 7% for women in America 1). Most of these deaths were caused by CVD and cancers, except in Native Americans, among whom injuries, diabetes, liver cirrhosis, digestive diseases, and alcohol use disorders also contributed substantially to young and middle-aged deaths. HIV/AIDS continued to be an important cause of death in young and middle-aged blacks despite the availability of efficacious treatments. The survival advantage of Asians and whites (except those in America 4) continued into older ages, with Asians who survive to their 60th birthday having a 19% (men) and 13% (women) probability of dying before their 75th birthday (15Q60), versus 44% and 29% for Southern rural blacks (Figures 2 and 3).
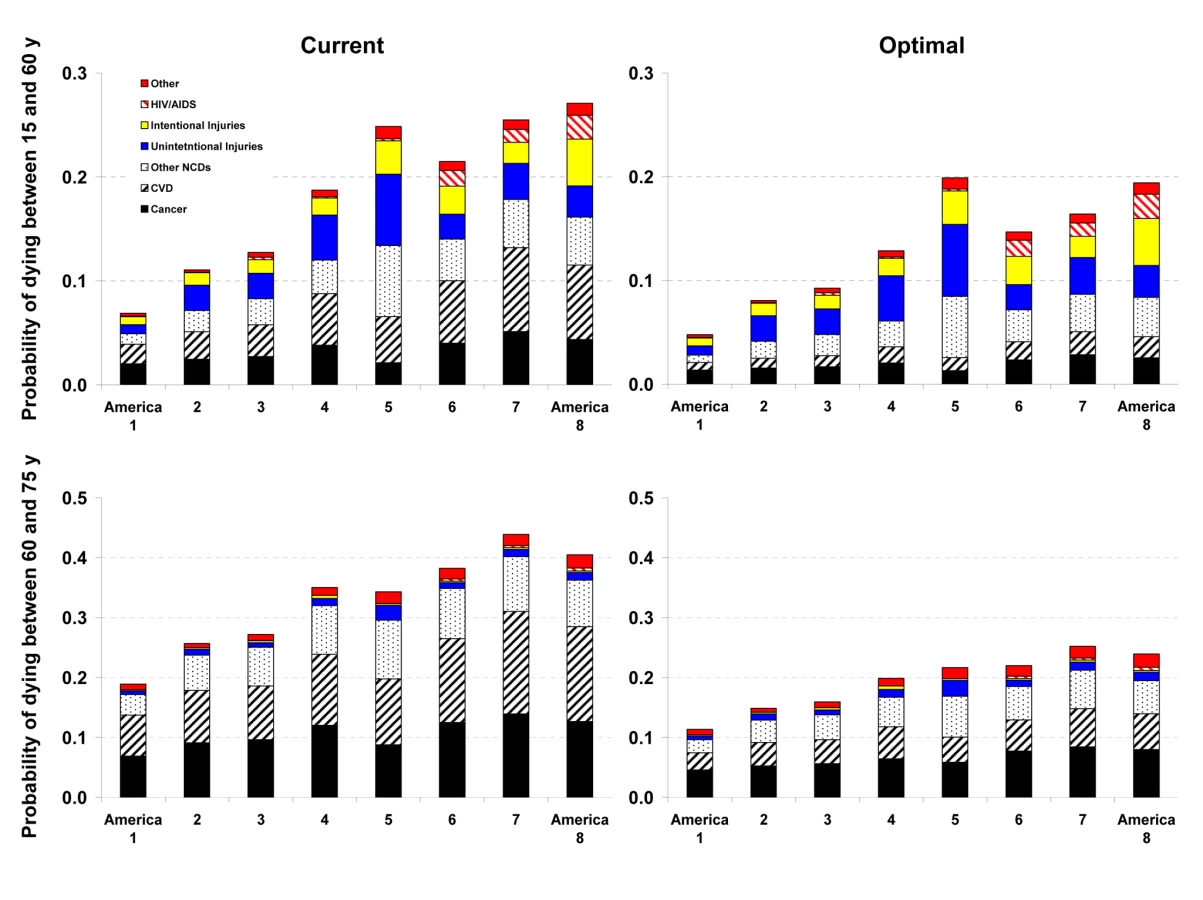

Reducing smoking, SBP, FPG, and BMI to their optimal distributions would have improved survival in all Eight Americas, with the largest benefits in those that currently have the highest probabilities of death. For example, the disparity in male 45Q15 between the highest and the lowest probability of death in 2005 would decline from 0.20 to 0.15; similarly, the disparity in female 45Q15 between highest and lowest probability of death would decline from 0.12 to 0.08 if these risks were at their optimal distributions. There would also be a reduction in survival disparities in older adults (15Q60).
The largest disparity effects of these risk factors were on CVD and diabetes mortality. CVD and diabetes mortality disparities in different age and sex groups in the optimal risk factor scenario would be 69%–80% smaller than their current levels. Similarly, cancer mortality disparities would be 29%–50% lower. Among cancers, breast, colorectal, and residual lung cancer deaths were the main source of remaining disparities, with their rates largest among blacks and in low-income whites in Appalachia and Mississippi Valley (America 4).
Discussion
Life expectancy disparities in the US, measured in relation to individual and community characteristics, are enormous by international standards. The Eight Americas encompass a large part of US life expectancy disparities, while forming easily identifiable subgroups of the US population. We have shown that a small number of preventable risk factors such as smoking, high blood pressure, elevated blood glucose, and adiposity are the leading risk factors for mortality in the US [10]. The results from the current analysis suggest that these risk factors also contribute to the mortality disparities across the Eight Americas, especially for CVD and cancers. Therefore, had these risk factors been reduced to their optimal levels or even to the commonly used guidelines, there would be both aggregate health benefits and a considerable decline in life expectancy disparities. Our conclusions on the role of these risk factors on life expectancy disparities across the Eight Americas were not sensitive to the specific disparity metric used (for a discussion of disparity metrics see [43]).
Analyses of disease-specific probabilities of death identified injuries, HIV/AIDS (especially for men), and selected noncommunicable diseases as those that accounted for disparities that remained after risk factors were reduced to optimal levels. Once we removed deaths from homicide, road traffic injuries, and HIV/AIDS in addition to the effects of risk factors, life expectancy further improved with larger benefits to the Americas that currently have lower life expectancy, especially for men. For example, reducing risk factors to their optimal levels and removing these three medical causes of death increased male life expectancy in Americas 5, 7, and 8 by 7.3–9.4 y (compared with 4.6–6.7 y when only risk factors are reduced). Yet even CVD mortality had a residual gradient, albeit substantially smaller, after four of its most salient risk factors were removed, with a clear survival advantage among Asians (Figures 2 and 3). The reasons for this residual advantage may be risk factors not included in our analysis (e.g., lower lipids as a result of dietary composition or use of statins, psychosocial factors, etc.) or disparities in health care access and quality of care. These factors could not be estimated in the BRFSS, but should be the subject of future data collection and research. Further, the benefits of reducing current exposure occurs over time and requires additional analysis of time-dependent effects. Most of the benefits nonetheless seem to occur within about 5 y for cardiovascular risk factors [44]; even for the effects of smoking on cancers and chronic respiratory diseases, which have longer periods of risk reversibility, 75% or more of the benefits of cessation occur by about 15 y [45].
Our results on the effect of multiple preventable risk factors on life expectancy disparities at the national level are supported by those from analyses in specific cohorts, which were not nationally representative. For example, in the Atherosclerosis Risk in Communities (ARIC) Study, blacks and whites had nearly identical CVD incidence rates after adjustment for smoking, blood pressure, cholesterol and glucose [18]. Analyses of the Multiple Risk Factor Intervention Trial found that adjustment for major CVD risk factors reduced the differences in CVD mortality although there was a statistically significant remaining difference [19],[20]. A recent reanalysis of the Whitehall follow-up study found that interventions for the same risk factors as the ARIC study were expected to reduce coronary heart disease mortality differentials between occupational classes by 86% [46]. Finally, the Korean National Health and Nutrition Examination Survey follow-up study also found that absolute socioeconomic mortality inequalities could be substantially reduced if either behavioral (smoking, alcohol use, and physical inactivity) or metabolic risks (blood pressure, fasting serum glucose, and serum total cholesterol) were improved [47],[48]. Some of these studies found larger effects of risk factors on disparities that those in our analysis, possibly due to the inclusion of other risks (e.g., lipids, physical inactivity) and indicators such as income and education that either directly or through other metabolic, dietary, and lifestyle factors affect mortality disparities. National analysis in the US estimated that 58% of disparities in total mortality among young and middle-age men was due to smoking; there also seems to be some effect of risk factors on disparities in self-reported disease diagnoses and health status (noting that self-reported health status is commonly measured with bias, error, and incomparability) [21]–[23],[49].
Beyond its innovation in assessing the effects of modifiable risk factors on the national US life expectancy disparities, our analysis has several strengths. Our PAF calculations incorporated multicausality and mediated effects, with parameters from systematic or comprehensive reviews of epidemiologic studies. We calculated PAFs for multiple risk factors using individual level exposure data, thereby eliminating the need to parameterize the joint distribution of risk factors and make strong assumptions about the shape of the distributions and their correlations. Our outcome variables were life expectancy and probabilities of death, which incorporate competing risks from other diseases using life table methods. Further, life tables were estimated separately for the Eight Americas and by sex because they have distinct patterns of competing risks. Finally, we quantified the uncertainty as a result of the sampling variability in exposure, RRs, mediated effects of BMI, and disease-specific mortality rates.
Population-level analyses like ours also have limitations. First, the BRFSS does not provide data or indicators of sufficient detail and quality on alcohol use, blood lipids, relevant dietary risk factors (e.g., salt and various fats), and physical activity in the Eight Americas. Therefore, these risk factors could not be included in our analysis, even though they may have significant variation by race and/or region [12],[50]–[52]. Using NHANES 2003–2006 data at the national level, the combined effects of LDL cholesterol and the four risk factors in our analysis on life expectancy would be 0.1 y higher for men and women than that of these four risk factors alone. The difference between the effects of the two clusters of risk factors is small despite the fact that LDL cholesterol is an important risk factor for CVD mortality; rather, because of multicausality, the combined PAF for the effects of multiple risk factors grows by progressively smaller amounts with each additional risk factor, even when its individual effect is relatively large. Further, mean age-standardized LDL cholesterol among blacks was only 1 mg/dl (<1%) higher than whites for men; black women had lower cholesterol than whites by 7 mg/dl (∼6%), indicating that its contribution to disparities may be modest across groups other than Asians. Harmful alcohol use is an important risk factor for injuries and diseases such as cirrhosis, which had substantial disparity in the Eight Americas [53].
The second limitation of our analysis arises from the fact that the possibility of effect size modification by race cannot be ruled out, even though the current evidence is generally consistent with RRs being similar by race. RR differences may be especially relevant for smoking, for which factors such as smoking intensity and duration of smoking or smoking cessation may influence RRs. Third, because BRFSS does not measure SBP, FPG, weight, and height, we applied validated statistical models to NHANES and BRFSS data to predict these variables and correct for bias in self-reported data [14]–[16]. While this is an innovative use of multiple data sources for subnational risk factor measurement, with relatively high predictive power, it could use only those predictors that were measured in NHANES and BRFSS using consistent or comparable questionnaires. There was unexplained variation in the model that could result in underestimating exposure variability across the Eight Americas [15]. Hence our results should be considered conservative estimates of the effects of risk factors on mortality disparities. Further, these prediction models result in additional uncertainty beyond sampling error, making the reported uncertainty intervals in Figure 1 an underestimate of the true uncertainty. Fourth, the combined effects of the four risk factors included in our analysis may follow a model different fromthat presented in Text S1. For example, a part of the effect of smoking on cardiovascular diseases may be mediated through blood pressure and/or glucose. A sensitivity analysis showed that 25% of the effects of smoking on cardiovascular outcomes were mediated through these factors, our estimated effects on lifeexpectancy levels and disparities would change by less than 0.06 y.
A key feature of our analysis is using the Eight Americas, which are based on race, and on county location and socioeconomic characteristics. As discussed in previous work [1],[2], using county and race–county combinations as units of analysis has allowed us to examine mortality disparities in consistent, comparable, and easily identifiable units over decades, but does not capture within-county variations in risk factor exposure and mortality. Finally, we could not include individuals with Hispanic ethnicity as a separate America. Previous analyses have shown that Hispanic ethnicity is significantly under-recorded on death certificates, leading to implausibly high life expectancies when combined with population estimates from census using self-reported Hispanic ethnicity [54],[55]. Future analyses should attempt to adjust for this mortality undercount, or conduct analyses for Hispanics in regions where mortality undercount is likely to be small, e.g., in states with large Hispanic population [56].
Our results demonstrate that a small number of risk factors for chronic diseases account for a noticeable part of the disparities in life expectancy in the US, with the largest contributions from smoking and high blood pressure. These disparity effects influence young and middle-aged adults, as well as older adults, with the largest effects on CVD, diabetes, and some cancers. The report of the WHO Commission on Social Determinants of Health has called attention to distribution of money, power, and resources as the underlying sources of health disparities, but has also emphasized the need to focus on common risk factors for chronic diseases with known and effective interventions [57]. Similarly the most recent House of Commons Health Committee Report in the UK identified three groups of causes for health inequalities: access to health care, socioeconomic factors, and lifestyle factors [58]. The essential question is therefore how to use disease prevention to improve health and reduce health disparities together with policies that aim to reduce socioeconomic disparities, reform health care, and improve quality of care.
An essential first step in achieving the aggregate and disparity promises of prevention is to discard a dominant view in the US that behavioral, dietary, and metabolic risk factors are either personal choices and responsibilities or are in the domain of clinical practice and hence only a subject of health education and physician advice for individuals. Rather, we must identify, implement, and rigorously evaluate effective population-based and personal interventions that can reduce these preventable risk factors or mitigate their effects on disease outcomes (see, for example, the reviews commissioned by the Robert Wood Johnson Foundation on disparities in CVD and diabetes [59],[60]). Few or no current interventions have been effective in reducing overweight and obesity at the population level, emphasizing the need to develop and test new creative and ambitious interventions. Diabetes prevention through lifestyle and pharmacological interventions has been efficacious in trials [61] but should be evaluated in community settings. Smoking and blood pressure both have efficacious and cost-effective interventions, and have successfully been lowered in the adult US population as a whole for decades. These interventions need to reach population subgroups and counties where smoking and blood pressure remain high. Salt intake is an important predictor of population blood pressure [62],[63], and regulating and reducing salt in prepared and packaged food is an effective population-level intervention [64]; screening and use of antihypertensives or combination therapy to reduce blood pressure and cardiovascular risk is also cost-effective [65] and should be scaled up as a part of expanding and improving primary care in the context of US health reform. A recent systematic review of smoking interventions hypothesized that population-level interventions have the potential to reduce disparities in smoking [66]. Yet in practice, US risk factor trends have at best had a mixed performance in terms of reducing exposure disparities [17]. Therefore, both national versus local and aggregate versus disparity effects should determine the design, implementation, and evaluation of policies and programs that aim to reduce risk factor exposure.
Supporting Information
Zdroje
1. MurrayCJ
KulkarniSC
MichaudC
TomijimaN
BulzacchelliMT
2006 Eight Americas: investigating mortality disparities across races, counties, and race-counties in the United States. PLoS Med 3 e260 doi:10.1371/journal.pmed.0030260
2. EzzatiM
FriedmanAB
KulkarniSC
MurrayCJ
2008 The reversal of fortunes: trends in county mortality and cross-county mortality disparities in the United States. PLoS Med 5 e66 doi:10.1371/journal.pmed.0050066
3. HarperS
LynchJ
BurrisS
DaveySG
2007 Trends in the black-white life expectancy gap in the United States, 1983-2003. JAMA 297 1224 1232
4. SinghGK
SiahpushM
2006 Widening socioeconomic inequalities in US life expectancy, 1980-2000. Int J Epidemiol 35 969 979
5. HahnRA
EberhardtS
1995 Life expectancy in four U.S. racial/ethnic populations: 1990. Epidemiology 6 350 355
6. KriegerN
RehkopfDH
ChenJT
WatermanPD
MarcelliE
2008 The fall and rise of US inequities in premature mortality: 1960-2002. PLoS Med 5 e46 doi:10.1371/journal.pmed.0050046
7. CooperR
CutlerJ
svigne-NickensP
FortmannSP
FriedmanL
2000 Trends and disparities in coronary heart disease, stroke, and other cardiovascular diseases in the United States: findings of the national conference on cardiovascular disease prevention. Circulation 19 3137 3147
8. WongMD
ShapiroMF
BoscardinWJ
EttnerSL
2002 Contribution of major diseases to disparities in mortality. N Engl J Med 347 1585 1592
9. MackenbachJP
StirbuI
RoskamAJ
SchaapMM
MenvielleG
2008 Socioeconomic inequalities in health in 22 European countries. N Engl J Med 358 2468 2481
10. DanaeiG
DingEL
MozaffarianD
TaylorB
RehmJ
2009 The preventable causes of death in the United States: comparative risk assessment of dietary, lifestyle, and metabolic risk factors. PLoS Med 6 e1000058 doi:10.1371/journal.pmed.1000058
11. CowieCC
RustKF
Byrd-HoltDD
EberhardtMS
FlegalKM
2006 Prevalence of diabetes and impaired fasting glucose in adults in the U.S. population: National Health And Nutrition Examination Survey 1999-2002. Diabetes Care 29 1263 1268
12. FordES
LiC
PearsonWS
ZhaoG
MokdadAH
2008 Trends in hypercholesterolemia, treatment and control among United States adults. Int J Cardiol. E-pub ahead of print doi:10.1016/j.ijcard.2008.11.033
13. Lloyd-JonesD
AdamsR
CarnethonM
DeSG
FergusonTB
2009 Heart disease and stroke statistics–2009 update: a report from the American Heart Association Statistics Committee and Stroke Statistics Subcommittee. Circulation 119 480 486
14. EzzatiM
MartinH
SkjoldS
VanderHS
MurrayCJ
2006 Trends in national and state-level obesity in the USA after correction for self-report bias: analysis of health surveys. J R Soc Med 99 250 257
15. EzzatiM
OzaS
DanaeiG
MurrayCJ
2008 Trends and cardiovascular mortality effects of state-level blood pressure and uncontrolled hypertension in the United States. Circulation 117 905 914
16. DanaeiG
FriedmanAB
OzaS
MurrayCJ
EzzatiM
2009 Diabetes prevalence and diagnosis in US states: analysis of health surveys. Popul Health Metr 7 16
17. KanjilalS
GreggEW
ChengYJ
ZhangP
NelsonDE
2006 Socioeconomic status and trends in disparities in 4 major risk factors for cardiovascular disease among US adults, 1971-2002. Arch Intern Med 166 2348 2355
18. HozawaA
FolsomAR
SharrettAR
ChamblessLE
2007 Absolute and attributable risks of cardiovascular disease incidence in relation to optimal and borderline risk factors: comparison of African American with white subjects–Atherosclerosis Risk in Communities Study. Arch Intern Med 167 573 579
19. ThomasAJ
EberlyLE
DaveySG
NeatonJD
StamlerJ
2005 Race/ethnicity, income, major risk factors, and cardiovascular disease mortality. Am J Public Health 95 1417 1423
20. DaveySG
NeatonJD
WentworthD
StamlerR
StamlerJ
1998 Mortality differences between black and white men in the USA: contribution of income and other risk factors among men screened for the MRFIT. MRFIT Research Group. Multiple Risk Factor Intervention Trial. Lancet 351 934 939
21. JhaP
PetoR
ZatonskiW
BorehamJ
JarvisMJ
2006 Social inequalities in male mortality, and in male mortality from smoking: indirect estimation from national death rates in England and Wales, Poland, and North America. Lancet 368 367 370
22. LantzPM
LynchJW
HouseJS
LepkowskiJM
MeroRP
2001 Socioeconomic disparities in health change in a longitudinal study of US adults: the role of health-risk behaviors. Soc Sci Med 53 29 40
23. AvendanoM
GlymourMM
BanksJ
MackenbachJP
2009 Health disadvantage in US adults aged 50 to 74 years: a comparison of the health of rich and poor Americans with that of Europeans. Am J Public Health 99 540 548
24. AdlerN
MarmotM
McEwanB
StewartJ
1999 Socioeconomic status and health in industrial nations: social, psychological, and biological pathways. New York New York Academy of Science 503
25. Committee on the Consequences of Uninsurance, Board on Health Care Services, Institute of Medicine of the National Academies 2004 Insuring America's Health: Principles and Recommendations. Washington (D.C.) National Academy Press 224
26. Committee on Understanding and Eliminating Racial and Ethnic Disparities in Health Care 2003 Unequal Treatment: Confronting Racial and Ethnic Disparities in Health Care.
SmedleyBD
StithAY
NelsonAR
Washington (D.C.) National Academy Press 782
27. ChinMH
WaltersAE
CookSC
HuangES
2007 Interventions to reduce racial and ethnic disparities in health care. Med Care Res Rev 64 7S 28S
28. MarmotM
2007 Achieving health equity: from root causes to fair outcomes. Lancet 370 1153 1163
29. U.S. Department of Health and Human Services, Agency for Healthcare Research and Quality (2005) National Healthcare Disparities Report. Rockville (Maryland): Agency for Healthcare Research and Quality. Publication No. 06-0017
30. EzzatiM
LopezAD
RodgersA
HoornSV
MurrayCJL
2002 Selected major risk factors and global and regional burden of disease. Lancet 360 1347 1360
31. EzzatiM
HoornSV
RodgersA
LopezAD
MathersCD
2003 Estimates of global and regional potential health gains from reducing multiple major risk factors. Lancet 362 271 280
32. NiMC
RodgersA
PanWH
GuDF
WoodwardM
2004 Body mass index and cardiovascular disease in the Asia-Pacific Region: an overview of 33 cohorts involving 310 000 participants. Int J Epidemiol 33 751 758
33. BogersRP
BemelmansWJ
HoogenveenRT
BoshuizenHC
WoodwardM
2007 Association of overweight with increased risk of coronary heart disease partly independent of blood pressure and cholesterol levels: a meta-analysis of 21 cohort studies including more than 300 000 persons. Arch Intern Med 167 1720 1728
34. WilsonPW
BozemanSR
BurtonTM
HoaglinDC
Ben-JosephR
2008 Prediction of first events of coronary heart disease and stroke with consideration of adiposity. Circulation 118 124 130
35. SpiegelmanD
HertzmarkE
WandHC
2007 Point and interval estimates of partial population attributable risks in cohort studies: examples and software. Cancer Causes Control 18 571 579
36. PrestonSH
HeuvelineP
GuillotM
2001 Demography: measuring and modeling population processes. Oxford Blackwell 312
37. CoaleA
GuoG
1989 Revised regional model life tables at very low levels of mortality. Popul Index 55 613 643
38. MurrayCJ
KulkarniSC
EzzatiM
2006 Understanding the coronary heart disease versus total cardiovascular mortality paradox: a method to enhance the comparability of cardiovascular death statistics in the United States. Circulation 113 2071 2081
39. MurrayCJ
DiasRH
KulkarniSC
LozanoR
StevensGA
2008 Improving the comparability of diabetes mortality statistics in the U.S. and Mexico. Diabetes Care 31 451 458
40. LuTH
HsuPY
BjorkenstamC
AndersonRN
2006 Certifying diabetes-related cause-of-death: a comparison of inappropriate certification statements in Sweden, Taiwan and the USA. Diabetologia 49 2878 2881
41. MurrayCJ
EzzatiM
LopezAD
RodgersA
VanderHS
2003 Comparative quantification of health risks conceptual framework and methodological issues. Popul Health Metr 1 1
42. EfronB
TibshiraniR
1986 Bootstrap Methods for Standard Errors, Confidence Intervals, and Other Measures of Statistical Accuracy. Stat Sci 1 54 75
43. HarperS
LynchJ
MeersmanSC
BreenN
DavisWW
2008 An overview of methods for monitoring social disparities in cancer with an example using trends in lung cancer incidence by area-socioeconomic position and race-ethnicity, 1992-2004. Am J Epidemiol 167 889 899
44. LawMR
WaldNJ
ThompsonSG
1994 By how much and how quickly does reduction in serum cholesterol concentration lower risk of ischaemic heart disease? BMJ 308 367 372
45. LinHH
EzzatiM
MurrayM
2007 Tobacco smoke, indoor air pollution and tuberculosis: a systematic review and meta-analysis. PLoS Med 4 e20 doi:10.1371/journal.pmed.0040020
46. KivimakiM
ShipleyMJ
FerrieJE
Singh-ManouxA
BattyGD
2008 Best-practice interventions to reduce socioeconomic inequalities of coronary heart disease mortality in UK: a prospective occupational cohort study. Lancet 372 1648 1654
47. KhangYH
LynchJW
YangS
HarperS
YunSC
2009 The contribution of material, psychosocial, and behavioral factors in explaining educational and occupational mortality inequalities in a nationally representative sample of South Koreans: relative and absolute perspectives. Soc Sci Med 68 858 866
48. KhangYH
LynchJW
Jung-ChoiK
ChoHJ
2008 Explaining age-specific inequalities in mortality from all causes, cardiovascular disease and ischaemic heart disease among South Korean male public servants: relative and absolute perspectives. Heart 94 75 82
49. SalomonJA
NordhagenS
OzaS
MurrayCJ
2009 Are Americans feeling less healthy? The puzzle of trends in self-rated health. Am J Epidemiol 170 343 351
50. DiazVA
MainousAGIII
KoopmanRJ
CarekPJ
GeeseyME
2005 Race and diet in the overweight: association with cardiovascular risk in a nationally representative sample. Nutrition 21 718 725
51. Cabe-SellersBJ
BowmanS
StuffJE
ChampagneCM
SimpsonPM
2007 Assessment of the diet quality of US adults in the Lower Mississippi Delta. Am J Clin Nutr 86 697 706
52. PopkinBM
Siega-RizAM
HainesPS
1996 A comparison of dietary trends among racial and socioeconomic groups in the United States. N Engl J Med 335 716 720
53. CorraoG
BagnardiV
ZambonA
La VecchiaC
2004 A meta-analysis of alcohol consumption and the risk of 15 diseases. Prev Med 38 613 619
54. FranziniL
RibbleJC
KeddieAM
2001 Understanding the Hispanic paradox. Ethn Dis 11 496 518
55. SmithDP
BradshawBS
2006 Rethinking the Hispanic paradox: death rates and life expectancy for US non-Hispanic White and Hispanic populations. Am J Public Health 96 1686 1692
56. MichaudCM
McKennaMT
BeggS
TomijimaN
MajmudarM
2006 The burden of disease and injury in the United States 1996. Popul Health Metr 4 : 11. 11
57. WHO Committee on the Social Determinants of Health (2008) Closing the gap in a generation: health equity through action on the social determinants of health. Final Report of the Commission on Social Determinants of Health. Geneva: WHO.Available: http://www.who.int/social_determinants/thecommission/finalreport/en/index.html. Accessed 9 Feb 2008
58. House of Commons Health Committee (2009) Health inequalities: third report of session 2008-2009, Volume 1. London: The Stationery Office Limited. Available: http://www.publications.parliament.uk/pa/cm200809/cmselect/cmhealth/286/286.pdf. Accessed 10 June 2009
59. DavisAM
VinciLM
OkwuosaTM
ChaseAR
HuangES
2007 Cardiovascular health disparities: a systematic review of health care interventions. Med Care Res Rev 64 29S 100S
60. PeekME
CargillA
HuangES
2007 Diabetes health disparities: a systematic review of health care interventions. Med Care Res Rev 64 101S 156S
61. KnowlerWC
FowlerSE
HammanRF
ChristophiCA
HoffmanHJ
2009 10-year follow-up of diabetes incidence and weight loss in the Diabetes Prevention Program Outcomes Study. Lancet 374 1677 1686
62. ElliottP
MarmotM
DyerA
JoossensJ
KestelootH
1989 The INTERSALT study: main results, conclusions and some implications. Clin Exp Hypertens A 11 1025 1034
63. LawMR
FrostCD
WaldNJ
1991 By how much does dietary salt reduction lower blood pressure? I–Analysis of observational data among populations. BMJ 302 811 815
64. AsariaP
ChisholmD
MathersC
EzzatiM
BeagleholeR
2007 Chronic disease prevention: health effects and financial costs of strategies to reduce salt intake and control tobacco use. Lancet 370 2044 2053
65. MurrayCJ
LauerJA
HutubessyRC
NiessenL
TomijimaN
2003 Effectiveness and costs of interventions to lower systolic blood pressure and cholesterol: a global and regional analysis on reduction of cardiovascular-disease risk. Lancet 361 717 725
66. ThomasS
FayterD
MissoK
OgilvieD
PetticrewM
2008 Population tobacco control interventions and their effects on social inequalities in smoking: systematic review. Tob Control 17 230 237
67. ChobanianAV
BakrisGL
BlackHR
CushmanWC
GreenLA
2003 The Seventh Report of the Joint National Committee on Prevention, Detection, Evaluation, and Treatment of High Blood Pressure: the JNC 7 report. JAMA 289 2560 2572
68. 2003 Report of the expert committee on the diagnosis and classification of diabetes mellitus. Diabetes Care 26 Suppl 1 S5 20
Štítky
Interní lékařstvíČlánek vyšel v časopise
PLOS Medicine
2010 Číslo 3
- Alternativní léčebné možnosti u hypercholesterolemie při intoleranci statinů
- Vliv kombinace nutraceutik na remodelaci levé komory srdeční u osob s metabolickým syndromem
- Nutraceutika a jejich ovlivnění mírného kardiometabolického rizika
- Princip účinku medu v léčbě chronických i infikovaných ran
- Superoxidovaný roztok a jeho využití v léčbě ran
Nejčtenější v tomto čísle
- BMI and Risk of Serious Upper Body Injury Following Motor Vehicle Crashes: Concordance of Real-World and Computer-Simulated Observations
- Unravelling the Genetics of Ischaemic Stroke
- Providing Alcohol-Related Screening and Brief Interventions to Adolescents through Health Care Systems: Obstacles and Solutions
- Human Resource and Funding Constraints for Essential Surgery in District Hospitals in Africa: A Retrospective Cross-Sectional Survey