
Inequalities in Alcohol-Related Mortality in 17 European Countries: A Retrospective Analysis of Mortality Registers
In a harmonized analysis of regional data, Johan Mackenbach and colleagues characterize three decades of alcohol-related mortality across socioeconomic groups in Europe.
Published in the journal:
. PLoS Med 12(12): e32767. doi:10.1371/journal.pmed.1001909
Category:
Research Article
doi:
https://doi.org/10.1371/journal.pmed.1001909
Summary
In a harmonized analysis of regional data, Johan Mackenbach and colleagues characterize three decades of alcohol-related mortality across socioeconomic groups in Europe.
Introduction
Alcohol consumption, particularly in higher doses, is a risk factor for many fatal and nonfatal health problems. Acute intoxication is a risk factor for injuries, both accidental and non-accidental, and for cardiovascular disease, whereas chronic heavy drinking is a risk factor for liver cirrhosis, various forms of cancer, and cardiovascular disease [1,2].
Liver cirrhosis mortality is high in Europe, particularly in Central and Eastern European countries [3]. Mortality from liver cirrhosis used to be high in Southern Europe, too, but since the 1970s and 1980s it has declined substantially in France, Italy, Spain, Greece, and other Mediterranean countries. By contrast, mortality from liver cirrhosis has increased in Central and Eastern Europe, in Finland, and in the United Kingdom [3–6].
Patterns and trends of mortality from other alcohol-related conditions have been studied less often. Within Europe, mortality from alcoholic psychosis, alcohol poisoning, and alcohol dependence appears to have a geographical pattern different from that of mortality from liver cirrhosis, with relatively high rates of the former in the Nordic countries [7,8]. This has been attributed to the culture of binge drinking, characterized by non-daily drinking and frequent intoxication, in Northern Europe, which is also common in Eastern Europe [9]. Mortality from these conditions has been rising in many European countries [8].
Like many other health-related behaviors, alcohol consumption is strongly patterned by socioeconomic status, as indicated by level of education, occupational class, and income. In many European countries, the frequency of drinking and sometimes also the levels of consumption are higher in higher socioeconomic groups, whereas problematic forms of consumption, like binge drinking, and alcohol-related health and social problems, are more frequent in lower socioeconomic groups [7,10].
Recent literature reviews have shown that mortality from alcohol-related conditions is higher in lower socioeconomic groups in most of the available studies [11,12], including studies from Finland [13], Sweden [14,15], the United Kingdom [16,17], and Estonia [18]. Comparative studies are, however, lacking, and it is therefore unknown whether there are important differences between countries in the magnitude of socioeconomic inequalities in alcohol-related mortality. Investigating whether there are differences is important because such differences might provide useful insights into the explanation of these inequalities, and into the potential for reducing them.
Studies of trends in inequalities in alcohol-related mortality are even scarcer. Finland is the only country in which detailed studies have been conducted. Over the past decades, the absolute inequality in alcohol-related mortality has strongly increased in Finland [19], which has contributed importantly to a rising inequality in total mortality and life expectancy [20,21]. These changes have been partly fueled by changes in the affordability of alcohol [22,23]. In Finland, the rise of inequality in alcohol-related mortality has partly undone the effect of declining inequality in smoking-related mortality, suggesting that one risk factor has been replaced by another [21]. Studies from other countries are very scarce [18,24], and it is therefore unknown whether the Finnish experience can be generalized to other countries.
To fill these gaps, we set out to study whether European countries differ in the magnitude of socioeconomic inequality in alcohol-related mortality, and what the trends of this inequality over the past decades have been. More specifically, we studied inequality in alcohol-related mortality by education level and occupational class in all European countries with available data, and assessed whether its magnitude and contribution to inequality in total mortality vary between countries and have changed over time.
Methods
Data
We extracted data from national or regional mortality registers in which deaths and population numbers were classified by socioeconomic position, such as the national longitudinal mortality registers in Finland, Sweden, Norway, and Denmark; the Office for National Statistics Longitudinal Mortality Study in England and Wales, and the Echantillon Démographique Permanent created by the National Institute of Statistics and Economic Studies (INSEE) in France. We included all European countries for which data on cause-specific mortality covering complete national or regional populations were available that allowed a distinction by the most commonly used indicator of socioeconomic position, level of education (see below). Unfortunately, not all European countries have data collection systems in place from which such data could be extracted (e.g., because of privacy restrictions or lack of information on education level in their population census), but our study includes 17 countries that together represent all parts of the European subcontinent. Table 1 gives an overview of the main characteristics of our data sources; S1–S3 Tables provide additional detail. To facilitate inspection of tables and graphs, we have grouped populations into four geographical regions (Northern Europe, Western Europe, Southern Europe, and Eastern Europe).

Most data stemmed from longitudinal mortality follow-up after censuses in which socioeconomic information of the population at risk and of the deceased had been recorded; some countries had only unlinked cross-sectional data in which socioeconomic information on the population at risk came from the census, and socioeconomic information on the deceased came from the death certificate. In most countries linkage between the population and death registries was more than 95% complete; for Spain, where linkage failure exceeded 5%, mortality rates were multiplied by the inverse of the proportion of deaths that were successfully linked in order to adjust for the linkage failure. Data for Spain and Italy came from regional populations, but previous studies have shown that patterns observed in these regional populations correspond well to those seen at the national level [25–27]. The UK is represented by two regional populations: (1) England and Wales and (2) Scotland.
We used two indicators of socioeconomic position: level of education and occupational class. For education level, we used the International Standard Classification of Education 1997, and considered categories 0–2 (pre-primary, primary, and lower secondary education) as “low,” categories 3–4 (upper secondary and post-secondary non-tertiary education) as “middle,” and categories 5–6 (first and second stage of tertiary education) as “high” [28]. For occupational class, we used the Erikson-Goldthorpe-Portocarero scheme of occupational classes, and distinguished non-manual workers, manual workers, farmers, and self-employed workers [29]. Farmers and self-employed workers are heterogeneous groups in terms of their socioeconomic position (e.g., because some farmers and self-employed workers have employees working for them while others lead a precarious existence), which is also reflected in highly variable mortality rates in different European countries [30]. Therefore, we report on differences in mortality between manual and non-manual workers only. Because occupational class was not available for all populations, and information on occupational class is less reliable among women, we present results on mortality by occupational class (men only) in S5–S7 Tables rather than in the main analysis. Persons with missing education level or occupational class were excluded from the analysis. The proportion of the population aged 35–79 y with unknown education level varied between 0% and 11%; the percentage of the male population aged 35–64 y with unknown occupational class varied between 3% and 36% (S1–S3 Tables).
For our outcome variable, mortality due to alcohol-related causes, we selected four underlying causes of death: alcoholic psychosis, dependence, and abuse; alcoholic cardiomyopathy; alcoholic liver cirrhosis; and accidental poisoning by alcohol. In the most recent time period, most countries used ICD-10 (International Classification of Diseases–Tenth Revision) for classifying causes of death. ICD codes for alcohol-related conditions in ICD-10 and previous editions are given in S4 Table. All countries were able to provide data on all four alcohol-related causes in the most recent time period, but some were not able to for earlier periods in time.
Analysis
Our analysis consisted of two parts: (1) a cross-population comparison of inequality in alcohol-related mortality for the most recent time period for which data were available in these populations and (2) a cross-population comparison of trends in the inequality in alcohol-related mortality over time. Mortality rates by education level and occupational class were age-standardized using the European Standard Population [31]. Because education level gradually loses its discriminatory power at higher ages, and because registration of causes of death becomes increasingly unreliable at higher ages, all analyses for education level are restricted to the age-range 35–79 y (for exceptions, see Table 1). Because registration of (former) occupation was incomplete for retired individuals, analyses for occupational class were restricted to the age range 35–64 y. All analyses were stratified by sex, because alcohol consumption patterns and inequality in these patterns are known to differ between men and women [32].
We systematically studied the magnitude of both relative and absolute inequalities because both are important [33,34], and we operationalized inequalities in terms of both a ratio and a difference measure of the excess mortality in lower as compared to higher socioeconomic groups. All measures were adjusted for age. For education level, we used the relative index of inequality (RII) and the slope index of inequality (SII) [35,36]. Both measures take into account all education groups (i.e., not just the lowest and highest groups) and derive from a linear regression analysis of mortality on education level. The RII was calculated using Poisson regression with the observed number of deaths as the dependent variable, person-years of population as the offset variable, and educational rank and dummy variables for age (in 5-y age groups) as independent variables. Educational rank was calculated for each education level (by population, sex, and time period) as the mean proportion of the population having a higher level of education. The RII is the ratio between mortality at rank 1 (the lowest education level) and rank 0 (the highest education level), and can thus be interpreted as the rate ratio of mortality between those with the very lowest and those with the very highest educational position in the population [35]. The SII represents the absolute version of the RII and was calculated as follows:

Results
Inequality in Alcohol-Related Mortality in the Most Recent Time Period
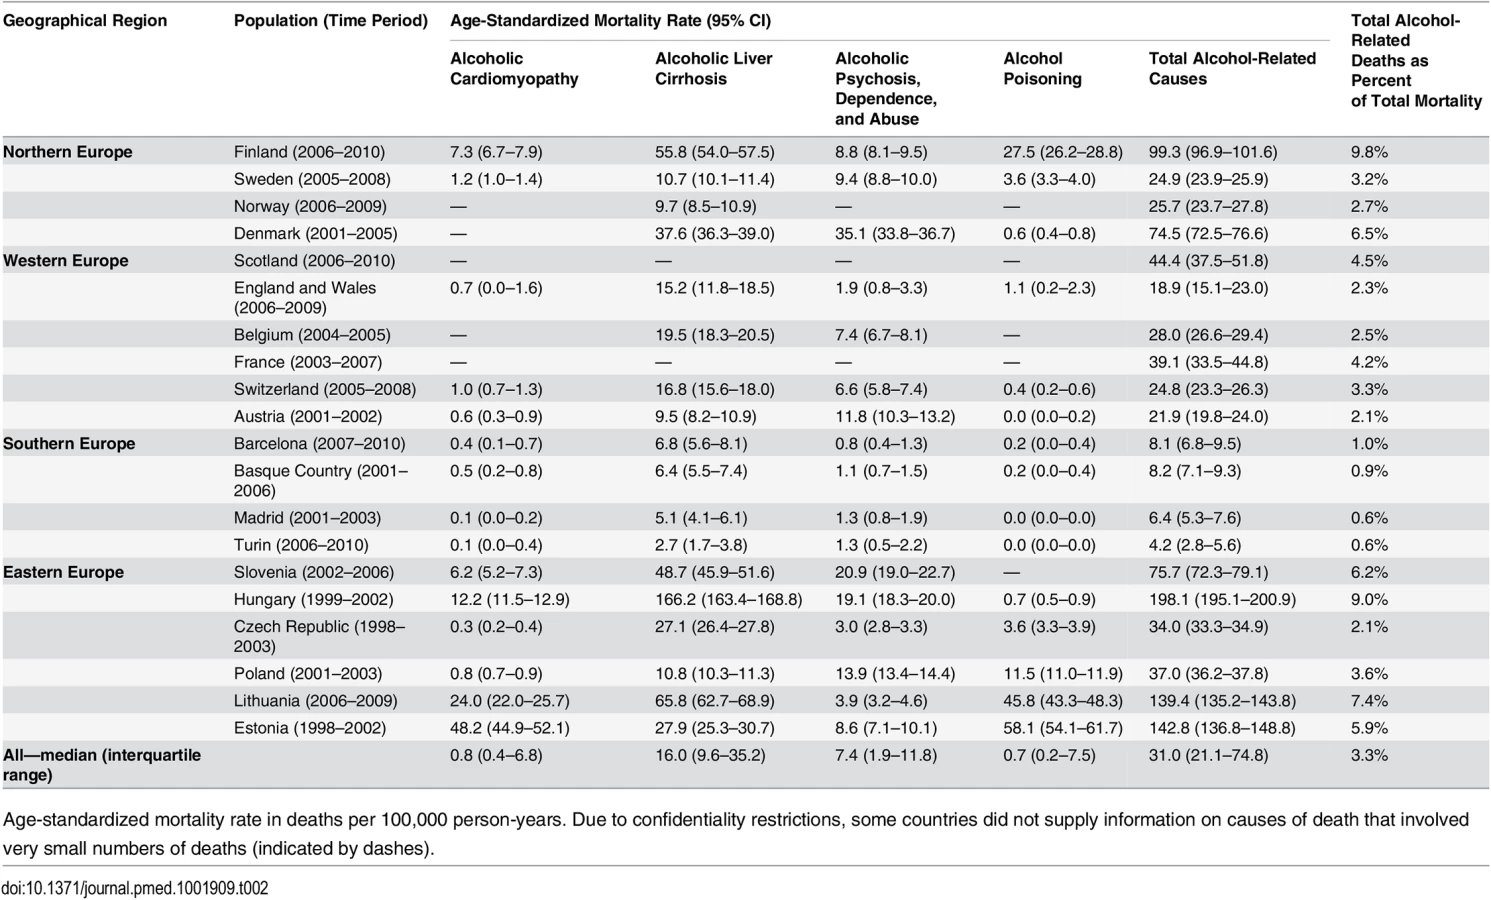
Levels of mortality from alcohol-related causes among men and women in the latest available time period are presented in Tables 2 and 3, respectively. Mortality from all alcohol-related causes together was highest in Hungary, both among men and women, with age-standardized mortality rates of 198.1 (95% CI 195.1–200.9) and 51.4 (95% CI 50.0–52.7) deaths per 100,000 person-years, respectively, mainly due to extremely high mortality from alcoholic liver cirrhosis. Alcoholic psychosis, dependence, and abuse mortality was highest in Denmark, and alcohol poisoning mortality was highest in Estonia.

Educational inequality in mortality from alcohol-related causes was found in all populations, with mortality being higher among individuals in the middle education group than in the high education group, and among individuals in the low education group than in the middle education group, almost without exception (Figs 1 and 2). However, it can immediately be seen that the absolute gap in death rates between the low and the high education groups varied substantially between populations, being very small in the four populations in Southern Europe and very large in most countries in Eastern Europe. The gap in death rates between the low and high education groups was also relatively large in Finland and Denmark. Remarkably, alcohol-related mortality among individuals with a high level of education was also highly variable between populations.


Table 4 shows relative and absolute educational inequalities in mortality from alcohol-related causes in the most recent observed period. The RII almost always exceeded 1.00, indicating higher mortality among lower educated individuals. For example, among Finnish men the RII was 3.6 (95% CI 3.3–4.0) and the SII was 112.5 (95% CI 106.2–118.8) deaths per 100,000 person-years. As can be seen in Figs 1 and 2, the absolute inequality as measured by the SII was largest in Hungary, both among men and among women, with the two Baltic countries coming second and third. The absolute inequality in alcohol-related mortality was also very large in Slovenia, Finland, and Denmark.

Table 4 also shows the contribution of alcohol-related mortality to inequalities in total mortality. That contribution was equal to or higher than 10% in Finland, Denmark (men only), Slovenia, and Hungary. Data on occupational class inequalities in alcohol-related mortality among men were available for 11 out of 17 countries, and show a pattern of consistently higher mortality among manual than non-manual workers. The contribution of alcohol-related mortality to occupational class inequalities in total mortality was often even larger than that seen for educational inequalities in total mortality, due to the restriction to a younger age group (S5 Table).
Trends in Inequality in Alcohol-Related Mortality
Trends in inequality in alcohol-related mortality over time are illustrated in Tables 5–8. Relative inequality in alcohol-related mortality, as measured by the RII, has gone up in some populations, including Finland and Norway. The main change in inequality, however, is a strong rise in absolute inequality, as measured by the SII, in several countries in Eastern Europe (Hungary, Lithuania, and Estonia) and Northern Europe (Finland and Denmark). For example, among Finnish men the RII increased from 2.7 (95% CI 2.2–3.2) in 1980–1984 to 3.6 (95% CI 3.3–4.0) in 2005–2009, and over the same period the SII increased from 46.4 (95% CI 39.1–54.2) to 112.5 (95% CI 106.2–118.8). On the other hand, the absolute inequality in alcohol-related mortality has been stable in several other populations and has been declining among men in France.


S6 and S7 Tables show trends in relative and absolute inequality in alcohol-related mortality by occupational class. Here again, we observe a strong rise of absolute inequality among men in several countries/regions, including Finland, England and Wales, and Lithuania.
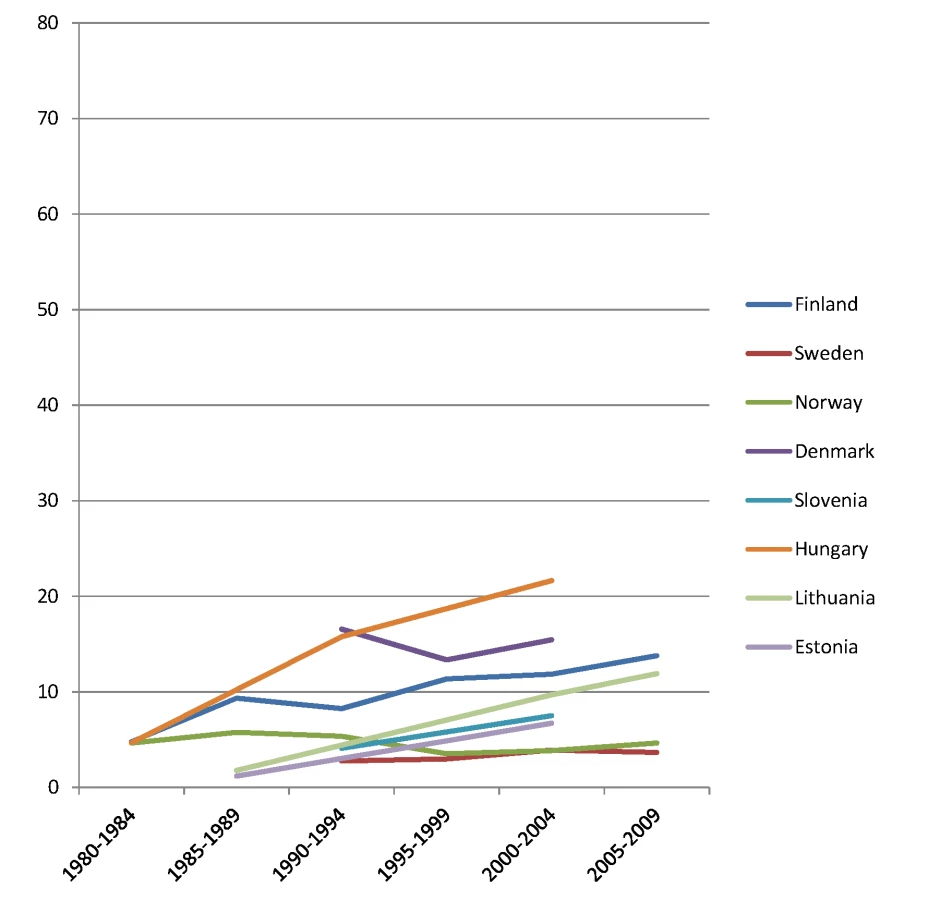
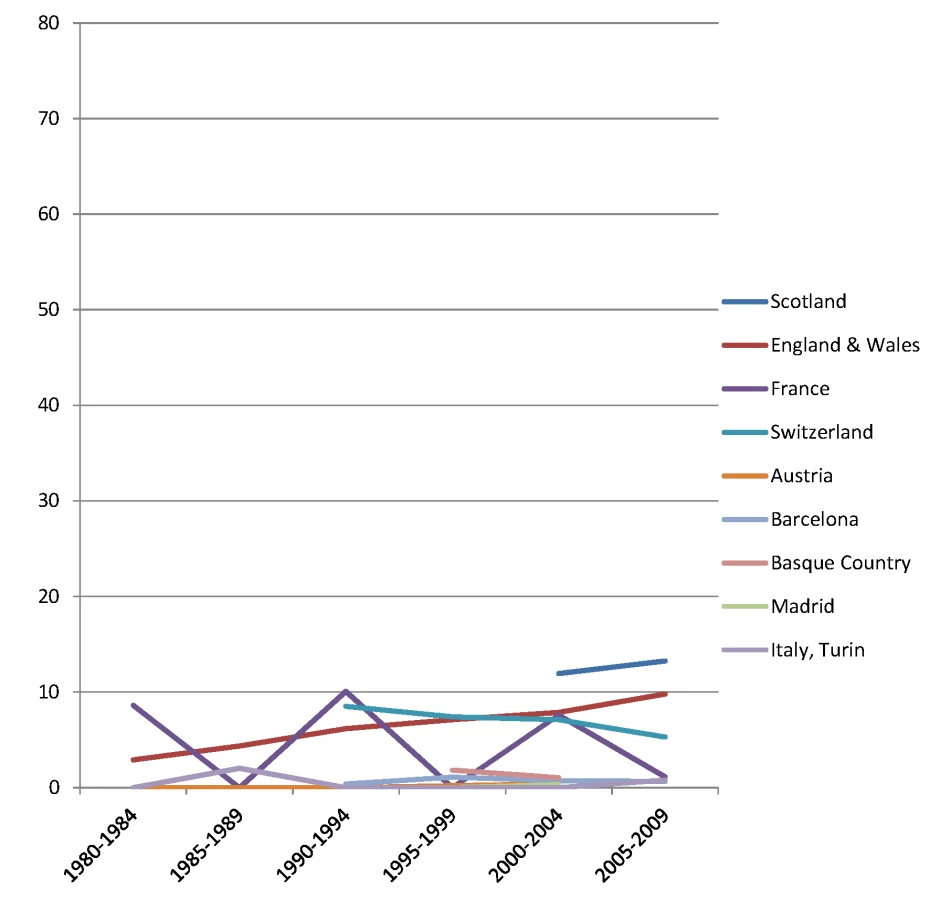
The rise of absolute inequality in alcohol-related mortality in several populations was due to a remarkable increase in mortality from alcohol-related conditions among lower educated individuals, with stable or only moderately increasing mortality among higher educated individuals, as shown in Figs 3–6. However, trends are far from uniform. For example, while mortality among men in the low education group has risen enormously in Finland and Denmark, it has been relatively stable in Sweden and Norway. The stability, or even tendency towards decline, of mortality from alcohol-related causes among lower educated men in France, Switzerland, Spain, and Italy is also noteworthy.
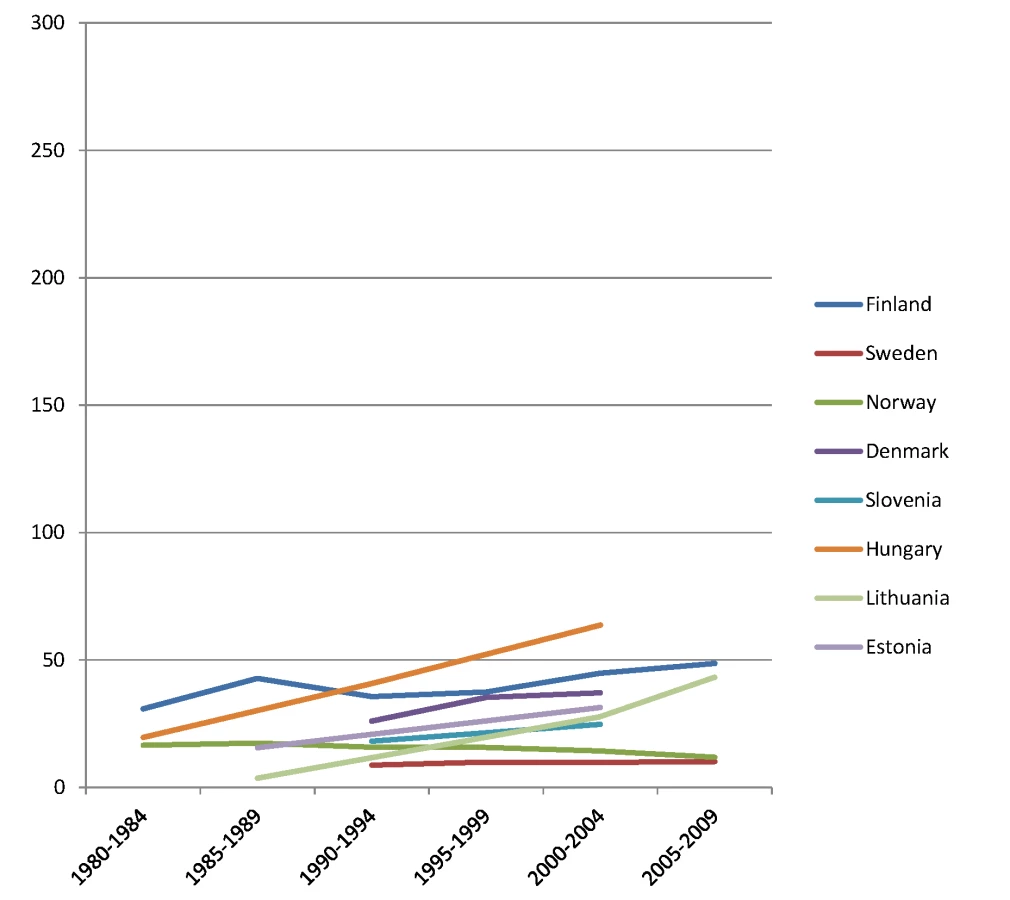


Similar results are seen for women (Figs 7–10) and for men by occupational class (S1 and S2 Figs).


Discussion
Summary of Main Findings
Rates of alcohol-related mortality are higher in lower socioeconomic groups (as measured by education level and occupational class) in all countries. Both relative and absolute inequalities are largest in Eastern Europe, and Finland and Denmark also have very large absolute inequalities in alcohol-related mortality. Over time, the relative inequality in alcohol-related mortality has increased in many countries, but the main change is a strong rise in the absolute inequality in several countries in Eastern Europe (Hungary, Lithuania, and Estonia) and Northern Europe (Finland and Denmark) due to a rapid rise in alcohol-related mortality in lower socioeconomic groups. In some of these countries alcohol-related causes now account for 10% or more of the inequality in total mortality in the age group 35–79 y.
Strengths and Limitations
This study is unique in its population-wide coverage of a wide range of European countries and a long period of time, using two indicators of socioeconomic position: education level and occupational class. The main limitation is that we had to rely on routinely registered data, and that cause-of-death data are a far from perfect source of information on alcohol-related mortality.
It has been suggested that differences between European countries in the level of mortality from alcohol-related conditions are likely to be at least partly due to different recording practices [8]. Between-country differences in mortality levels as observed in the present study—which also strongly influence the absolute inequality in mortality from alcohol-related conditions—should therefore be regarded with caution. For example, the quality and coverage of alcohol-related cause-of-death data have been characterized as particularly good in Finland [19], which may partly be due to better recognition of alcohol-related conditions or a relative absence of social stigma associated with alcohol abuse in this country. By contrast, recording whether excessive alcohol consumption is the cause of liver cirrhosis may be far from complete in other countries [39,40].
Although under-recording is probably the most prevalent source of bias, over-recording has been reported in Hungary, where liver cirrhosis was often assigned as a cause of death in cases of diagnostic uncertainty [41]. To redress this problem, a change in coding rules was implemented in 1996. From our experience working with cause-of-death statistics in Hungary (K. K.), this resulted in a substantial drop in mortality from alcoholic liver cirrhosis. This implies that the mortality rate from alcohol-related causes in Hungary in the early 1980s and early 1990s, as presented in Tables 2 and 3 and Figs 3, 4, 7 and 8, was overestimated, and that the real increase was even larger than suggested by our data.
Over - and under-recording may also differ between socioeconomic groups or change over time. For example, the lower mortality rate from alcohol-related causes among those with higher socioeconomic position could be partly due to social stigma, and to medical doctors being more hesitant to attach social stigma to people of social standing similar to their own [13]. Yet, it is likely that the risk of bias is less for between-country comparisons of the relative inequality in alcohol-related mortality, and for within-country comparisons of relative and absolute inequality over time, than for between-country comparisons of the absolute inequality in alcohol-related mortality.
The second limitation with the cause-of-death data is that we have studied directly alcohol-attributable causes of death only, and these cover only a part of all alcohol-attributable deaths. The Global Burden of Disease study estimated that alcohol accounts for around 11% of deaths among men in European populations, many of which are from cardiovascular disease and cancer [42]. In our data the alcohol-related causes generally account for a few percentage points only, partly because we have not taken into account such more indirect effects (Tables 2 and 3). In Finnish studies, this problem has to some extent been reduced by using data on contributory causes of death [13,19], but in international comparisons these data are not available and, even if they were, may present even greater problems of comparability.
Another limitation is that although we used the most recent data available when we undertook this study (2012–2014), some of the data are already quite old, particularly in Eastern Europe. Also, whereas data on level of education were relatively complete, data on occupational class were more often missing, particularly in Lithuania (36% missing) and Estonia (35% missing) (S2 Table). Despite the greater risk of bias that this creates, the fact that occupational class data produce findings similar to those of educational data increases confidence in our findings.
Interpretation
Excessive alcohol consumption is one of the greatest challenges for public health in Europe—in no other world region is the alcohol-attributable burden of disease higher than in Europe [43]. As our study shows, alcohol-related health problems have also become an important driver of socioeconomic inequality in mortality in many parts of the region, particularly in Eastern Europe and in the Nordic countries. Our previous study of cause-specific inequality in mortality in Europe in the 1990s already pointed in this direction [37], but our present study shows that this is also a rapidly growing problem.
The omnipresence of socioeconomic inequality in alcohol-related mortality in Europe suggests that it is linked to structural characteristics of societies, but its specific explanation is likely to be complex. First, it is important to recognize that part of the association may be due to selection factors: alcohol-related physical, mental, and social problems may lead to a lower socioeconomic position, although this is likely to affect income more than education level and occupational class [13]. Furthermore, certain personality traits or psychological problems in childhood and adolescence may predispose both to a higher risk of problematic drinking and to lower educational level [13,14].
It is highly plausible, however, that the association between low socioeconomic status and alcohol-related health problems also partly reflects an indirect causal effect of low socioeconomic position on the risk of dying from alcohol-related conditions, both through a higher prevalence of harmful consumption levels or patterns and through a higher vulnerability to the effects of alcohol. The first may be due to a higher exposure to material and psychosocial stressors, with alcohol being used for tension reduction [44,45]. It has also been suggested that individuals from lower socioeconomic groups, for example, in Hungary [46] and other Eastern European countries, are more exposed to lower quality alcoholic drinks, such as home-brewed and non-beverage alcohol, that may contain toxic compounds [47–49].
A higher vulnerability to the effects of alcohol in individuals from lower socioeconomic groups is suggested by a Finnish longitudinal study, which found that, with consumption level and drinking patterns controlled, alcohol-related hospitalizations and mortality were much more frequent in lower socioeconomic groups [50], perhaps because of an interaction with dietary habits, safety of the drinking environment, or support from work and family to address emerging alcohol problems.
We found that the inequality in alcohol-related mortality is much larger in some populations in Northern and Eastern Europe than it is in Western and Southern Europe. Part of the explanation for this may lie in different drinking cultures [51]. Binge drinking is common in Northern and Eastern Europe, and strongly socially stratified, whereas in Southern Europe, a Mediterranean style of drinking—characterized by almost daily drinking of alcohol, mostly in the form of wine with meals, and less acceptance of public drunkenness—still predominates, particularly in older generations, including lower socioeconomic groups [4,32]. Nevertheless, daily drinking of moderate amounts of alcohol does increase the risk of cirrhosis [52] and may be the main factor behind the inequality in alcohol-related mortality in Southern Europe, which is indeed dominated by cirrhosis mortality (Tables 2 and 3). We also found remarkable differences between men and women: whereas the relative inequality in alcohol-related mortality is sometimes larger among women than among men, the absolute inequality is almost always larger among men (Table 4).
Inequalities in alcohol-related mortality have been very dynamic, as shown by this study, which at the very least suggests that they are not immutable. To what extent do changes in the inequality in alcohol-related mortality reflect policy impacts? Trends in alcohol control policies in Western Europe were analyzed in the European Comparative Alcohol Study [53]. Between 1950 and 2000, alcohol control became less strict in Northern Europe—partly as a result of harmonization of national laws and regulations after joining the European Union—but more strict in Southern Europe, including France. Although this may help to explain the relatively favorable trends in countries like France, Spain, and Italy, as has been reported before [54–56], it does not explain our findings for the Nordic countries. Loosening of alcohol control policies coincided with a rise in mortality from alcohol-related causes among lower educated men in Finland, but not in Sweden or Norway, whereas the rise in mortality from alcohol-related causes among lower educated men in Denmark coincided with a slight tightening of alcohol control policies (Figs 3, 4, 7, and 8) [57].
The increasing affordability of alcohol, due to a combination of rising incomes and stable or sometimes even declining price levels of alcoholic drinks, may also have played a role in the rise of alcohol-related mortality seen in many European countries. Because lower socioeconomic groups are likely to be more responsive to price changes (as shown, for example, in the case of tobacco [58]), the increased affordability of alcohol may have led to relatively larger increases in consumption in lower socioeconomic groups. Between 1996 and 2004, the affordability of alcohol has increased strongly in many European countries, including Lithuania, the United Kingdom, and Finland [59]. Finnish studies have shown that the impact of these changes has been largest in the lowest socioeconomic groups [19,22,23]. Our data suggest that the inequality in alcohol-related mortality has indeed increased most in countries, such as Lithuania and Finland, in which affordability has increased most (Figs 11 and 12).


Trends in alcohol policy in Eastern Europe since 1990 have not been systematically characterized [57]. In many of these countries, excessive alcohol consumption surged around 1990, when cheap alcohol flooded the market [60]. The strong increases of alcohol-related mortality seen in these countries are also likely to be a reflection of the economic crisis following the collapse of the Soviet Union and the resulting stress in the population, and of the extreme liberalization of alcohol markets with a breakdown of control measures in the chaotic first years after the political changes [61–64]. More recently, rising income and increased affordability of alcohol may also have played a role [65].
What can be done to reduce inequalities in alcohol-related mortality? The WHO Commission on Social Determinants of Health has emphasized the importance of tackling the underlying, or “upstream,” causes of inequalities in health, that is, the unequal distribution of socioeconomic resources in society [66]. Some argue that if one focuses efforts to tackle health inequalities on “downstream” causes instead, such as health-related behaviors, the “gap” left by one downstream cause will soon be filled by another, and health inequalities will persist with little change [67]. Although there is some evidence for the exchangeability of downstream causes, such as between smoking and alcohol [21], our between-country comparison shows that it is possible to have small inequalities in alcohol-related mortality with large inequalities in socioeconomic resources, as in Southern Europe, as well as the reverse, as in Northern Europe.
This implies that policies and interventions redressing the higher prevalence of harmful alcohol consumption patterns in lower socioeconomic groups could help to reduce inequalities in mortality, even without tackling the “upstream” causes of health inequalities. The evidence base shows that a range of alcohol control measures are cost-effective [68]. Although little is known about differential effectiveness by socioeconomic position [69], an informed guess is that a combination of different approaches will be necessary. Making alcohol more expensive has been shown to be the most cost-effective way to reduce alcohol-related harm, and will probably also work to reduce the inequality in alcohol-related mortality. Whatever the policies and interventions chosen, however, they should take into account cultural preferences regarding drinking and should include measures to control illegal trade and production.
Conclusions
Alcohol-related conditions play an important role in generating socioeconomic inequality in total mortality in many European countries. Countering increases in alcohol-related mortality in lower socioeconomic groups is essential for reducing inequalities in mortality. Studies of why such increases have not occurred in some countries, such as France, Switzerland, Spain, and Italy, can help in developing evidence-based policies in other European countries.
Supporting Information
Zdroje
1. Rehm J (2010) The risks associated with alcohol use and alcoholism. Alcohol Res Health 34 : 135–143.
2. Rehm J, Baliunas D, Borges GL, Graham K, Irving H, et al. (2010) The relation between different dimensions of alcohol consumption and burden of disease: an overview. Addiction 105 : 817–843. doi: 10.1111/j.1360-0443.2010.02899.x 20331573
3. Bosetti C, Levi F, Lucchini F, Zatonski WA, Negri E, et al. (2007) Worldwide mortality from cirrhosis: an update to 2002. J Hepatol 46 : 827–839. 17336419
4. Zatonski WA, Sulkowska U, Manczuk M, Rehm J, Boffetta P, et al. (2010) Liver cirrhosis mortality in Europe, with special attention to Central and Eastern Europe. Eur Addict Res 16 : 193–201. doi: 10.1159/000317248 20606444
5. Leon DA, McCambridge J (2006) Liver cirrhosis mortality rates in Britain from 1950 to 2002: an analysis of routine data. Lancet 367 : 52–56. 16399153
6. Munoz-Prez F, Nizard A (1999) Alcohol consumption and cirrhosis mortality in the industrialised countries since 1950. Eur J Popul 14 : 367–386.
7. Bloomfield K, Grittner U, Kramer S, Gmel G (2006) Social inequalities in alcohol consumption and alcohol-related problems in the study countries of the EU concerted action ‘Gender, Culture and Alcohol Problems: a Multi-national Study’. Alcohol Alcohol Suppl 41: i26–i36. 17030500
8. Ramstedt M (2002) Alcohol-related mortality in 15 European countries in the postwar period. In: Norstrom T, editor. Alcohol in postwar Europe: consumption, drinking patterns, consequences and policy responses in 15 European countries. Stockholm: National Institute of Public Health.
9. Stickley A, Leinsalu M, Andreev E, Razvodovsky Y, Vagero D, et al. (2007) Alcohol poisoning in Russia and the countries in the European part of the former Soviet Union, 1970 2002. Eur J Public Health 17 : 444–449. 17327281
10. Kuntsche E, Rehm J, Gmel G (2004) Characteristics of binge drinkers in Europe. Soc Sci Med 59 : 113–127. 15087148
11. Probst C, Roerecke M, Behrendt S, Rehm J (2014) Gender differences in socioeconomic inequality of alcohol-attributable mortality: A systematic review and meta-analysis. Drug Alcohol Rev 34 : 267–277. doi: 10.1111/dar.12184 25109218
12. Probst C, Roerecke M, Behrendt S, Rehm J (2014) Socioeconomic differences in alcohol-attributable mortality compared with all-cause mortality: a systematic review and meta-analysis. Int J Epidemiol 43 : 1314–1327. doi: 10.1093/ije/dyu043 24618188
13. Mäkelä P (1999) Alcohol-related mortality as a function of socio-economic status. Addiction 94 : 867–886. 10665076
14. Hemström O (2002) Alcohol-related deaths contribute to socioeconomic differentials in mortality in Sweden. Eur J Public Health 12 : 254–262. 12506500
15. Norström T, Romelsjo A (1998) Social class, drinking and alcohol-related mortality. J Subst Abuse 10 : 385–395. 10897291
16. Metcalfe C, Davey Smith G, Sterne JA, Heslop P, Macleod J, et al. (2005) Cause-specific hospital admission and mortality among working men: association with socioeconomic circumstances in childhood and adult life, and the mediating role of daily stress. Eur J Public Health 15 : 238–244. 15923212
17. Harrison L, Gardiner E (1999) Do the rich really die young? Alcohol-related mortality and social class in Great Britain, 1988–94. Addiction 94 : 1871–1880. 10717965
18. Leinsalu M, Vågerö D, Kunst AE (2003) Estonia 1989–2000: enormous increase in mortality differences by education. Int J Epidemiol 32 : 1081–1087. 14681279
19. Herttua K, Mäkelä P, Martikainen P (2007) Differential trends in alcohol-related mortality: a register-based follow-up study in Finland in 1987–2003. Alcohol Alcohol 42 : 456–464. 17277324
20. Martikainen P, Valkonen T, Martelin T (2001) Change in male and female life expectancy by social class: decomposition by age and cause of death in Finland 1971–95. J Epidemiol Community Health 55 : 494–499. 11413179
21. Martikainen P, Mäkelä P, Peltonen R, Myrskyla M (2014) Income differences in life expectancy: the changing contribution of harmful consumption of alcohol and smoking. Epidemiology 25 : 182–190. doi: 10.1097/EDE.0000000000000064 24487202
22. Herttua K, Mäkelä P, Martikainen P (2008) Changes in alcohol-related mortality and its socioeconomic differences after a large reduction in alcohol prices: a natural experiment based on register data. Am J Epidemiol 168 : 1110–1118. doi: 10.1093/aje/kwn216 18718894
23. Herttua K, Mäkelä P, Martikainen P (2013) Minimum prices of alcohol and educational disparities in alcohol-related mortality: a time-series analysis [abstract]. 6th European Public Health Conference; 13–16 Nov 2013; Brussels, Belgium.
24. Najman JM, Williams GM, Room R (2007) Increasing socioeconomic inequalities in male cirrhosis of the liver mortality: Australia 1981–2002. Drug Alcohol Rev 26 : 273–278. 17454016
25. Federico B, Mackenbach JP, Eikemo TA, Sebastiani G, Marinacci C, et al. (2013) Educational inequalities in mortality in northern, mid and southern Italy and the contribution of smoking. J Epidemiol Community Health 67 : 603–609. doi: 10.1136/jech-2012-201716 23596251
26. Marinacci C, Grippo F, Pappagallo M, Sebastiani G, Demaria M, et al. (2013) Social inequalities in total and cause-specific mortality of a sample of the Italian population, from 1999 to 2007. Eur J Public Health 23 : 582–587. doi: 10.1093/eurpub/cks184 23302766
27. Regidor E, Kunst AE, Rodriguez-Artalejo F, Mackenbach JP (2012) Small socio-economic differences in mortality in Spanish older people. Eur J Public Health 22 : 80–85. doi: 10.1093/eurpub/ckr051 21531772
28. United Nations Educational, Scientific and Cultural Organization (1997) International Standard Classification of Education–ISCED 1997. Paris: United Nations Educational, Scientific and Cultural Organization.
29. Erikson E, Goldthorpe JH (1992) The constant flux. Oxford: Clarendon Press.
30. Kunst AE, Groenhof F, Mackenbach JP (1998) Mortality by occupational class among men 30–64 years in 11 European countries. EU Working Group on Socioeconomic Inequalities in Health. Soc Sci Med 46 : 1459–1476. 9665576
31. Ahmad O, Boschi-Pinto C, Lopez A, Murray C, Lozano R, et al. (2001) Age standardization of rates: a new WHO standard. GPE Discussion Paper Series No. 31. Geneva: World Health Organization.
32. Mäkelä P, Gmel G, Grittner U, Kuendig H, Kuntsche S, et al. (2006) Drinking patterns and their gender differences in Europe. Alcohol Alcohol Suppl 41: i8–i18. 17030504
33. Harper S, King NB, Meersman SC, Reichman ME, Breen N, et al. (2010) Implicit value judgments in the measurement of health inequalities. Milbank Q 88 : 4–29. doi: 10.1111/j.1468-0009.2010.00587.x 20377756
34. Mackenbach JP (2015) Should we aim to reduce relative or absolute inequalities in mortality? Eur J Public Health 25 : 185. doi: 10.1093/eurpub/cku217 25818489
35. Mackenbach JP, Kunst AE (1997) Measuring the magnitude of socio-economic inequalities in health: an overview of available measures illustrated with two examples from Europe. Soc Sci Med 44 : 757–771. 9080560
36. Regidor E (2004) Measures of health inequalities: part 2. J Epidemiol Community Health 58 : 900–903. 15483304
37. Mackenbach JP, Stirbu I, Roskam AJ, Schaap MM, Menvielle G, et al. (2008) Socioeconomic inequalities in health in 22 European countries. N Engl J Med 358 : 2468–2481. doi: 10.1056/NEJMsa0707519 18525043
38. Sergeant JC, Firth D (2006) Relative index of inequality: definition, estimation, and inference. Biostatistics 7 : 213–224. 16192414
39. Bell G, Cremona A (1987) Alcohol and death certification: a survey of current practice and attitudes. Br Med J (Clin Res Ed) 295 : 95.
40. Ramstedt M (2003) Alcohol consumption and liver cirrhosis mortality with and without mention of alcohol—the case of Canada. Addiction 98 : 1267–1276. 12930214
41. Jozan P (1987) Some features of mortality in Hungary in the post-war period: the third stage of epidemiologic transition in promoting health in Hungary. Report of a group established by the Council of Ministers of the Hungarian People’s Republic. Budapest: Central Statistical Office.
42. Lim SS, Vos T, Flaxman AD, Danaei G, Shibuya K, et al. (2012) A comparative risk assessment of burden of disease and injury attributable to 67 risk factors and risk factor clusters in 21 regions, 1990–2010: a systematic analysis for the Global Burden of Disease Study 2010. Lancet 380 : 2224–2260. doi: 10.1016/S0140-6736(12)61766-8 23245609
43. Rehm J, Mathers C, Popova S, Thavorncharoensap M, Teerawattananon Y, et al. (2009) Global burden of disease and injury and economic cost attributable to alcohol use and alcohol-use disorders. Lancet 373 : 2223–2233. doi: 10.1016/S0140-6736(09)60746-7 19560604
44. Droomers M, Schrijvers C, Stronks K, van de Mheen D, Mackenbach JP (1999) Educational differences in excessive alcohol consumption: the role of psychosocial and material stressors. Prev Med 29 : 1–10. 10419792
45. de Goeij MC, Suhrcke M, Toffolutti V, van de Mheen D, Schoenmakers TM, et al. (2015) How economic crises affect alcohol consumption and alcohol-related health problems: a realist systematic review. Soc Sci Med 131 : 131–146. doi: 10.1016/j.socscimed.2015.02.025 25771482
46. Petrovski BE, Szeles G, Melles M, Pataki V, Kardos L, et al. (2011) Behaviour does not fully explain the high risk of chronic liver disease in less educated men in Hungary. Eur J Public Health 21 : 662–666. doi: 10.1093/eurpub/ckq079 20551046
47. Popova S, Rehm J, Patra J, Zatonski W (2007) Comparing alcohol consumption in central and eastern Europe to other European countries. Alcohol Alcohol 42 : 465–473. 17287207
48. Szucs S, Sarvary A, McKee M, Adany R (2005) Could the high level of cirrhosis in central and eastern Europe be due partly to the quality of alcohol consumed? An exploratory investigation. Addiction 100 : 536–542. 15784068
49. Lang K, Vali M, Szucs S, Adany R, McKee M (2006) The composition of surrogate and illegal alcohol products in Estonia. Alcohol Alcohol 41 : 446–450. 16687467
50. Mäkelä P, Paljärvi T (2008) Do consequences of a given pattern of drinking vary by socioeconomic status? A mortality and hospitalisation follow-up for alcohol-related causes of the Finnish Drinking Habits Surveys. J Epidemiol Community Health 62 : 728–733. doi: 10.1136/jech.2007.065672 18621959
51. World Health Organization. Global information system on alcohol and health. Geneva: World Health Organization.
52. Thun MJ, Peto R, Lopez AD, Monaco JH, Henley SJ, et al. (1997) Alcohol consumption and mortality among middle-aged and elderly U.S. adults. N Engl J Med 337 : 1705–1714. 9392695
53. Norström T, editor (2002) Alcohol in postwar Europe: consumption, drinking patterns, consequences and policy responses in 15 European countries. Stockholm: National Institute of Public Health.
54. Simpura J (1998) Mediterranean mysteries: mechanisms of declining alcohol consumption. Addiction 93 : 1301–1304. 9926536
55. Gual A, Colom J (1997) Why has alcohol consumption declined in countries of southern Europe? Addiction 92 (Suppl 1): S21–S31. 9167284
56. Sulkunen P (1989) Drinking in France 1965–1979. An analysis of household consumption data. Br J Addict 84 : 61–72. 2783870
57. Karlsson K, Österberg E (2007) Scaling alcohol control policies across Europe. Eurocare Bridging the Gap Project. Brussels: Eurocare.
58. Townsend J, Roderick P, Cooper J (1994) Cigarette smoking by socioeconomic group, sex, and age: effects of price, income, and health publicity. BMJ 309 : 923–927. 7950662
59. Rabinovich L, Brutscher P-B, de Vries H, Tiessen J, Clift J, et al. (2009) The affordability of alcoholic beverages in the European Union: understanding the link between alcohol affordability, consumption and harms. Santa Monica (California): RAND.
60. Zatonski W (2002) Democracy is healthier. A health miracle on the Vistula. Warsaw: Cancer Center and Institute of Oncology.
61. Leon DA, Chenet L, Shkolnikov VM, Zakharov S, Shapiro J, et al. (1997) Huge variation in Russian mortality rates 1984–94: artefact, alcohol, or what? Lancet 350 : 383–388. 9259651
62. Stuckler D, King L, McKee M (2009) Mass privatisation and the post-communist mortality crisis: a cross-national analysis. Lancet 373 : 399–407. doi: 10.1016/S0140-6736(09)60005-2 19150132
63. Moskalewicz J, Simpura J (2000) The supply of alcoholic beverages in transitional conditions: the case of Central and Eastern Europe. Addiction 95 (Suppl 4): S505–S522. 11218348
64. Reitan TC (2000) Does alcohol matter—public health in Russia and the Baltic countries before, during, and after the transition. Contemp Drug Probl 27 : 511–560.
65. Lai T, Habicht J (2011) Decline in alcohol consumption in Estonia: combined effects of strengthened alcohol policy and economic downturn. Alcohol Alcohol 46 : 200–203. doi: 10.1093/alcalc/agr001 21273300
66. Commission on Social Determinants of Health (2008) Closing the gap in a generation. Health equity through the social determinants of health. Geneva: World Health Organization.
67. Link BG, Phelan J (1995) Social conditions as fundamental causes of disease. J Health Soc Behav Spec No: 80–94.
68. Anderson P, Chisholm D, Fuhr DC (2009) Effectiveness and cost-effectiveness of policies and programmes to reduce the harm caused by alcohol. Lancet 373 : 2234–2246. doi: 10.1016/S0140-6736(09)60744-3 19560605
69. Jepson RG, Harris FM, Platt S, Tannahill C (2010) The effectiveness of interventions to change six health behaviours: a review of reviews. BMC Public Health 10 : 538. doi: 10.1186/1471-2458-10-538 20825660
Štítky
Interní lékařstvíČlánek vyšel v časopise
PLOS Medicine
2015 Číslo 12
- Alternativní léčebné možnosti u hypercholesterolemie při intoleranci statinů
- Vliv kombinace nutraceutik na remodelaci levé komory srdeční u osob s metabolickým syndromem
- Nutraceutika a jejich ovlivnění mírného kardiometabolického rizika
- Princip účinku medu v léčbě chronických i infikovaných ran
- Superoxidovaný roztok a jeho využití v léčbě ran
Nejčtenější v tomto čísle
- World Health Organization Global Estimates and Regional Comparisons of the Burden of Foodborne Disease in 2010
- Self-Administered Outpatient Antimicrobial Infusion by Uninsured Patients Discharged from a Safety-Net Hospital: A Propensity-Score-Balanced Retrospective Cohort Study
- Risks and Benefits of Nalmefene in the Treatment of Adult Alcohol Dependence: A Systematic Literature Review and Meta-Analysis of Published and Unpublished Double-Blind Randomized Controlled Trials
- Diversity in Clinical and Biomedical Research: A Promise Yet to Be Fulfilled