
A Nested Case–Control Study of Metabolically Defined Body Size Phenotypes and Risk of Colorectal Cancer in the European Prospective Investigation into Cancer and Nutrition (EPIC)
Gunter and colleagues analyse a large European dataset to determine how body size and metabolic profile associates with the risk of developing colorectal cancer.
Published in the journal:
. PLoS Med 13(4): e32767. doi:10.1371/journal.pmed.1001988
Category:
Research Article
doi:
https://doi.org/10.1371/journal.pmed.1001988
Summary
Gunter and colleagues analyse a large European dataset to determine how body size and metabolic profile associates with the risk of developing colorectal cancer.
Introduction
Obesity has been consistently associated with increased risks of certain chronic diseases, such as cardiovascular disease (CVD), type 2 diabetes (T2D), and cancer [1–4]. High body mass index (BMI) and several other measures of adiposity have been consistently and strongly associated with colorectal cancer. In the European Prospective Investigation into Cancer and Nutrition (EPIC), men and women in the highest quintile of waist circumference had a 40% and 50% higher risk, respectively, of developing colon cancer compared to those in the lowest quintile [5]. A meta-analysis of 30 cohort studies reported elevated risks (relative risks) for those categorised as overweight (25–29.9 kg/m2) and obese (≥30 kg/m2) of 1.13 (95% CI 1.06–1.19) and 1.31 (95% CI 1.19–1.45), respectively [2].
Hyperinsulinaemia and insulin resistance are commonly present in obese individuals and have been hypothesised to play a role in the aetiology of colorectal cancer [6]. For instance, higher circulating insulin levels have been previously associated with greater colorectal cancer risk [7,8]. Other studies have assessed insulin resistance by measuring the homeostatic model assessment index of insulin resistance (HOMAIR) or levels of C-peptide, which has a longer half-life than insulin and is considered a valid biomarker of pancreatic insulin secretion [9]. C-peptide levels have also generally been positively associated with colorectal cancer risk [10–12].
However, for CVD, T2D, and breast cancer, accumulating evidence has identified a sub-group of metabolically healthy overweight/obese individuals without hyperinsulinaemia who are seemingly at lower risk than their hyperinsulinaemic, metabolically unhealthy/overweight counterparts [13–15]. Similarly, normal-weight individuals have been subdivided into an “at risk” phenotype based on the prevalence of hyperinsulinaemia; individuals with this phenotype have been shown to exhibit elevated CVD, T2D, and breast cancer risks compared to their “low risk” normal-weight equivalents without hyperinsulinaemia [13–16].
To our knowledge, no prospective studies have investigated the association of metabolically defined body size phenotypes with colorectal cancer risk. The identification of sub-types of body size that are associated with colorectal cancer may be useful for risk stratification and further understanding of the pathophysiological mechanisms underlying the obesity–colorectal cancer relationship. Therefore, in this nested case–control analysis within the EPIC prospective cohort, we classified individuals into metabolically defined body size phenotype groups based on the presence or absence of hyperinsulinaemia (based on C-peptide level) combined with anthropometric measurements. The associations of these metabolically defined body size phenotypes with incident colorectal cancer were then assessed.
Methods
EPIC Study Population and Collection of Blood Samples
All study participants provided written informed consent. Ethical approval for the EPIC study was obtained from the review boards of the International Agency for Research on Cancer and local participating centres: National Committee on Health Research Ethics (Denmark); Comité de Protection des Personnes (France); Ethics Committee of the Heidelberg University Medical School (Germany); Ethikkommission der Landesärztekammer Brandenburg Cottbus (Germany); University of Athens Medical School (Greece) Comitato Etico Indipendente, Fondazione IRCCS Istituto Nazionale dei Tumori (Italy); Human Genetics Foundation Torino Ethics Committee (Italy); Medical Ethical Committee (METC) of the University Medical Center Utrecht (the Netherlands); Regional Ethical Committee for Northern Norway and the Norwegian Data Inspectorate (Norway); Comité de Ética de Investigación Clínica (Spain); Ethics Committee of Lund University (Sweden); Umea Regional Ethical Review Board (Sweden); Norwich District Ethics Committee (UK); Scotland A Research Ethics Committee (UK); and the Imperial College Research Ethics Committee (UK). EPIC is an ongoing multicentre prospective cohort study designed to investigate the associations between diet, lifestyle, and genetic and environmental factors and various types of cancer. A detailed description of the methods of the EPIC study has previously been published [17,18]. In summary, 521,448 participants (~70% women) mostly aged 35 y or above were recruited between 1992 and 2000. Participants were recruited from 23 study centres in ten European countries. The present study includes participants from Denmark, France, Germany, Greece, Italy, the Netherlands, Spain, and the United Kingdom. Blood samples were collected at baseline according to standardised procedures [17,18] and stored at the International Agency for Research on Cancer (−196°C, liquid nitrogen) for all countries except Denmark (−150°C, nitrogen vapour).
Follow-Up for Cancer Incidence and Vital Status
Incident cancer cases were identified using population cancer registries in Denmark, Italy, the Netherlands, Spain, and the United Kingdom. In France, Germany, and Greece, cancer cases were identified during follow-up from a combination of sources including health insurance records, cancer and pathology registries, and active follow-up directly through study participants or their next of kin. The end of follow-up for the current study was defined as the latest date of complete follow-up (of whole cohort) for both cancer incidence and vital status; this ranged from December 1999 to June 2003 for centres using registry data and from June 2000 to December 2002 for centres that used active follow-up procedures. Colorectal cancer cases were defined using the tenth revision of the International Classification of Diseases (ICD-10) and the second revision of the International Classification of Diseases for Oncology (ICDO-2). Cancer of the colon included cancers within the caecum, appendix, ascending colon, hepatic flexure, transverse colon, splenic flexure, descending colon, sigmoid colon, overlapping sites of colon, and unspecified sites within the colon (C18.0–18.9). Cancer of the rectum included cancer occurring at the rectosigmoid junction (C19) and rectum (C20).
Selection of Case and Control Participants
The current analysis uses data from a nested case–control study design in which serum C-peptide level was measured in 1,078 incident colorectal cancer cases and 1,078 matched controls from eight EPIC countries (excluding Norway and Sweden) [11]. Participants from Norway were not selected because the time period between blood collection and the laboratory analyses was too short for a sufficient number of colorectal cancer cases to accrue. Cases from Sweden were not included because an independent study of insulin and colorectal cancer risk within that population was ongoing when the laboratory analyses were undertaken. Controls were selected from the full cohort of individuals who were alive and free of cancer (except non-melanoma skin cancer) at the time of diagnosis of the cases, using incidence density sampling and with controls matched to cases by age (±6 mo at recruitment), sex, study centre, follow-up time since blood collection, time of day at blood collection (±4 h), fasting status, menopausal status, and phase of menstrual cycle at blood collection. Exclusion criteria for the current analysis included the following: individuals with diabetes (self-reported at baseline) or those with unknown diabetic status, individuals without information on fasting status when blood was collected, and women who reported using menopausal hormone therapy or oral contraceptives at the time of blood collection, due to the effect of exogenous hormone use on C-peptide levels, which may render the observed associations in hormone users uninterpretable [7]. After these exclusions, a total of 737 incident colorectal cancer cases and 737 matched controls with available baseline information were included in the analysis.
Assessment of Anthropometric, Lifestyle, and Dietary Exposures
With participants not wearing shoes, weight was measured to the nearest 0.1 kg and height was measured—dependent on the study centre—to the nearest 0.1, 0.5, or 1.0 cm. BMI was calculated as weight in kilograms divided by height in metres squared (kg/m2). Waist circumference was measured either at the narrowest torso circumference or at the midpoint between the lower ribs and iliac crest. Lifestyle questionnaires were used to obtain information on education, smoking status, alcohol consumption, and physical activity level. Dietary information (dietary intake of total energy, red and processed meats, and fibre, calcium, and fish) was collected at baseline using validated country/centre-specific dietary questionnaires [17,18].
Laboratory Measurements
C-peptide was assayed in serum samples of all participants (radioimmunoassay; Diagnostic System Laboratories) as previously described [11]. The mean intra-batch and inter-batch coefficients of variation were 4.6% and 7.5%, respectively, for C-peptide (at a concentration of 5 ng/ml) [11]. Levels of previously measured glycated haemoglobin (HbA1c) were also available for the majority of participants [19].
Metabolically Defined Body Size Phenotype Definitions
Participants were divided into tertiles based on the distribution of C-peptide concentration amongst the control population (tertile cut-points: 2.96 ng/ml and 4.74 ng/ml), and were classified as metabolically healthy if below the first tertile of C-peptide and metabolically unhealthy if above the first tertile. These metabolic health definitions were then combined with BMI or waist circumference measurements to create four metabolic health/body size phenotype categories: (1) metabolically healthy/normal weight (BMI < 25 kg/m2 or waist circumference < 80 cm for women and < 94 cm for men), (2) metabolically healthy/overweight (BMI ≥ 25 kg/m2 or waist circumference ≥ 80 cm for women and ≥ 94 cm for men), (3) metabolically unhealthy/normal weight (BMI < 25 kg/m2 or waist circumference < 80 cm for women and < 94 cm for men), and (4) metabolically unhealthy/overweight (BMI ≥ 25 kg/m2 or waist circumference ≥ 80 cm for women and ≥ 94 cm for men). The International Diabetes Federation (IDF) waist circumference cut-points were used [20]; these are ethnic-specific cut-points for European populations.
Statistical Analysis
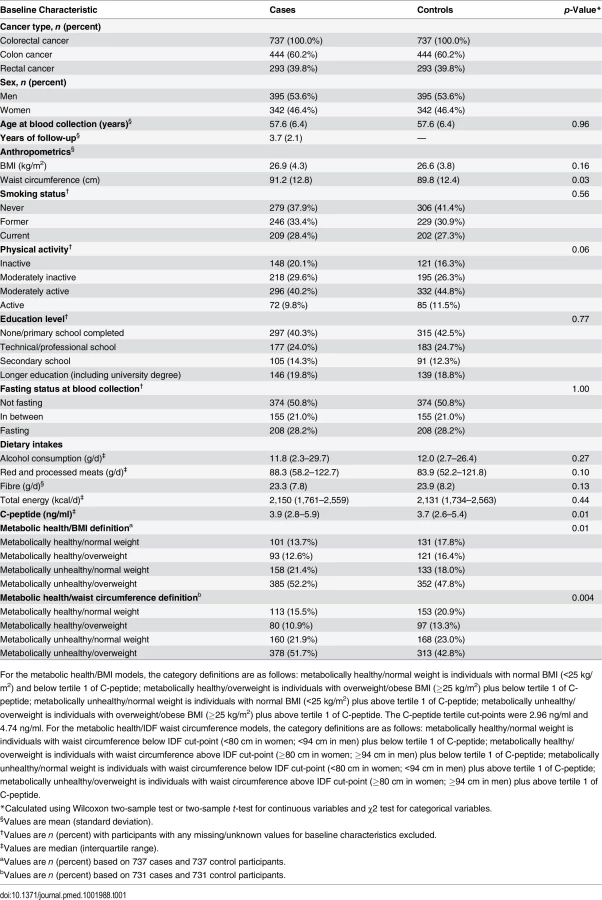
Differences between cases and controls were assessed using the Wilcoxon two-sample test or two-sample t-test for continuous variables and the χ2 test for categorical variables. Conditional logistic regression, stratified by case–control set, was used to compute odds ratios (ORs) and 95% confidence intervals for the associations between metabolic-health-defined body size phenotypes and colorectal cancer, colon cancer, and rectal cancer. The basic model (model 1) was conditioned on including the matching criteria only, while the multivariable models (models 2 and 3) included the matching criteria plus additional adjustment for a set of a priori defined colorectal cancer risk factors that included smoking status, physical activity, education level, alcohol consumption, height, and dietary intakes of total energy, red and processed meats, and fibre. Further adjustment for dietary intakes of calcium and fish resulted in virtually unchanged risk estimates, so these two variables were excluded from the multivariable models. Models were additionally stratified by sex and formally tested for heterogeneity using χ2 tests. Heterogeneity between colon and rectal cancer was tested using χ2 tests. To assess whether preclinical disease may have influenced the results, cases diagnosed within the first 2 y of follow-up were excluded and all analyses were redone. In sensitivity analyses, all models were rerun (1) with a BMI cut-point of 30 kg/m2 (rather than 25 kg/m2) for metabolic health/body size phenotype definitions and (2) with participants who had HbA1c measurements > 6.5% (the recommended cut-point for diagnosing diabetes) excluded. Tests of interaction (multiplicative) between the dichotomous body size (BMI or waist circumference) and C-peptide variables used to define the metabolic health/body size phenotypes were assessed in separate models. The statistical significance of these interaction terms was assessed by conducting likelihood ratio tests on models with and without these cross-product terms. Statistical tests used in the analysis were all two-sided, and a p-value of <0.05 was considered statistically significant. Analyses were conducted using Stata v11.0.
Results
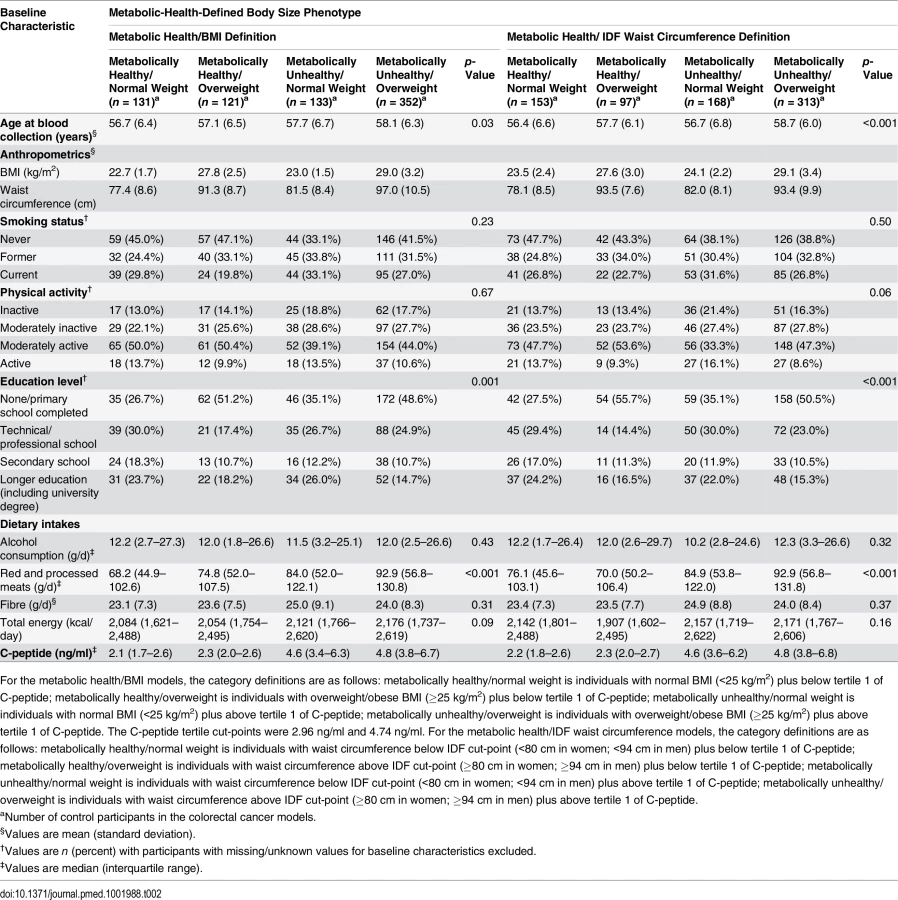
Colorectal cancer cases had greater waist circumference measurements than controls (Table 1). A higher proportion of the controls were never smokers and physically active compared to the case participants. Control participants reported lower consumption of red and processed meats and had lower levels of serum C-peptide than cases. The median follow-up time was shorter for colon cancer cases (3.7 y) than for rectal cancer cases (3.9 y). Compared to the metabolically healthy/normal weight group, a greater proportion of metabolically unhealthy/normal weight participants were physically inactive and a lower proportion never smoked (Table 2). Compared to the metabolically unhealthy/overweight group, individuals in the metabolically healthy/overweight group were less likely to be current smokers and to be physically inactive, and they consumed less red and processed meats.
Metabolically Healthy/Overweight
Categorisation based on body mass index
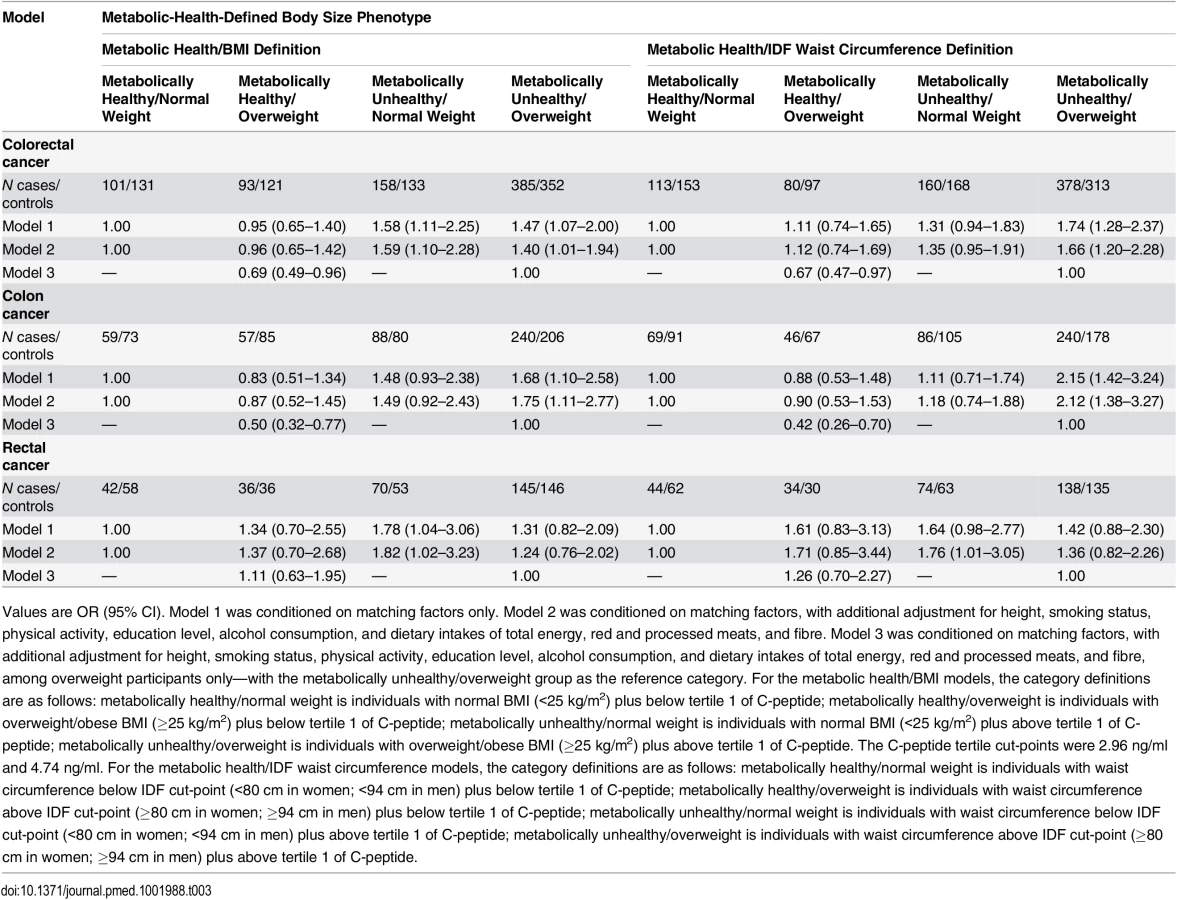
Individuals with the metabolically healthy/overweight phenotype were not at elevated risk of colorectal cancer compared to metabolically healthy/normal weight individuals (OR = 0.96, 95% CI 0.65–1.42) (Table 3). In a sensitivity analysis, a similar null colorectal cancer relationship was observed when the BMI cut-point of 30 kg/m2 was used (rather than 25 kg/m2) (OR = 1.09, 95% CI 0.51–2.35). Individuals classified as metabolically healthy/overweight were at lower colorectal cancer risk than their metabolically unhealthy/overweight counterparts (OR = 0.69, 95% CI 0.49–0.96) (Table 3). No statistically significant heterogeneity was observed when colon cancer and rectal cancer were compared (p for heterogeneity = 0.47), and when men and women were analysed separately (p for heterogeneity = 0.17).
Categorisation based on waist circumference
When waist circumference cut-points were used to categorise participants, metabolically healthy/overweight participants were, once more, at lower risk of colorectal cancer risk (OR = 0.67, 95% CI 0.47–0.97) than the metabolically unhealthy/overweight group, and not at higher risk than metabolically healthy/normal weight individuals (Table 3). There was no statistically significant difference in the associations when colon cancer and rectal cancer were compared (p for heterogeneity = 0.25), and when men and women were analysed separately (p for heterogeneity = 0.19).
Metabolically Unhealthy/Normal Weight
Categorisation based on body mass index
Higher colorectal cancer risk (OR = 1.59, 95% CI 1.10–2.28) was observed amongst metabolically unhealthy/normal weight participants than among their metabolically healthy/normal weight counterparts (Table 3). This positive association persisted following additional adjustment for waist circumference (OR = 1.52, 95% CI 1.05–2.20). There was no statistically significant difference in the associations for rectal cancer compared to colon cancer (p for heterogeneity = 0.50) or by sex (p for heterogeneity = 0.26).
Categorisation based on waist circumference
Non-significantly higher colorectal cancer risk was observed for metabolically unhealthy/normal weight participants compared to metabolically healthy/normal weight participants when IDF waist circumference cut-points (≥80 cm in women and ≥94 cm in men) were used as the marker of adiposity (Table 3). No statistically significant heterogeneity was observed when men and women were analysed separately (p for heterogeneity = 0.22). When compared versus the metabolically healthy/normal weight group, a statistically significant positive association was observed for metabolically unhealthy/normal weight participants for rectal cancer (OR = 1.76, 95% CI 1.01–3.05) but not for colon cancer (OR = 1.18, 95% CI 0.74–1.88), although this difference in association for rectal versus colon cancer was non-significant (p for heterogeneity = 0.33).
Metabolically Unhealthy/Overweight
Categorisation based on body mass index
Among the metabolically unhealthy/overweight group, higher colorectal cancer risk was observed compared with the metabolically healthy/normal weight individuals (OR = 1.40, 95% CI 1.01–1.94) (Table 3). No statistically significant heterogeneity in the relationship was observed for colon cancer and rectal cancer (p for heterogeneity = 0.47) or when men and women were analysed separately (p for heterogeneity = 0.32). A greater increased colon cancer risk was observed amongst the metabolically unhealthy/overweight group (OR = 1.75, 95% CI 1.11–2.77) than for overweight per se (i.e., when BMI was entered into the model as a dichotomous variable without consideration of hyperinsulinaemia; BMI ≥ 25 versus < 25 kg/m2, OR = 1.14, 95% CI 0.82–1.59).
Categorisation based on waist circumference
Higher colorectal cancer risk was observed among metabolically unhealthy/overweight individuals than among their metabolically healthy/normal weight counterparts (OR = 1.66, 95% CI 1.20–2.28) (Table 3). This positive relationship was statistically significant for colon cancer (OR = 2.12, 95% CI 1.38–3.27) but not for rectal cancer (OR = 1.36, 95% CI 0.82–2.26), although this difference in association for rectal versus colon cancer was non-significant (p for heterogeneity = 0.21). The positive colon cancer association for the metabolically unhealthy/overweight group was stronger than when waist circumference was entered into the model as a dichotomous variable without consideration of C-peptide level (≥80 cm women and ≥94 cm men versus <80 cm women and <94 cm men, OR = 1.58, 95% CI 1.14–2.19).
Sensitivity Analyses
Exclusion of participants with HbA1c values > 6.5% (indicative of possible sub-clinical diabetes) did not lead to any appreciable change in the study results for any group versus metabolically healthy/normal weight based on BMI (metabolically healthy/overweight, OR = 0.98, 95% CI 0.65–1.48; metabolically unhealthy/normal weight, OR = 1.68, 95% CI 1.14–2.47; metabolically unhealthy/overweight OR = 1.35, 95% CI: 0.95–1.92) or waist circumference (metabolically healthy/overweight, OR = 1.08, 95% CI 0.70–1.68; metabolically unhealthy/normal weight, OR = 1.32, 95% CI 0.91–1.91; metabolically unhealthy/overweight, OR = 1.64, 95% CI 1.16–2.32). A similar pattern of results was observed when the first quartile or median C-peptide value, rather than the first tertile, was used to define metabolic health (hyperinsulinaemia) for the body size phenotypes (S1 Table). A similar pattern of results were observed when cases diagnosed within the first 2 y of follow-up were excluded (S2 Table). The p-interaction values between the dichotomous BMI and C-peptide variables used to define the metabolic health/body size phenotypes were as follows: colorectal cancer, p = 0.72; colon cancer, p = 0.35; and rectal cancer, p = 0.09. The p-interaction values between the dichotomous waist circumference and C-peptide variables used to define the metabolic health/body size phenotypes were as follows: colorectal cancer, p = 0.69; colon cancer, p = 0.03; and rectal cancer, p = 0.05.
Discussion
The results of this prospective investigation indicate that normal-weight individuals with hyperinsulinaemia (the metabolically unhealthy/normal weight phenotype) are at higher colorectal cancer risk than those of normal-weight without hyperinsulinaemia. Our results also support the notion that metabolically healthy/overweight individuals, with normal insulin levels, are at reduced risk of colorectal cancer compared to their hyperinsulinaemic counterparts.
To our knowledge, this is the first investigation of hyperinsulinaemia-defined body size phenotypes and colorectal cancer risk in a prospective cohort setting. A number of studies have previously investigated the relationships of body size phenotypes with CVD, T2D, and breast cancer risks, and have reported elevated risks among metabolically unhealthy/normal weight individuals compared to their metabolically healthy/normal weight counterparts [13–16]. We observed a similar positive association for the metabolically unhealthy/normal weight phenotype when BMI and waist circumference were used as the anthropometric measure, and a statistically significant relationship was present only for rectal cancer and not for colon cancer. This result suggests that hyperinsulinaemia, independent of body size, may be a more relevant aetiological factor than adiposity per se; this is consistent with mitogenic and anti-apoptotic effects of insulin on the colon mucosa. Hypothesised causes of hyperinsulinaemia in normal-weight individuals, beyond an accumulation of visceral fat, may include low physical activity levels [21], low fibre intake [22], and changes in the actions of pro-inflammatory and anti-inflammatory cytokines [22,23].
In the metabolically healthy/overweight group, we observed no increased risk for colorectal cancer. This result is inconsistent with a recent Korean cross-sectional analysis that reported a 59% greater (OR 1.59, 95% CI 1.04–2.43) prevalence of high-risk colorectal adenoma for metabolically healthy/overweight individuals than for metabolically healthy/normal weight individuals [24]. In this previous analysis, the definition of metabolically unhealthy incorporated insulin resistance and metabolic syndrome criteria, such as blood pressure and abnormal levels of blood glucose and blood lipids. Within EPIC, when metabolic syndrome components and cut-points were analysed within the same multivariable model, only abnormal levels of blood glucose (as assessed by HbA1c measurements) were associated with colon cancer and rectal cancer [25]. These findings may reflect other potential mechanisms related to high abdominal fat accumulation being important for colorectal cancer risk, independent of hyperinsulinaemia. For example, visceral adipose tissue generates hormones and cytokines with inflammatory, metabolic, and direct carcinogenic potential, which may directly or indirectly increase colorectal cancer risk [26]. Therefore, potential pathways to explain this association include chronic low-grade inflammation and alterations in adipokine concentrations [26]. Future studies may shed more light on underlying pathophysiological mechanisms.
The increased colorectal cancer risk observed among the metabolically unhealthy/overweight group was present when both BMI and waist circumference measurements were used as markers of adiposity. Previous studies have shown a strong association between waist circumference and colon cancer [1,2,5]. In our analysis, a 58% greater risk of colon cancer was observed among participants above the IDF waist circumference cut-point (80 cm in women and 94 cm in men) compared to those below the cut-point. Interestingly, when individuals were subdivided into hyperinsulinaemia/body size phenotype groups, a higher risk estimate for the metabolically unhealthy/overweight group was observed (a 112% higher colon cancer risk). Overall, our results suggest that simply identifying those at greater risk of developing colorectal cancer by high BMI or waist circumference measurement would exclude normal-weight individuals with hyperinsulinaemia and underestimate the risk amongst overweight individuals with hyperinsulinaemia. Earlier identification of such individuals could lead to appropriate targeted interventions being introduced, which could prevent the onset of clinical disease.
A strength of our study is its prospective design, i.e., that pre-diagnostic measurements of C-peptide were used. Although the follow-up period was relatively short, a similar pattern of results was observed when cases with less than 2 y of follow-up were excluded. Our use of C-peptide level as a marker of insulin resistance, rather than the HOMAIR (using insulin and glucose measures), was justified as C-peptide is a validated marker of hyperinsulinaemia [9] and has been previously associated with colorectal cancer risk [11,12]. A limitation is that the classification of individuals as hyperinsulinaemic—based on their C-peptide level—was arbitrary. However, when we used the first quartile or median of C-peptide, instead of the first tertile, as the cut-point of hyperinsulinaemia, a similar pattern of associations was observed. A possible limitation was that our study lacked statistical power for some of the sub-group analyses, e.g., for the analysis of metabolically healthy/overweight participants compared with the metabolically healthy/normal weight group; however, we estimated that we had 70% power (α = 0.05, two-sided test) to observe a similar relationship to what was found for the metabolically unhealthy/overweight group (OR 2.1). An additional potential limitation was that data on use of aspirin and other non-steroidal anti-inflammatory drugs (NSAIDs) that have been linked with reduced risk of colorectal cancer were not available for the majority of study participants and could therefore not be considered as a possible covariate in our multivariable models. However, we feel it is unlikely that aspirin or NSAID use would significantly confound the observed associations between hyperinsulinaemia-defined body size phenotypes and colorectal cancer, since previously reported associations of adiposity, C-peptide, and other hyperinsulinaemia parameters with colorectal cancer risk were unaffected by adjustment for aspirin or NSAID use [7,12,27,28].
Our results indicate that sub-classifying populations by hyperinsulinaemia and adiposity measurements could identify differential colorectal cancer risk relationships for the defined metabolic health/body size phenotypes. Our results were supportive of individuals with the metabolically healthy/overweight phenotype being at lower colorectal cancer risk than those with hyperinsulinaemia and suggest that the assessment of insulin level in conjunction with adiposity measures may be of greater value in the assessment of colorectal cancer risk than adiposity per se.
Supporting Information
Zdroje
1. Larsson SC, Wolk A (2007) Obesity and colon and rectal cancer risk: a meta-analysis of prospective studies. Am J Clin Nutr 86: 556–565. 17823417
2. Moghaddam AA, Woodward M, Huxley R (2007) Obesity and risk of colorectal cancer: a meta-analysis of 31 studies with 70,000 events. Cancer Epidemiol Biomarkers Prev 16: 2533–2547. 18086756
3. Vazquez G, Duval S, Jacobs DR, Silventoinen K (2007) Comparison of body mass index, waist circumference, and waist/hip ratio in predicting incident diabetes: a meta-analysis. Epidemiol Rev 29: 115–128. 17494056
4. Renehan AG, Tyson M, Egger M, Heller RF, Zwahlen M (2008) Body-mass index and incidence of cancer: a systematic review and meta-analysis of prospective observational studies. Lancet 371: 569–578. doi: 10.1016/S0140-6736(08)60269-X 18280327
5. Pischon T, Lahmann PH, Boeing H, Friedenreich C, Norat T, Tjonneland A, et al. (2006) Body size and risk of colon and rectal cancer in the European Prospective Investigation Into Cancer and Nutrition (EPIC). J Natl Cancer Inst 98: 920–931. 16818856
6. Giovannucci E (2007) Metabolic syndrome, hyperinsulinemia, and colon cancer: a review. Am J Clin Nutr 86: 836S–842S.
7. Gunter MJ, Hoover DR, Yu H, Wassertheil-Smoller S, Rohan TE, et al. (2008) Insulin, insulin-like growth factor-I, endogenous estradiol, and risk of colorectal cancer in postmenopausal women. Cancer Res 68: 329–337. doi: 10.1158/0008-5472.CAN-07-2946 18172327
8. Schoen RE, Tangen CM, Kuller LH, Burke GL, Cushman M, et al. (1999) Increased blood glucose and insulin, body size, and incident colorectal cancer. J Natl Cancer Inst 91: 1147–1154. 10393723
9. Bonser AM, Garcia-Webb P, Harrison LC (1984) C-peptide measurement: methods and clinical utility. Crit Rev Clin Lab Sci 19: 297–352. doi: 10.3109/10408368409165766 6373142
10. Kaaks R, Toniolo P, Akhmedkhanov A, Lukanova A, Biessy C, et al. (2000) Serum C-peptide, insulin-like growth factor (IGF)-I, IGF-binding proteins, and colorectal cancer risk in women. J Natl Cancer Inst 92: 1592–1600. 11018095
11. Jenab M, Riboli E, Cleveland RJ, Norat T, Rinaldi S, et al. (2007) Serum C-peptide, IGFBP-1 and IGFBP-2 and risk of colon and rectal cancers in the European Prospective Investigation into Cancer and Nutrition. Int J Cancer 121: 368–376. doi: 10.1002/ijc.22697 17372899
12. Ma J, Giovannucci E, Pollak M, Leavitt A, Tao Y, et al. (2004) A prospective study of plasma C-peptide and colorectal cancer risk in men. J Natl Cancer Inst 96: 546–553. 15069117
13. Gunter MJ, Xie X, Xue X, Kabat GC, Rohan TE, et al. (2015) Breast cancer risk in metabolically healthy but overweight postmenopausal women. Cancer Res 75: 270–274. doi: 10.1158/0008-5472.CAN-14-2317 25593034
14. Ogorodnikova AD, Kim M, McGinn AP, Muntner P, Khan U, et al. (2012) Incident cardiovascular disease events in metabolically benign obese individuals. Obesity 20: 651–659. doi: 10.1038/oby.2011.243 21799477
15. Meigs JB, Wilson PWF, Fox CS, Vasan RS, Nathan DM, et al. (2006) Body mass index, metabolic syndrome, and risk of type 2 diabetes or cardiovascular disease. J Clin Endocrinol Metab 91: 2906–2912. 16735483
16. Bo S, Musso G, Gambino R, Villois P, Gentile L, et al. (2012) Prognostic implications for insulin-sensitive and insulin-resistant normal-weight and obese individuals from a population-based cohort. Am J Clin Nutr 96: 962–969. doi: 10.3945/ajcn.112.040006 23034958
17. Riboli E, Kaaks R (1997) The EPIC Project: rationale and study design. European Prospective Investigation into Cancer and Nutrition. Int J Epidemiol 26: S6. 9126529
18. Riboli E, Hunt KJ, Slimani N, Ferrari P, Norat T, et al. (2002) European Prospective Investigation into Cancer and Nutrition (EPIC): study populations and data collection. Public Health Nutr 5: 1113–1124. 12639222
19. Rinaldi S, Rohrmann S, Jenab M, Biessy C, Sieri S, Palli D, et al. (2008) Glycosylated hemoglobin and risk of colorectal cancer in men and women, the European Prospective Investigation into Cancer and Nutrition. Cancer Epidemiol Biomarkers Prev 17: 3108–3115. doi: 10.1158/1055-9965.EPI-08-0495 18990751
20. Alberti KGM, Zimmet P, Shaw J (2005) The metabolic syndrome—a new worldwide definition. Lancet 366: 1059–1062. 16182882
21. Dvorak RV, DeNino WF, Ades PA, Poehlman ET (1999) Phenotypic characteristics associated with insulin resistance in metabolically obese but normal-weight young women. Diabetes 48: 2210–2214. 10535456
22. Hyun YJ, Koh SJ, Chae JS, Kim JY, Kim OY, et al. (2008) Atherogenecity of LDL and unfavorable adipokine profile in metabolically obese, normal-weight woman. Obesity 16: 784–789. doi: 10.1038/oby.2007.127 18239579
23. De Lorenzo A, Del Gobbo V, Premrov MG, Bigioni M, Galvano F, et al. (2007) Normal-weight obese syndrome: early inflammation? Am J Clin Nutr 85: 40–45. 17209175
24. Yun KE, Chang Y, Jung HS, Kim CW, Kwon MJ, et al. (2013) Impact of body mass index on the risk of colorectal adenoma in a metabolically healthy population. Cancer Res 73: 4020–4027. doi: 10.1158/0008-5472.CAN-12-3477 23687341
25. Aleksandrova K, Boeing H, Jenab M, Bas Bueno-de-Mesquita H, Jansen E, et al. (2011) Metabolic syndrome and risks of colon and rectal cancer: the European Prospective Investigation into Cancer and Nutrition Study. Cancer Prev Res 4: 1873–1883.
26. Aleksandrova K, Nimptsch KF, Pischon T (2013) Influence of obesity and related metabolic alterations on colorectal cancer risk. Curr Nutr Rep 2: 1–9. 23396857
27. Wei EK, Ma J, Pollak MN, Rifai N, Fuchs CS, et al. (2005) A prospective study of C-peptide, insulin-like growth factor-I, insulin-like growth factor binding protein-1, and the risk of colorectal cancer in women. Cancer Epidemiol Biomarkers Prev 14: 850–855. 15824155
28. Kitahara CM, Berndt SI, de Gonzalez AB, Coleman HG, Schoen RE, et al. (2013) Prospective investigation of body mass index, colorectal adenoma, and colorectal cancer in the Prostate, Lung, Colorectal, and Ovarian Cancer Screening Trial. J Clin Oncol 31: 2450–2459. doi: 10.1200/JCO.2012.48.4691 23715565
Štítky
Interní lékařstvíČlánek vyšel v časopise
PLOS Medicine
2016 Číslo 4
- Příznivý vliv Armolipidu Plus na hladinu cholesterolu a zánětlivé parametry u pacientů s chronickým subklinickým zánětem
- Berberin: přírodní hypolipidemikum se slibnými výsledky
- Léčba bolesti u seniorů
- Flexofytol® – přírodní revoluce v boji proti osteoartróze kloubů
- Jak postupovat při výběru betablokátoru − doporučení z kardiologické praxe
Nejčtenější v tomto čísle
- Observational Evidence of For-Profit Delivery and Inferior Nursing Home Care: When Is There Enough Evidence for Policy Change?
- Experimental Treatment of Ebola Virus Disease with TKM-130803: A Single-Arm Phase 2 Clinical Trial
- The Chernobyl Disaster and Beyond: Implications of the Sendai Framework for Disaster Risk Reduction 2015–2030
- Is There Evidence of Poorer Birth Outcomes for Mothers and Babies When the Most Senior Obstetrician Is Not On Site?
Zvyšte si kvalifikaci online z pohodlí domova
Současné možnosti léčby obezity
nový kurzVšechny kurzy