
Trafficking of Hepatitis C Virus Core Protein during Virus Particle Assembly
Hepatitis C virus (HCV) core protein is directed to the surface of lipid droplets (LD), a step that is essential for infectious virus production. However, the process by which core is recruited from LD into nascent virus particles is not well understood. To investigate the kinetics of core trafficking, we developed methods to image functional core protein in live, virus-producing cells. During the peak of virus assembly, core formed polarized caps on large, immotile LDs, adjacent to putative sites of assembly. In addition, LD-independent, motile puncta of core were found to traffic along microtubules. Importantly, core was recruited from LDs into these puncta, and interaction between the viral NS2 and NS3-4A proteins was essential for this recruitment process. These data reveal new aspects of core trafficking and identify a novel role for viral nonstructural proteins in virus particle assembly.
Published in the journal:
. PLoS Pathog 7(10): e32767. doi:10.1371/journal.ppat.1002302
Category:
Research Article
doi:
https://doi.org/10.1371/journal.ppat.1002302
Summary
Hepatitis C virus (HCV) core protein is directed to the surface of lipid droplets (LD), a step that is essential for infectious virus production. However, the process by which core is recruited from LD into nascent virus particles is not well understood. To investigate the kinetics of core trafficking, we developed methods to image functional core protein in live, virus-producing cells. During the peak of virus assembly, core formed polarized caps on large, immotile LDs, adjacent to putative sites of assembly. In addition, LD-independent, motile puncta of core were found to traffic along microtubules. Importantly, core was recruited from LDs into these puncta, and interaction between the viral NS2 and NS3-4A proteins was essential for this recruitment process. These data reveal new aspects of core trafficking and identify a novel role for viral nonstructural proteins in virus particle assembly.
Introduction
Hepatitis C virus (HCV) is a major cause of acute and chronic hepatitis, cirrhosis, and hepatocellular carcinoma. HCV is an enveloped, positive-strand RNA virus classified with the Family Flaviviridae [1]. The viral genome encodes an open reading frame of ≈3011 codons that is translated as a single polyprotein, which is cleaved by viral and host proteases into at least 10 distinct products (Figure 1A). The N-terminal region encodes three structural components: core protein, which forms the viral nucleocapsid, and two envelope glycoproteins (E1 and E2), which mediate viral attachment and entry. The remainder of the genome encodes the nonstructural (NS) proteins: p7, NS2, NS3, NS4A, NS4B, NS5A and NS5B. The NS proteins mediate intracellular aspects of the virus life cycle including RNA replication, subversion of innate antiviral defense, and virus particle assembly. The precise roles of NS proteins in virus particle assembly are not clear but p7, NS2, NS3, NS4A, NS4B, and NS5A all contribute to this process [2], [3], [4].

HCV core is a highly basic RNA-binding protein that contains three distinct functional domains [5]. Domain 1 (amino acid (aa) 1–117) is hydrophilic and contains determinants for RNA binding and core oligomerization [6]. Domain 2 (aa 118–177) forms a pair of amphipathic helices that mediate the peripheral association of core with cellular membranes [7], [8], [9]. Domain 3 (aa 178–191), which serves as a signal peptide for the translocation of E1 protein into the endoplasmic reticulum (ER) lumen, is absent from mature core protein [5]. Core is initially cleaved from the polyprotein by host signal peptidase (SP); subsequent removal of domain 3 by signal peptide peptidase (SPP) then yields mature core protein that forms a homodimer [6], [9], [10].
Following cleavage, mature core protein is targeted to lipid droplets (LDs) [11], [12], [13]. LDs are intracellular storage organelles containing a hydrophobic core of neutral lipids and cholesterol esters surrounded by a phospholipid monolayer embedded with LD-specific proteins [14]. LD biogenesis is not fully understood, but LDs are likely derived from the outer leaflet of the ER and may remain contiguous with this membrane system [15]. LD-associated proteins are presumably loaded onto LDs at sites of ER contact [16], although vesicular transport mechanisms have not been formally excluded. The best-characterized LD-associated proteins are perilipin, adipocyte differentiation-related protein (ADRP), and tail-interacting protein (TIP) 47, collectively known as the PAT proteins [17]. PAT proteins are thought to regulate the dynamics of lipid acquisition, storage, and release [15]. In addition, the membrane trafficking GTPase Rab18 may associate with a subset of LDs undergoing lipolysis [18], [19], [20], [21].
The role of core trafficking to LDs is not well understood. Prior work has shown that core protein recruits NS proteins and RNA replication complexes to sites adjacent to LDs [22]. Furthermore, core recruits NS5A to the surface of LDs, where they co-localize [23]. Mutations that alter the LD localization of core or that block core's ability to recruit viral NS proteins to LDs inhibit virus production [22], [24], [25], [26], suggesting that LDs are intimately involved in virus particle assembly. The site of virus budding has not been definitively determined, but the ER retention of E1-E2 [27], [28], the complex glycan modifications on secreted virus particles [29], the differential effects of Brefeldin A (BFA) on virus assembly vs. virus secretion [30], and analogies to closely related flaviviruses (reviewed in [31]), all suggest that virus particles bud into the ER and transit through the secretory pathway. However, it is not yet clear how LD-associated core contributes to this process.
We hypothesize that core protein must be trafficked from LDs into nascent virus particles at the LD-ER interface. To understand the dynamics of core protein trafficking during virus assembly, we developed methods to fluorescently label and image functional core protein in live, virus producing cells. We observed core trafficking to static ADRP-positive LDs, forming a cap on the surface. At these sites, core co-localized with the viral E2 glycoprotein and adjacent to NS3 protein, consistent with these being sites of virus assembly. We also observed highly motile ADRP-independent core puncta that represent post-LD form of core. By using pharmacologic inhibitors of virus egress and a panel of mutants blocked in virus assembly, we showed that core is recruited from sites of assembly into these puncta, and that this process requires interaction between viral NS proteins.
Results
Fluorescent labeling of functional HCV core protein
To better understand the trafficking of HCV core protein during virus particle assembly, we developed methods to fluorescently label and image functional core in living cells. Traditional live imaging systems often rely on the insertion of fluorescent proteins into a target protein, but the relatively large size of such tags would likely interfere with the function of core protein. We therefore genetically inserted the small tetracysteine (TC) peptide tag (FLNCCPGCCMEP) near the N-terminus of core (Figure 1B) within the context of the HCV Jc1 infectious clone. Importantly, insertion of this tag had only minimal effects on infectious virus production compared to untagged Jc1 (Figure 1C). For both untagged Jc1 and Jc1/core(TC), peak viral infectivity was observed between 48 and 72 h post-electroporation, although the infectivity titers of Jc1/core(TC) were slightly reduced (2 - to 4-fold) at each time point. This correlated with a 2.7-fold decrease in specific infectivity (0.16 Jc1 infectious units per RNA-containing particle vs. 0.06 Jc1/core(TC) infectious units per RNA-containing particle), suggesting that the small decrease in infectivity titers may have been due to an inefficiency in virus entry rather than in virus assembly. Both Jc1 and Jc1/core(TC) had similar biophysical profiles, with peak infectivities and specific infectivities observed in fractions with buoyant density of ≈1.10 g/ml (Figures S1A and S1B). Furthermore, the TC-tagged form of core accumulated to similar levels as untagged core within virus-producing cells (Figure 1D), and the TC insertion was retained after six serial virus passages (data not shown). Together, these data indicated that the TC tag insertion was well tolerated and that the TC-tagged core protein was functional for virus assembly.
To label core(TC), infected Huh-7.5 cells were incubated with FlAsH (green) or ReAsH (red) under optimized labeling conditions (as described in Materials and Methods) during the peak of virus assembly, 48 to 72 h post-infection or electroporation (Figure 1C). As shown in Figure 1E, specific signals were observed in Jc1/core(TC)-infected cells, often as bright puncta or crescents (Figure 1E, arrowhead), but not in Jc1-infected cells. Importantly, these FlAsH labeling conditions had no effect on the release of infectious virus particles (Figure 1F), indicating that these methods allowed us to label functional core protein during virus assembly. To further confirm that FlAsH-labeling was specific for core, Jc1/core(TC)-infected cells were labeled with FlAsH, fixed, and stained for core by IF (Figure 1G). FlAsH and anti-core IF signal largely co-localized (Pearson's correlation coefficient = 0.715), confirming that FlAsH labeled core(TC) protein. However co-localization was incomplete, largely due to the increased signal intensity of the IF signal in a perinuclear, reticular pattern. This difference could be attributable to one or more of the following issues. First, FlAsH signal intensity decreased 4-fold during fixation and processing for IF (Figure S2), mostly likely because this dye lacks an aldehyde-reactive primary amine and may be washed out during processing. Second, indirect IF is designed to amplify weak signals, whereas FlAsH labeling binds stoichiometrically to the TC tag. Third, FlAsH is less photostable than the Alexa dye used during IF, which could bias the relative signal intensities. Fourth, small dyes and antibodies may differ in their accessibility and efficiency of protein labeling. Nevertheless, these data confirmed that the TC tag can be used to label core protein in live, virus-producing cells.
Localization and kinetics of core protein in live cells
To better clarify the role of core LD-trafficking during virus assembly, we created Huh-7.5-derived cell lines that stably expressed ADRP, a marker of storage LDs, fused to green fluorescent protein (GFP) or cerulean fluorescent protein (CFP). As ADRP expression levels can influence LD metabolism [32], we first characterized these cell lines for their ADRP expression, LD content, and ability to support infectious HCV particle assembly. Neither tagged-ADRP protein was overexpressed when compared to endogenous levels of ADRP expression (Figure S3C). There was a modest increase in the number of LDs in Huh-7.5/CFP-ADRP cells (170.8±67.89 LDs/cell) compared to Huh-7.5′s (128.0±53.1 LDs/cell), although this difference was not statistically significant (p >0.05; unpaired Student's t-test). Furthermore, there was no difference in the volume of LDs, either with or without oleic acid supplementation (Figure S3D). Importantly, both cell lines supported infectious virus production at levels comparable to non-transduced cells (Figure S3A–B). These data indicated that the GFP-ADRP and CFP-ADRP cells provided suitable environments to study core-LD trafficking in live cells.
To investigate core trafficking, we performed ReAsH labeling and live cell imaging of core(TC) in Huh-7.5/GFP-ADRP cells. Across multiple experiments, core consistently localized to: i) a dim reticular pattern, most likely the ER (Figure S3E) [13], [22]; ii) caps on ADRP-positive LDs; and iii) bright puncta that were not associated with ADRP-positive LDs (Figure 2A). Notably, the caps of LD-associated core protein frequently faced the ER-like form of core, and core-positive LDs exhibited little directional movement (Figure 2B, upper panel and Video S1). In contrast, ADRP-positive LDs that lacked core were more motile. Furthermore, core puncta were small and motile (Figure 2B, lower panel and Video S1).
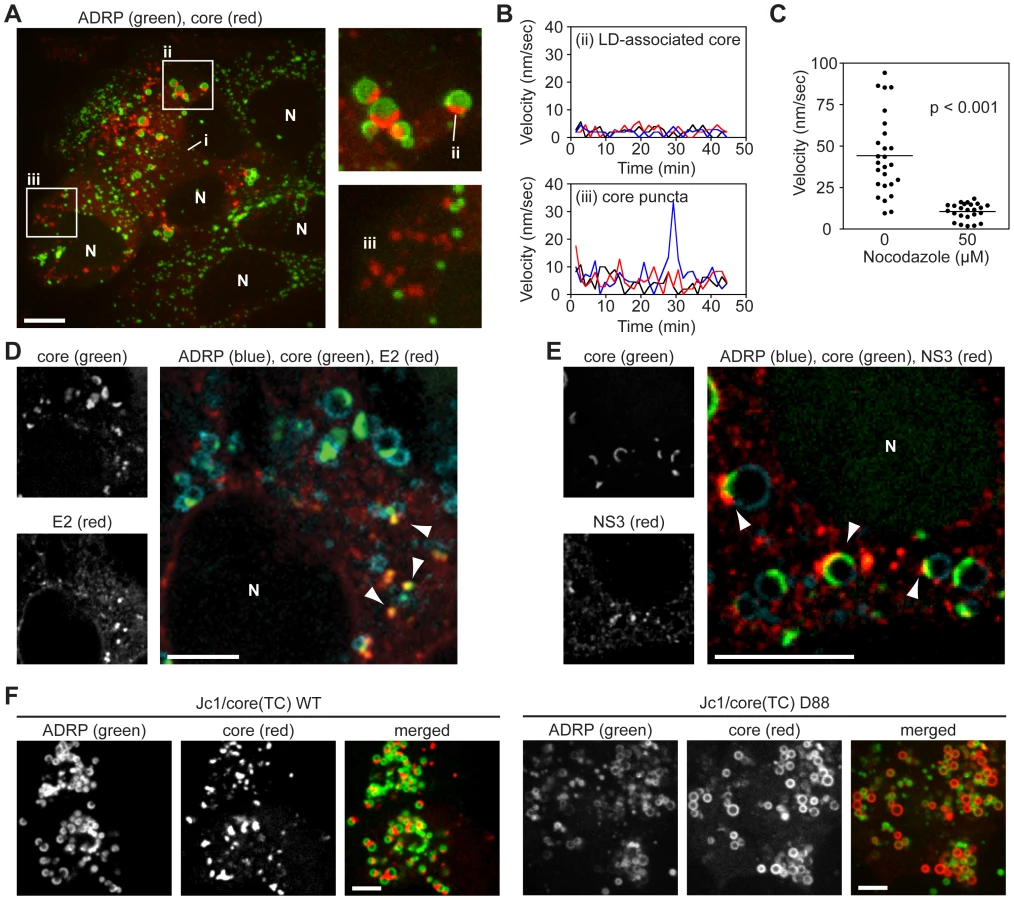
Given the velocity of core puncta, we examined whether they were associated with microtubules by performing live cell imaging in Huh-7.5 cells that stably expressed fluorescent protein-tagged ß-tubulin. As shown in Video S2, core puncta trafficked along microtubules, frequently in a retrograde direction. In contrast, motile core puncta were not associated with fluorescent protein-tagged actin filaments (data not shown). Furthermore the motility of core puncta was inhibited by nocodazole, an inhibitor of microtubule trafficking (Figure 2C and Video S3). These data indicated that motile core puncta were trafficked on microtubules.
To better clarify the interaction of core with LDs, and to determine whether core puncta represent small LDs that lack ADRP, we examined additional LD markers. Staining with a dye specific for neutral lipids confirmed that core localized to semi-spherical caps on the surface of LDs and to small LD-independent puncta (Figure S3F). Furthermore, LD-associated core specifically trafficked to ADRP-positive LDs but not to Rab18-positive LDs (Figures S3G and H), which likely represent LDs undergoing lipolysis [33]. These data confirmed that core trafficked to ADRP-positive LDs and to distinct motile puncta that were not LD-associated.
To determine whether the different forms of core corresponded to sites of virus particle assembly, we examined the localization of core with respect to the viral E2 glycoprotein (a structural component of virus particles) or NS3 serine protease-RNA helicase (a NS protein that has been implicated in virus assembly). Since we currently lack tools to image functional E2 and NS3 in live cells, these viral proteins were localized by IF in fixed cells. As seen in Figure 2D, the majority of E2 staining was in a reticular pattern, consistent with its ER retention, as well as discrete E2 puncta that co-localized with core (Figure 2D, arrowheads). These core-E2 structures were frequently found adjacent to small LDs and may represent areas where core has been recruited from LDs into nascent virus particles. The frequency of such core-E2 puncta was low (2.86±0.54 per cell, n = 28 cells), which could reflect the low burst size of HCV as well as the inherent difficulties with antibody recognition of E2 [34]. In addition, we also observed core puncta that were not labeled with E2. Similarly, NS3 also showed a reticular staining pattern, but frequently concentrated in regions adjacent to LD-associated caps of core protein (Figure 2E, arrowheads). For further characterization, we looked for co-localization of core with other components of the secretory compartment, including markers for ER exit sites (Sec16, Sec23), the ER-Golgi intermediate compartment (ERGIC-58), and Golgi (TGN38), but did not reproducibly observe co-localization with these markers (data not shown). Based on these data, we hypothesize that LD-associated core caps likely represent sites of early virus particle assembly, while motile puncta may represent core-containing transport vesicles.
To further clarify the relationship between core trafficking and virus particle assembly, we examined core trafficking in a mutant virus, D88, which is blocked at an early stage of virus particle assembly due to a large in-frame deletion in the E1-E2-p7 genes [35]. The Jc1/core(TC) D88 mutant showed a substantial increase in core accumulation on the surface of LDs (Figures 2F, S3I). While a small number of core puncta were observed, they were non-motile (Video S4), indicating that they were distinct from the motile core puncta seen in virus-producing cells. While it is not yet clear what these non-motile core puncta represent, these data showed that core accumulates on LDs and that motile core puncta were not seen when virus assembly was blocked at an early step.
Effects of Brefeldin A on core localization
Our previous results suggested that motile core puncta may represent a post LD-form of core. To further investigate this hypothesis, we treated cells with BFA, a fungal metabolite that disrupts ER-Golgi trafficking by inhibiting the activation of ADP ribosylation factor 1 (ARF1) [36]. The timing and dose of BFA treatment were chosen to minimize effects on HCV RNA replication [37]. Consistent with previous findings [38], BFA treatment inhibited the secretion of virus particles as well as a model secreted protein, causing them to accumulate within BFA-treated cells (Figure S4A–B). As ARF1 can regulate lipid homeostasis [39], [40], [41], we also checked whether our conditions affected LD trafficking. Our BFA treatment conditions had only minimal effects on ADRP protein expression, LD number, and LD volume (Figure S4C), indicating that these conditions could be used to study the trafficking of core protein when ARF1 is inhibited.
To observe the effects of BFA on core localization, cells were imaged before and after BFA treatment, as well as after drug washout (Figure 3A). BFA treatment increased both the number of LDs containing core and the amount of core that accumulated on each LD (Figure 3B–D), suggesting a defect in core egress from LDs. After drug washout, both of these effects were relieved (Figure 3B–D). BFA treatment resulted in a slight reduction of LD-independent core puncta at 4 h (Figure 3E); however, these puncta were not motile when BFA was present (Video S5 and Figure 3I). Upon BFA washout, more core puncta were observed (Figures 3E, 3H) and core puncta quickly regained their motility (Video S6 and Figure 3I). These effects were mirrored in the intracellular accumulation of virus during BFA treatment and an increase in virus secretion after BFA washout (Figures 3F and 3G). The absence of motile core puncta during BFA treatment and their re-emergence upon washout suggests that they represent a post-LD form of core.

Long-term dynamics of core trafficking
Based on the above results, we expected to observe the trafficking of core from LDs into motile core puncta during live imaging studies. However, these events may be relatively rare, and FlAsH and ReAsH are prone to photobleaching, which greatly limited the number of sequential frames that could be acquired during time course experiments. To better monitor core trafficking over time, we took advantage of the dual labeling capabilities of biarsenical dyes [42]. We reasoned that infected cells could be sequentially labeled under pulse-chase conditions, first with FlAsH to label pre-existing (“old”) core, followed by ReAsH to specifically detect newly synthesized (“new”) core. Pilot experiments showed that simultaneous labeling of Jc1/core(TC)-infected cells with both FlAsH and ReAsH yielded green and red signals that completely overlapped, indicating that both dyes bind TC-tagged core with similar efficiency (data not shown). Next, infected cells were labeled with FlAsH, then labeled with ReAsH after appropriate intervals (Figure 4A). Under these conditions, newly synthesized protein was specifically detected with ReAsH, but not when protein synthesis was halted by cycloheximide treatment during the chase period (Figure 4B, compare second and third rows). Furthermore, newly synthesized core did not traffic to LDs when the maturation of core was blocked by treatment with an inhibitor of signal peptide peptidase but was restored after washout of this inhibitor (Figure S5). These data confirmed that the dual labeling technique could be used to specifically label and image old and new core under pulse-chase conditions.

We used dual labeling to observe the trafficking of core synthesized before and after chase periods of 2, 8, and 24 h (Figure 4B). After 2 h, a small amount of newly synthesized core was detected in an ER-like reticular pattern or co-localized with old core in LD-associated caps (Figure 4B, top row). By 8 h, new core and old core had accumulated on LDs to comparable levels, and mixed puncta (containing both old and new core) were abundant (Figure 4B, second row). By 24 h, new core was the predominant species in both LDs and motile core puncta (Figure 4B, bottom row). Similar results were also obtained when the order of FlAsH - and ReAsH-labeling were switched (data not shown).
In order to observe the trends of core trafficking, we quantitated LDs and motile core puncta that contained old, new, or mixed core protein over time (Figure 4C). These data yielded several interesting results. First, newly synthesized core was targeted to LDs shortly after synthesis. Second, the mixing of old and new core on LDs at 8 h indicated that core-containing LDs maintain communication with the site of core synthesis for extended periods of time (see Discussion). Third, the peak of mixed core in puncta (8 h) was observed after the peak of mixed core on LDs (2 h), further supporting our hypothesis that motile core puncta represent a post-LD form of core. Fourth, the small proportion of motile puncta containing old and mixed core at 24 h suggested that once core leaves LDs, it is either packaged into virus particles for secretion, or turned over.
The interaction between NS2 and NS3 is essential for recruiting core from LDs
We next examined the role of NS2 in core trafficking. Prior genetic and biochemical studies indicated that NS2 plays an important role in virus assembly by bringing together the viral E1–E2 glycoprotein and NS3-4A enzyme complexes [4], [43], [44], [45]. We previously identified two classes of NS2 mutants with defects in virus assembly [45], [46]. Class 1 mutants (NS2 K27A, W35A, or Y39A) show reduced interaction between NS2 and NS3, and their defects in virus assembly can be suppressed by a second-site mutation in the helicase domain of NS3, Q221L [45], [46]. A class 2 mutant (NS2 K81A) has normal levels of NS2–NS3 interaction but reduced interaction between NS2 and E1–E2, and its defect in virus assembly can be suppressed by a second site mutation in E1, E78T [45], [46]. When the class 1 NS2 mutation K27A was introduced into Jc1/core(TC), the amount of core staining per cell increased, and specifically, core accumulated on LDs (Figures 5A and 5B), similar to what was previously observed with the D88 mutation. The addition of the NS3 Q221L suppressor restored normal core trafficking (Figures 5A and 5B). Based on these results, we tested additional NS2 mutants. All class 1 NS2 mutants showed increased intracellular accumulation of core (Figure 5C, left panel), and specifically, core localized to LDs (Figure S6A). Furthermore, core accumulation was restored to WT levels by the NS3 Q221 suppressor mutation (Figure 5C, right panel). In contrast, the class 2 NS2 mutant, K81A, did not show these effects (Figure 5C). These results were further confirmed by core IF with the untagged Jc1/NS2(K27A) mutant in non-transduced Huh-7.5 cells (Figure S6B). Taken together, these data indicated that the genetic interaction between NS2 and NS3 is important for proper egress of core from the surface of LDs.
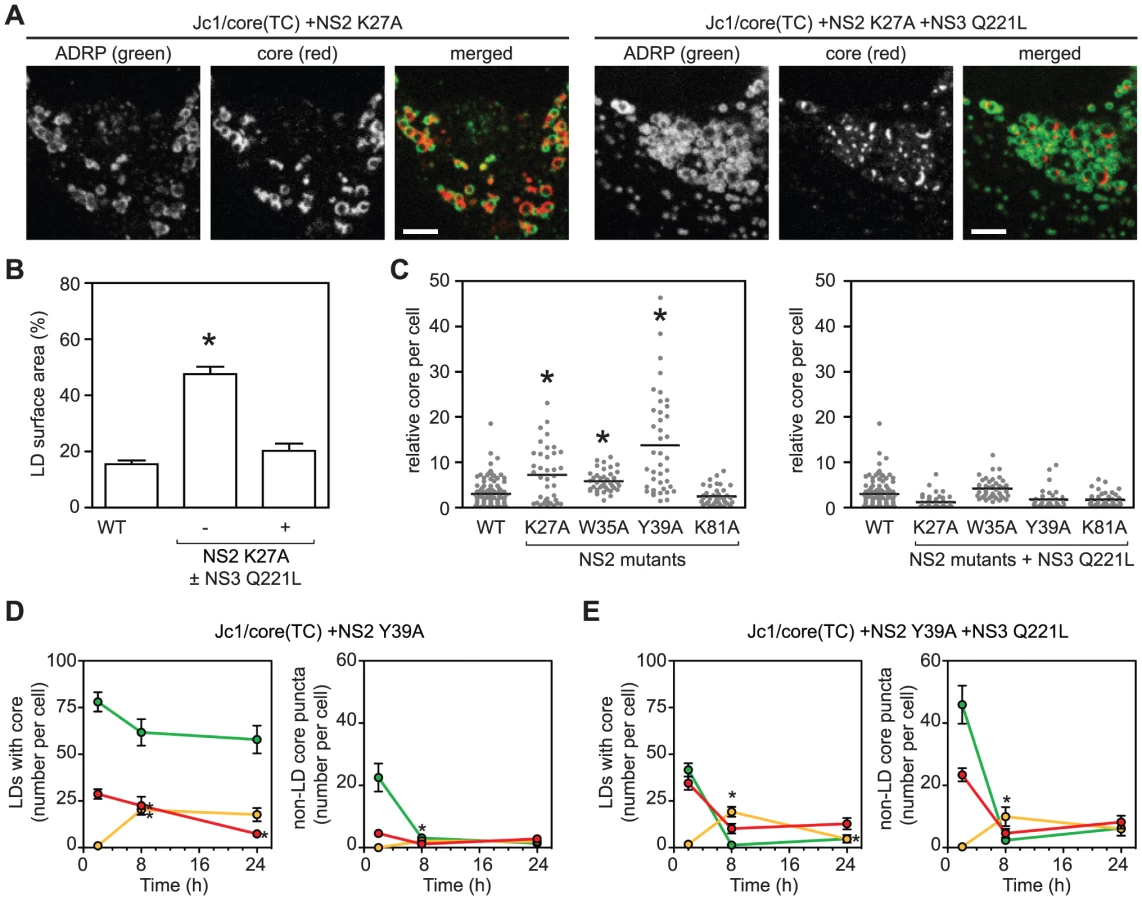
To further clarify whether the interaction between NS2 and NS3 is important for the recruitment of core from LDs into core puncta, we performed FlAsH/ReAsH-dual labeling and quantitated LD-associated core and motile core puncta between 48 and 72 h post-electroporation. The NS2 Y39A mutant was used for these experiments because it showed the greatest accumulation of core (Figure 5C). At all time points, the Y39A mutant showed an abundance of LDs containing old core and few LDs containing mixed or new core (Figure 5D, left panel). In contrast, the Y39A + Q221L double mutant showed LDs containing a mixture of old, new, and mixed core (Figure 5E, left panel), which was qualitatively similar to WT (Figure 4C, top panel). Importantly, the number of motile core puncta, especially those containing new core, was significantly reduced in the Y39A mutant (Figure 5D, right panel) but was restored in the Y39A + Q221L double mutant (Figure 5E, right panel). Taken together, we conclude that the interaction between NS2 and NS3 is important for the recruitment of core from LDs into motile core puncta.
Discussion
We developed methods to image functional core protein in live, virus-producing cells. The small size of the TC tag offered several advantages over fluorescent protein tagging, namely that tagged proteins are more likely to retain native function, and do not require lengthy maturation of protein-encoded fluorophores. Additionally, live cell imaging bypasses the need for fixation, which can alter the localization of LD-associated proteins [47]. In the current study, TC-tagging and labeling with biarsenical dyes had minimal effects on viral replication, core protein expression, or virus particle production. Furthermore, the optimized labeling conditions used here [48] were specific for TC-tagged core protein. Thus, these methods can be used to confidently track functional core protein.
Despite repeated attempts, we did not observe FlAsH-labeled extracellular virus particles. This could be explained by several considerations. First, FlAsH label may be inefficiently incorporated into virus particles, perhaps displaced from the TC tag during RNA packaging. Alternatively, incorporated FlAsH label could be quenched or too dim to image reliably. The detection of extracellular virus particles may also be hampered by the low burst size of HCV [34], the inherent pulse-type labeling with biarsenical dyes, and the propensity of these reagents to photobleach. Nevertheless, we were able to reliably image intracellular forms of HCV core protein.
Three forms of core protein were observed in live cells: ER-associated core, LD-associated core, and motile, LD-independent puncta. On LDs, core formed polarized caps that displaced ADRP and were frequently in close apposition to ER-localized core. Similar LD-associated caps of core protein were previously seen in fixed cells by IF staining [24], [49], and likely reflect sites of core protein transfer between the ER and LDs. Consistent with this model, newly synthesized core was directed to LDs that already contained older core. These data suggest that core-containing LDs maintain direct communication with the ER for extended periods of time or that LDs containing old or new core can fuse to allow mixing.
Large core-containing LDs were immotile during the time periods we observed, which coincided with the peak of virus particle assembly. Prior studies have shown that infection with HCV strain JFH-1 or overexpression of core protein causes microtubule-based trafficking of LDs to the perinuclear region [49], [50]. In our hands, attempts to image core at significantly earlier times were unfruitful due to low levels of core expression and dim staining. Nevertheless, we did observe core-containing LDs clustered in the perinuclear region, suggesting that they had either formed there or moved there prior to staining.
Although LD-associated core has been implicated in virus particle assembly, it has been difficult to demonstrate a direct role for core-LD trafficking in this process. Boulant and colleagues proposed that progressive trafficking of core onto LDs strongly correlates with a rise in infectious virus production [24]. Furthermore, the accumulation of core on LDs inversely correlates with the efficiency of virus production, exemplified by the different localization patterns observed for viruses with high (Jc1) and low (JFH1) infectious titers [22], [26]. Similarly, we observed dramatic increases in the amount of LD-associated core with an HCV deletion mutant that is unable to assemble virus particles.
In addition to LD-associated core, we also observed motile core puncta that were not LD-associated. We propose that motile core puncta represent a form of core relevant for virus assembly based on the following considerations: 1) the formation of motile core puncta was blocked in the D88 mutant, which is unable to assemble virus particles (Figure 2F and Video S4); 2) the formation of motile puncta after BFA washout indicated that they represent a post-LD form of core (Figure 3); and 3) newly synthesized core trafficked to LDs before it trafficked to motile puncta (Figure 4). These data suggest that puncta represent transport vesicles containing virus particles or an intermediate in virus particle assembly. For instance, Lai and colleagues recently showed that core may traffic to a compartment containing early endosomal markers during virus particle secretion [51].
It was interesting that core accumulated on the surface of LDs during BFA treatment (Figure 3B–D), suggesting that ARF1 activity is required for the egress of core from LDs. This would be consistent with a defect in virus assembly, as was seen for the D88 mutant (Figure 2F) and the class 1 NS2 mutants (Figure 5). While BFA inhibited virus secretion, intracellular virus particles still assembled during treatment (Figure 3F–G and S4A–B). One possibility is that virus particles made during BFA treatment may utilize the available ER-associated pool of core; presumably then BFA would cause a defect in virus assembly once this pool is depleted. In addition, BFA may slow the egress of core from LDs and reduce the rate of virus assembly. A full accounting of infectious virus production could be used to discriminate between these possibilities.
Taken together, our data support the model for core trafficking depicted in Figure 6A. Core protein is synthesized on the ER and trafficked to LDs, which remain in direct or indirect communication with the ER. During virus assembly, core protein is recruited from the surface of LDs and into puncta, which likely represent transport vesicles containing virus particles or possibly a core-containing intermediate.

To further explore our model of core trafficking, we utilized our live-cell imaging tools to study the role of NS2 in virus assembly. The class 1 NS2 mutants all showed a large accumulation of core around LDs and fewer core puncta, and core trafficking was restored by the NS3 Q221L second-site suppressor mutation in the viral RNA helicase. In contrast the NS2 K81A mutant showed normal core-LD trafficking. This mutant was previously found to have a distinct defect in virus particle assembly, exhibits normal levels of interaction between NS2 and NS3-4A [45], and is not rescued by the NS3 Q221L mutation [46]. By using sequential labeling, we showed that a block in virus assembly caused an accumulation of old core on LDs and a vast reduction in newly synthesized core on LDs. Thus, the assembly defect results in either reduced synthesis of core, or increased turnover. Importantly, there was a distinct lack of puncta containing newly synthesized core. Taken together, these data strongly suggest that NS2, and more specifically, the interaction between NS2 and NS3-4A, is important to recruit core off the surface of LDs and into core-containing puncta.
Although NS2 is important for the recruitment of core from LDs, NS2 does not directly interact with core protein [43], [44], [45]. How then does NS2 contribute to core trafficking? NS2 coordinates virus particle assembly by bringing together the viral structural and NS proteins (Figure 6B). We propose that the interaction with NS2 may signal to NS3-4A that it is time to stop replicating viral genomes and to start packaging them. Thus, the NS2-NS3 interaction would supply RNAs for packaging; in the absence of proper interaction between NS2 and NS3-4A, core may accumulate on LDs due to a lack of viral RNA for packaging.
In summary, we have developed methods to image functional core protein in live cells. This system allows us to study trafficking of core protein in virus-producing cells, and revealed several novel aspects of core trafficking, including a role for interaction between NS2 and NS3-NS4A in the egress of core from the surface of LDs.
Materials and Methods
Plasmids
Plasmids pJc1 and pJc1/Gluc2A were recently described [46]. Jc1/core(TC) was constructed in multiple steps. First, the Jc1 5′ noncoding region (NCR)-core junction was amplified by using KlenTaq-LA (DNA Polymerase Technology, St. Louis, MO) with oligos YO-0021 (5′-AGA CCG TGC ACC ATG AGC TTT CTC AAT TGT TGT CCT GGC TGT TGT ATG GAA CCT AGC GGA TCC ACA AAT CCT AAA CC-3′) and YO-0028 (5′-CCA CGT GCA GCC GAA CCA-3′). The amplicon was cloned into pCR2.1-TOPO (Invitrogen, Carlsbad, CA) and sequenced. The modified 5′ NCR-core junction was then subcloned as a 767-bp ApaLI/AgeI fragment into pJc1 [46] by using common restriction sites.
pJc1/core(TC) D88 was constructed by ligating a 9193-bp ClaI fragment of pJc1/core(TC) and a 1381-bp ClaI fragment from pJc1/NS2(AP) D88 [45]. Plasmids containing NS2 mutations in a Jc1/Gluc2A background were recently described [46]. To facilitate cloning, the Gluc2A gene was inserted into pJc1/core(TC) by using common BsaBI and NotI sites. The EcoRI/MluI fragment from this plasmid was then subcloned into the same sites of Jc1/Gluc2A plasmids containing NS2 mutations, which served to simultaneously introduce the TC tag and excise the Gluc2A gene. Plasmids containing suppressor mutations were created in a similar manner.
To construct lentiviral vectors containing fluorescent protein-tagged cellular markers, pLenti4/EGFP (Invitrogen) was modified to introduce a SpeI site into the multi cloning site. This was done by annealing oligos YO-0183 (5′-GAT CCA CTA GTC TGC AGT CCG GAC-3′) and YO-0184 (5′-CAC TAG TCT GCA GTC CGG ACT CGA-3′) and ligating them into pLenti4/EGFP cut with BamHI and XhoI to create pLenti/MCS. The NheI/Bsp120I fragment from pLA4 (a kind gift of J. McLauchlan [52]) was subsequently cloned into the SpeI/Bsp120I sites of pLenti/MCS to generate pLenti/GFP-ADRP. To create a CFP-tagged version, the NheI/BsrGI fragment of pCerulean-C1 was subcloned into the XbaI/BsrGI sites of pLenti/GFP-ADRP. Fluorescent protein-tagged ADRP was shown to co-localize with anti-ADRP antibody by IF (data not shown). To construct a fluorescent protein-tagged tubulin vector, the tubulin gene was excised from pmTFP-tubulin (Allele Biotechnology, San Diego CA) by using BglII and BamHI and subcloned into the BglII site of pTagRFP-C (Evrogen, Moscow Russia) previously modified to contain a S158T mutation that enhances photostability [53]. The mTagRFP(T)-tubulin gene fusion was then excised with NheI and SacII and subcloned into the SpeI/SacII sites of pLenti/MCS to create pLenti/RFP-tubulin. To express red fluorescent protein-tagged Rab18, mTagRFP(T) was subcloned into pEGFP-Rab18 (a gift from I. Derre) by using common AgeI and BglII sites. A BamHI fragment containing the mTagRFP(T)-Rab18 fusion was then subcloned into pLenti/MCS to create pLenti/RFP-Rab18. For ER-labeling, pmTagRFP(T) was modified to introduce a signal peptide by annealing oligos YO-0412 (5′-CTA GCC GCC ACC ATG GCC CTG CTG AGC GTG CTG CTG CTG CTG GGC CTG CTG GGC CTG GCC GTG GCC AAG-3′) and YO-0413 (5′-GAT CCT TGG CCA CGG CCA GGC CCA GCA GGC CCA GCA GCA GCA GCA CGC TCA GCA GGG CCA TGG TGG CGG-3′). The plasmid was further modified to incorporate an ER retention signal (KDEL) by annealing oligos YO-0426 (5′-GAT CCC GCG CGC CAA GCT TG-3′) and YO-0415 (5′-AAT TCT CGA GTT ACA GCT CGT CCT TCT T-3′) to create pmTag/RFP-KDEL. The signal peptide-RFP-KDEL fusion was then excised by using NheI and XhoI sites and ligated into the SpeI-XhoI sites of pLenti/MCS to create pLenti/RFP-KDEL. pGalT-CFP was a kind gift of N. Altan-Bonnet.
Cell culture and reagents
Huh-7.5 (a kind gift of C.M. Rice [54]) and 293T cells were maintained in Dulbecco's modified Eagle medium (Invitrogen) containing 10% fetal calf serum (Hyclone, Waltham MA) and 1 mM nonessential amino acids (Invitrogen). Huh-7.5 cell lines expressing fluorescent-tagged proteins were derived by lentiviral transduction. Briefly, lentiviral vectors were packaged in 293T cells by using the ViraPower packaging system (Invitrogen) and used to transduce Huh-7.5 cells. Stable cell lines were selected and maintained by using standard growth medium containing 100 µg/ml Zeocin (InvivoGen, San Diego CA).
Antibodies used for immunoblotting and IF included anti-β actin (Sigma, St. Louis MO), anti-core C7-50 (Affinity BioReagents, Waltham MA), anti-E2 C1 (a kind gift of D. Burton [55]), anti-GFP (Invitrogen) and anti-NS3 (Virogen, Watertown MA). Bodipy 493/503 (Invitrogen) was used to label neutral lipids as per manufacturer's instructions. Transient transfections were performed by using TransIT LT1 (Mirus, Madison WI) or Fugene 6 (Roche, Indianapolis IN) transfection reagents according to manufacturer's instructions.
Nocodazole (Sigma) was dissolved at 25 mM in dimethylsulfoxide and diluted to 50 µM final concentration. (Z-LL)2-ketone (EMD BioSciences, Gibbstown NJ) was dissolved at 100 mM in dimethylsulfoxide and diluted to 100 µM final concentration. Cycloheximide (MP Biomedical, Costa Mesa, CA) was dissolved at 100 mM in ethanol and diluted to 30 µM final concentration. Brefeldin A (BFA; Sigma) was dissolved at 5 mg/ml in ethanol and diluted to 1 or 5 µg/ml final concentration. The amount of BFA used and the time of BFA treatment were optimized in pilot experiments by measuring Gaussia luciferase secretion (Figure S3A), virus secretion (Figure S3B), and GalT-GFP redistribution (data not shown). Oleic acid (Sigma; 400 ng/well) was added to cells 30 min prior to imaging.
HCV electroporation and infection
Cells were transfected with HCV RNA transcripts by electroporation, as previously described [56] and seeded onto coverslips in 24-well plates, or into glass-bottom plates (MatTek, Ashland MA). For infection experiments, cells were seeded onto coverslips or glass-bottom plates, and inoculated with virus at 12–24 h post seeding. Luciferase assays were performed on viral supernatants as previously described [46]. Absolute values of viral infectivity were determined by using an endpoint dilution assay as previously described [57]. Briefly, virus was serially diluted into complete growth medium and each dilution was used to infect multiple wells of a 96-well plate. Fifty percent endpoint dilutions were calculated after wells were immunostained with anti-NS5A 9E10 antibody. To measure intracellular infectivity, cells were harvested by trypsinization at 48 h post-transfection, centrifuged at 1200 rpm for 5 min, resuspended in complete medium and subject to three rounds of freezing (−196° in liquid nitrogen) and thawing (37°C). Cellular debris was removed by centrifugation at 10,000 rpm for 5 min and supernatants tested for infectivity as described above.
Isopycnic ultracentrifugation
Preformed iodixanol gradients were prepared on a Gradient Master 107 (BioComp, Fredericton, Canada) by using 10 and 40% (w/v) Optiprep (Axis-Shield,Oslo, Norway) in PBS. For equilibrium sedimentation, 1ml of each virus was layered on top of the gradient and centrifuged at 40,000 rpm for 14 h at 4°C in an SW-41rotor. Fractions (1ml) were collected from the bottom of the gradient after tube puncture with a fraction collection system (Brandel, Gaithersburg MD). Buoyant densities were determined by refractometry on a handheld refractometer (Reichert, Depew NY).
RNA quantitation
RNA was extracted from fractions or cell culture medium and quantitated using real-time reverse transcription (RT) PCR as previously described [46]. Briefly, reactions were run with the LightCycler RNA amplification.
HybProbe kit (Roche Applied Sciences, Mannheim, Germany) containing 2 µl RNA sample or RNA quantitation standards, 8 mM MgCl2, 375 nM each primer, 250 nM probe, and 1 U RNase inhibitor (United States Biochemical,Cleveland, OH). Reactions were run on a Roche LightCycler 480. Specific infectivity was calculated as the infectivity per RNA copy.
Tetracysteine labeling with biarsenical dyes
Cells were labeled with FlAsH or ReAsH reagents (Invitrogen) between 48 and 72 h post-infection or post-electroporation with Jc1/core(TC). Immediately prior to diluting, either reagent was mixed with 10 µM 1,2-ethanedithiol (EDT; Sigma). The biarsenical dye-EDT mixture was further diluted in Hanks Balanced Salt Solution (HBBS; Invitrogen) containing 1 mM sodium pyruvate (Invitrogen), 10 mM glucose (Sigma), 1 mM Patent Blue V (Sigma) and 20 µM Disperse Blue 3 (Sigma). Prior to use, Disperse Blue 3 was purified by recrystallization from toluene. After 2 brief washes in HBBS, cells were incubated with FlAsH or ReAsH-containing labeling mixture for 20 min at 37°C, then washed 3 times at 37°C for 10 min with HBSS containing 1 mM 2,3-dimercapto-1-propanol (British anti-Lewisite [BAL]; Sigma), and further washed with HBSS prior to imaging.
For dual labeling experiments, cells were labeled with 2 µM FlAsH, as described above, for 40 min. Immediately after incubation, cells were briefly rinsed once with HBSS and complete growth medium added to each dish. Cells were incubated for 2 to 24 hours, before being labeled with 0.32 µM of ReAsH, as described above, and washed with HBSS containing BAL.
Immunofluorescence
Cells seeded on coverslips were fixed with 4% paraformaldehyde (PFA) for 20 min at room temperature (RT), then washed twice in PBS containing 100 mM glycine. Cells were permeabilized and blocked in PBS containing 1% BSA (Sigma) with 0.1% saponin (Sigma). Primary antibodies (diluted in the same solution) were added for 1 to 3 h at RT before being washed off with PBS. Secondary Alexa-Fluor antibodies (488 or 568; Invitrogen) were used to label the primary signal. After 1 h incubation and washing, the coverslips were mounted on slides by using Prolong Antifade Gold reagent (Invitrogen).
Microscopy
Live cell confocal imaging was performed by using a 60× objective on a Nikon TE2000 PFS-2 microscope (Nikon, Tokyo Japan) equipped with a Perfect Focus system (Nikon), Volocity spinning disc confocal unit (Improvision, Waltham MA), and live cell chamber (37°C, 5% CO2; Pathology Devices, Westminster MD). Fixed cell fluorescence was performed by using the same instrument without the live cell chamber or Perfect Focus system. Images were edited by using Volocity (Improvision), ImageJ (NIH), or Photoshop (Adobe, San Jose CA) software. Single particle tracking was performed by using the Volocity Quantitation software package (Improvision).
Quantitation of images was performed using the Measurement function in the Volocity software package. To quantify the total number of core particles, the number of objects with volume >0.5 µm3 and pixel intensity in the FlAsH or ReAsH channel above background were counted. Background was calculated for each channel as three times the mean pixel intensity of mock-infected cells. Similar methods were used to calculate total LD numbers. LD-associated core was measured by selecting objects with volume >0.5 µm3, and pixel intensities greater than background in both the core and ADRP channels. Total core volume was estimated by summing the volume of core particles within the cell. Total cell volume was estimated by tracing the cell outline and using Volocity volume calculations. Relative core per cell was calculated by dividing total core volume by total cell volume. To calculate the surface area of LDs occupied by core, the surface area of core was determined as the sum of the voxels and expressed as a percentage of the total surface area of the LD. Co-localization was performed in ImageJ by using the Co-localization Finder and PSC Co-localization plugins as previously described [58]. Quantitations performed in Figures 3 through 5 were done in a blinded manner.
Immunoblotting
Huh-7.5 cells (seeded in 6-well plates) were washed twice with Dulbecco's PBS, lysed in 400 µl sample buffer (50 mM Tris [pH 6.8], 100 mM dithiothreitol, 2% [wt/vol] SDS, 10% [vol/vol] glycerol, 0.1% [wt/vol] bromophenol blue), and homogenized by multiple passes through 22 - and 28-gauge needles. Electrophoresis and western blotting were performed as previously described [46].
Statistical methods
Statistical analyses (unpaired Student's t-test) were performed by using Prism 4 software (GraphPad, La Jolla, CA).
Supporting Information
Zdroje
1. LindenbachBDThielHJRiceCM 2007 Flaviviridae: The viruses and their replication. KnipeDMHowleyPM Fields Virology Fifth ed. Philadelphia Lippincott-Raven Publishers 1101 1152
2. JonesDMPatelAHTargett-AdamsPMcLauchlanJ 2009 The hepatitis C virus NS4B protein can trans-complement viral RNA replication and modulates production of infectious virus. J Virol 83 2163 2177
3. MurrayCLJonesCTRiceCM 2008 Architects of assembly: roles of Flaviviridae non-structural proteins in virion morphogenesis. Nat Rev Microbiol 6 699 708
4. PhanTKohlwayADimberuPPyleAMLindenbachBD 2011 The acidic domain of hepatitis C virus NS4A contributes to RNA replication and virus particle assembly. J Virol 85 1193 1204
5. McLauchlanJ 2000 Properties of the hepatitis C virus core protein: a structural protein that modulates cellular processes. J Viral Hepat 7 2 14
6. BoulantSVanbelleCEbelCPeninFLavergneJP 2005 Hepatitis C virus core protein is a dimeric alpha-helical protein exhibiting membrane protein features. J Virol 79 11353 11365
7. BoulantSMontserretRHopeRGRatinierMTargett-AdamsP 2006 Structural determinants that target the hepatitis C virus core protein to lipid droplets. J Biol Chem 281 22236 22247
8. KoppMMurrayCLJonesCTRiceCM 2010 Genetic analysis of the carboxy-terminal region of the hepatitis C virus core protein. J Virol 84 1666 1673
9. OkamotoKMoriYKomodaYOkamotoTOkochiM 2008 Intramembrane processing by signal peptide peptidase regulates the membrane localization of hepatitis C virus core protein and viral propagation. J Virol 82 8349 8361
10. HüssyPLangenHMousJJacobsenH 1996 Hepatitis C virus core protein: carboxy-terminal boundaries of two processed species suggest cleavage by a signal peptide peptidase. Virology 224 93 104
11. BarbaGHarperFHaradaTKoharaMGoulinetS 1997 Hepatitis C virus core protein shows a cytoplasmic localization and associates to cellular lipid storage droplets. Proc Natl Acad Sci USA 94 1200 1205
12. McLauchlanJLembergMKHopeGMartoglioB 2002 Intramembrane proteolysis promotes trafficking of hepatitis C virus core protein to lipid droplets. EMBO J 21 3980 3988
13. MoradpourDEnglertCWakitaTWandsJR 1996 Characterization of cell lines allowing tightly regulated expression of hepatitis C virus core protein. Virology 222 51 63
14. BellerMThielKThulPJJackleH 2010 Lipid droplets: a dynamic organelle moves into focus. FEBS Lett 584 2176 2182
15. FareseRVJrWaltherTC 2009 Lipid droplets finally get a little R-E-S-P-E-C-T. Cell 139 855 860
16. HerkerEHarrisCHernandezCCarpentierAKaehlckeK 2010 Efficient hepatitis C virus particle formation requires diacylglycerol acyltransferase-1. Nat Med 16 1295 1298
17. BrasaemleDL 2007 Thematic review series: adipocyte biology. The perilipin family of structural lipid droplet proteins: stabilization of lipid droplets and control of lipolysis. J Lipid Res 48 2547 2559
18. FujimotoYItabeHSakaiJMakitaMNodaJ 2004 Identification of major proteins in the lipid droplet-enriched fraction isolated from the human hepatocyte cell line HuH7. Biochim Biophys Acta 1644 47 59
19. MartinSPartonRG 2008 Characterization of Rab18, a lipid droplet-associated small GTPase. Methods Enzymol 438 109 129
20. OzekiSChengJTauchi-SatoKHatanoNTaniguchiH 2005 Rab18 localizes to lipid droplets and induces their close apposition to the endoplasmic reticulum-derived membrane. J Cell Sci 118 2601 2611
21. TurroSIngelmo-TorresMEstanyolJMTebarFFernandezMA 2006 Identification and characterization of associated with lipid droplet protein 1: A novel membrane-associated protein that resides on hepatic lipid droplets. Traffic 7 1254 1269
22. MiyanariYAtsuzawaKUsudaNWatashiKHishikiT 2007 The lipid droplet is an important organelle for hepatitis C virus production. Nat Cell Biol 9 1089 1097
23. AppelNZayasMMillerSKrijnse-LockerJSchallerT 2008 Essential role of domain III of nonstructural protein 5A for hepatitis C virus infectious particle assembly. PLoS Pathog 4 e1000035
24. BoulantSTargett-AdamsPMcLauchlanJ 2007 Disrupting the association of hepatitis C virus core protein with lipid droplets correlates with a loss in production of infectious virus. J Gen Virol 88 2204 2213
25. MasakiTSuzukiRMurakamiKAizakiHIshiiK 2008 Interaction of hepatitis C virus nonstructural protein 5A with core protein is critical for the production of infectious virus particles. J Virol 82 7964 7976
26. ShavinskayaABoulantSPeninFMcLauchlanJBartenschlagerR 2007 The lipid droplet binding domain of hepatitis C virus core protein is a major determinant for efficient virus assembly. J Biol Chem 282 37158 37169
27. CocquerelLDuvetSMeunierJCPillezACacanR 1999 The transmembrane domain of hepatitis C virus glycoprotein E1 is a signal for static retention in the endoplasmic reticulum. J Virol 73 2641 2649
28. CocquerelLMeunierJCPillezAWychowskiCDubuissonJ 1998 A retention signal necessary and sufficient for endoplasmic reticulum localization maps to the transmembrane domain of hepatitis C virus glycoprotein E2. J Virol 72 2183 2191
29. HelleFVieyresGElkriefLPopescuCIWychowskiC 2010 Role of N-linked glycans in the functions of hepatitis C virus envelope proteins incorporated into infectious virions. J Virol 84 11905 11915
30. GastaminzaPKapadiaSBChisariFV 2006 Differential biophysical properties of infectious intracellular and secreted hepatitis C virus particles. J Virol 80 11074 11081
31. MukhopadhyaySKuhnRJRossmannMG 2005 A structural perspective of the flavivirus life cycle. Nat Rev Microbiol 3 13 22
32. MagnussonBAspLBostromPRuizMStillemark-BilltonP 2006 Adipocyte differentiation-related protein promotes fatty acid storage in cytosolic triglycerides and inhibits secretion of very low-density lipoproteins. Arterioscler Thromb Vasc Biol 26 1566 1571
33. MartinSDriessenKNixonSJZerialMPartonRG 2005 Regulated localization of Rab18 to lipid droplets: effects of lipolytic stimulation and inhibition of lipid droplet catabolism. J Biol Chem 280 42325 42335
34. BartenschlagerRPeninFLohmannVAndreP 2011 Assembly of infectious hepatitis C virus particles. Trends Microbiol 19 95 103
35. NoppornpanthSSmitsSLLienTXPoovorawanYOsterhausAD 2007 Characterization of hepatitis C virus deletion mutants circulating in chronically infected patients. J Virol 81 12496 12503
36. KlausnerRDDonaldsonJGLippincott-SchwartzJ 1992 Brefeldin A: insights into the control of membrane traffic and organelle structure. J Cell Biol 116 1071 1080
37. GoueslainLAlsalehKHorellouPRoingeardPDescampsV 2010 Identification of GBF1 as a cellular factor required for hepatitis C virus RNA replication. J Virol 84 773 787
38. GastaminzaPChengGWielandSZhongJLiaoW 2008 Cellular determinants of hepatitis C virus assembly, maturation, degradation, and secretion. J Virol 82 2120 2129
39. BellerMSztalrydCSouthallNBellMJackleH 2008 COPI complex is a regulator of lipid homeostasis. PLoS Biol 6 e292
40. GuoYWaltherTCRaoMStuurmanNGoshimaG 2008 Functional genomic screen reveals genes involved in lipid-droplet formation and utilization. Nature 453 657 661
41. SoniKGMardonesGASougratRSmirnovaEJacksonCL 2009 Coatomer-dependent protein delivery to lipid droplets. J Cell Sci 122 1834 1841
42. GaiettaGDeerinckTJAdamsSRBouwerJTourO 2002 Multicolor and electron microscopic imaging of connexin trafficking. Science 296 503 507
43. JiraskoVMontserretRLeeJYGouttenoireJMoradpourD 2010 Structural and functional studies of nonstructural protein 2 of the hepatitis C virus reveal its key role as organizer of virion assembly. PLoS Path 6 e1001233
44. MaYAnantpadmaMTimpeJMShanmugamSSinghSM 2011 Hepatitis C virus NS2 protein serves as a scaffold for virus assembly by interacting with both structural and nonstructural proteins. J Virol 85 86 97
45. StaplefordKALindenbachBD 2011 Hepatitis C Virus NS2 Coordinates Virus Particle Assembly through Physical Interactions with the E1-E2 Glycoprotein and NS3-NS4A Enzyme Complexes. J Virol 85 1706 1717
46. PhanTBeranRKPetersCLorenzICLindenbachBD 2009 Hepatitis C virus NS2 protein contributes to virus particle assembly via opposing epistatic interactions with the E1-E2 glycoprotein and NS3-NS4A enzyme complexes. J Virol 83 8379 8395
47. OhsakiYChengJFujitaATokumotoTFujimotoT 2006 Cytoplasmic lipid droplets are sites of convergence of proteasomal and autophagic degradation of apolipoprotein B. Mol Biol Cell 17 2674 2683
48. GriffinBAAdamsSRJonesJTsienRY 2000 Fluorescent labeling of recombinant proteins in living cells with FlAsH. Methods Enzymol 327 565 578
49. BoulantSDouglasMWMoodyLBudkowskaATargett-AdamsP 2008 Hepatitis C virus core protein induces lipid droplet redistribution in a microtubule - and Dynein-dependent manner. Traffic 9 1268 1282
50. LynRKKennedyDCStolowARidsdaleAPezackiJP 2010 Dynamics of lipid droplets induced by the hepatitis C virus core protein. Bioch Biophys Res Comm 399 518 524
51. LaiCKJengKSMachidaKLaiMM 2010 Hepatitis C virus egress and release depend on endosomal trafficking of core protein. J Virol 84 11590 11598
52. Targett-AdamsPChambersDGledhillSHopeRGCoyJF 2003 Live cell analysis and targeting of the lipid droplet-binding adipocyte differentiation-related protein. J Biol Chem 278 15998 16007
53. ShanerNCLinMZMcKeownMRSteinbachPAHazelwoodKL 2008 Improving the photostability of bright monomeric orange and red fluorescent proteins. Nat Methods 5 545 551
54. BlightKJMcKeatingJARiceCM 2002 Highly permissive cell lines for subgenomic and genomic hepatitis C virus RNA replication. J Virol 76 13001 13014
55. LawMMaruyamaTLewisJGiangETarrAW 2008 Broadly neutralizing antibodies protect against hepatitis C virus quasispecies challenge. Nat Med 14 25 27
56. LindenbachBDEvansMJSyderAJWolkBTellinghuisenTL 2005 Complete replication of hepatitis C virus in cell culture. Science 309 623 626
57. LindenbachBD 2009 Measuring HCV infectivity produced in cell culture and in vivo. Methods Mol Biol 510 329 336
58. FrenchAPMillsSSwarupRBennettMJPridmoreTP 2008 Colocalization of fluorescent markers in confocal microscope images of plant cells. Nat Protoc 3 619 628
Štítky
Hygiena a epidemiologie Infekční lékařství LaboratořČlánek vyšel v časopise
PLOS Pathogens
2011 Číslo 10
- Farmakovigilanční studie perorálních antivirotik indikovaných v léčbě COVID-19
- Jak souvisí postcovidový syndrom s poškozením mozku?
- Měli bychom postcovidový syndrom léčit antidepresivy?
- 10 bodů k očkování proti COVID-19: stanovisko České společnosti alergologie a klinické imunologie ČLS JEP
Nejčtenější v tomto čísle
- Severe Acute Respiratory Syndrome Coronavirus Envelope Protein Regulates Cell Stress Response and Apoptosis
- The SARS-Coronavirus-Host Interactome: Identification of Cyclophilins as Target for Pan-Coronavirus Inhibitors
- Biochemical and Structural Insights into the Mechanisms of SARS Coronavirus RNA Ribose 2′-O-Methylation by nsp16/nsp10 Protein Complex
- Evolutionarily Divergent, Unstable Filamentous Actin Is Essential for Gliding Motility in Apicomplexan Parasites