
Genome-Wide Association Study Identifies Two Novel Regions at 11p15.5-p13 and 1p31 with Major Impact on Acute-Phase Serum Amyloid A
Elevated levels of acute-phase serum amyloid A (A-SAA) cause amyloidosis and are a risk factor for atherosclerosis and its clinical complications, type 2 diabetes, as well as various malignancies. To investigate the genetic basis of A-SAA levels, we conducted the first genome-wide association study on baseline A-SAA concentrations in three population-based studies (KORA, TwinsUK, Sorbs) and one prospective case cohort study (LURIC), including a total of 4,212 participants of European descent, and identified two novel genetic susceptibility regions at 11p15.5-p13 and 1p31. The region at 11p15.5-p13 (rs4150642; p = 3.20×10−111) contains serum amyloid A1 (SAA1) and the adjacent general transcription factor 2 H1 (GTF2H1), Hermansky-Pudlak Syndrome 5 (HPS5), lactate dehydrogenase A (LDHA), and lactate dehydrogenase C (LDHC). This region explains 10.84% of the total variation of A-SAA levels in our data, which makes up 18.37% of the total estimated heritability. The second region encloses the leptin receptor (LEPR) gene at 1p31 (rs12753193; p = 1.22×10⁻¹¹) and has been found to be associated with CRP and fibrinogen in previous studies. Our findings demonstrate a key role of the 11p15.5-p13 region in the regulation of baseline A-SAA levels and provide confirmative evidence of the importance of the 1p31 region for inflammatory processes and the close interplay between A-SAA, leptin, and other acute-phase proteins.
Published in the journal:
. PLoS Genet 6(11): e32767. doi:10.1371/journal.pgen.1001213
Category:
Research Article
doi:
https://doi.org/10.1371/journal.pgen.1001213
Summary
Elevated levels of acute-phase serum amyloid A (A-SAA) cause amyloidosis and are a risk factor for atherosclerosis and its clinical complications, type 2 diabetes, as well as various malignancies. To investigate the genetic basis of A-SAA levels, we conducted the first genome-wide association study on baseline A-SAA concentrations in three population-based studies (KORA, TwinsUK, Sorbs) and one prospective case cohort study (LURIC), including a total of 4,212 participants of European descent, and identified two novel genetic susceptibility regions at 11p15.5-p13 and 1p31. The region at 11p15.5-p13 (rs4150642; p = 3.20×10−111) contains serum amyloid A1 (SAA1) and the adjacent general transcription factor 2 H1 (GTF2H1), Hermansky-Pudlak Syndrome 5 (HPS5), lactate dehydrogenase A (LDHA), and lactate dehydrogenase C (LDHC). This region explains 10.84% of the total variation of A-SAA levels in our data, which makes up 18.37% of the total estimated heritability. The second region encloses the leptin receptor (LEPR) gene at 1p31 (rs12753193; p = 1.22×10⁻¹¹) and has been found to be associated with CRP and fibrinogen in previous studies. Our findings demonstrate a key role of the 11p15.5-p13 region in the regulation of baseline A-SAA levels and provide confirmative evidence of the importance of the 1p31 region for inflammatory processes and the close interplay between A-SAA, leptin, and other acute-phase proteins.
Introduction
Serum amyloid A (SAA) is a sensitive marker of the acute inflammatory state. Its isoforms are expressed constitutively (C-SAA) and show a rapid (up to 1000-fold) increased expression in response to inflammatory stimuli such as trauma, infection, injury, and stress during the acute phase (A-SAA) [1]. The high inductive capacity along with a high conservation of genes and proteins throughout evolution of vertebrates and invertebrates suggests that A-SAA plays a key role in pathogen defence and probably functions as an immune-effector molecule [1]. Acute inflammation has mainly beneficial effects in restoring homeostasis. However, in recent years, clinical and epidemiological studies have gathered substantial evidence that A-SAA is associated with obesity [2] and that prolonged and recurrent chronic infection as well as inflammation is causally involved in the pathogeneses of amyloidosis [1]. Furthermore, it induces, promotes, or influences susceptibility to several chronic diseases such as atherosclerosis and its clinical complications [3]–[9], type 2 diabetes [10], [11], and various malignancies [12]. The SAA gene family is located within 150 kb at chromosome 11 and comprises of four genes: SAA1 and SAA2, the bona fide acute-phase SAA isoforms, SAA3, a pseudogene in humans, and SAA4, a low level expressed gene coding for C-SAA [13], [14]. A-SAA expression is regulated by a variety of stimuli, including the pro-inflammatory cytokines TNF-α and IL-6, as well as glucocorticoids [15], [16]. Like other acute-phase proteins, A-SAA is expressed primarily by the liver [17]. However, extra-hepatic expression has been reported for different cell lines like epithelial cells, monocyte and macrophage cells, most endothelial cells, adipocytes, atherosclerotic lesions, and smooth muscle cells [17]. Twin studies suggest a substantial genetic contribution to baseline A-SAA concentrations with heritability estimates of 59% (95% confidence interval, 49–67%) [18]. The identification of genetic variants that are predisposed to elevated levels of A-SAA could provide important clues to the immune response pathways involved in the regulation of A-SAA levels which might also be of relevance for related clinical entities. In the past, association analyses between genetic variants and A-SAA levels were limited and restricted to allelic variants of SAA genes and protein concentrations [19]–[21].
We therefore conducted the first genome-wide association study on baseline A-SAA concentrations. In a meta-analysis of four genome-wide scans (KORA S4, LURIC, TwinsUK and Sorbs) we included 4,212 participants of European descent. Additionally, in order to account for known gender-specific differences in the regulation of A-SAA [22], [23] we stratified the analysis by gender.
Results
In the present meta-analysis of four genome wide scans 106 SNPs distributed across two regions showed genome-wide significant associations with p-values below the threshold of 5×10⁻⁸ (Figure 1, Table S1). Table 1 shows study specific results for the top hits within the two regions and three identified subregions (see below) of the meta-analysis as well as an additional region for men in the gender stratified analysis. Genotypic mean levels are provided in Table S2. Results of the single genome-wide studies were consistent across all four studies regarding the direction and magnitude of the effects. In addition, results were consistent between different genotyping technologies (Table S3). No deviations from the Hardy-Weinberg-Equilibrium were observed. The variable of inter-study heterogeneity (I2) showed homogeneity at the 1p31 locus. At the 11p15.5-p13 locus we observed I2 values that indicated a more distinct heterogeneity. This reflects the relatively large and varying beta values and differences in the minor allele frequency (Table S1). However, taking into account that this locus was clearly significantly associated with A-SAA in all studies included in the meta-analysis, results of the meta-analysis are reported based on a fixed effect model.
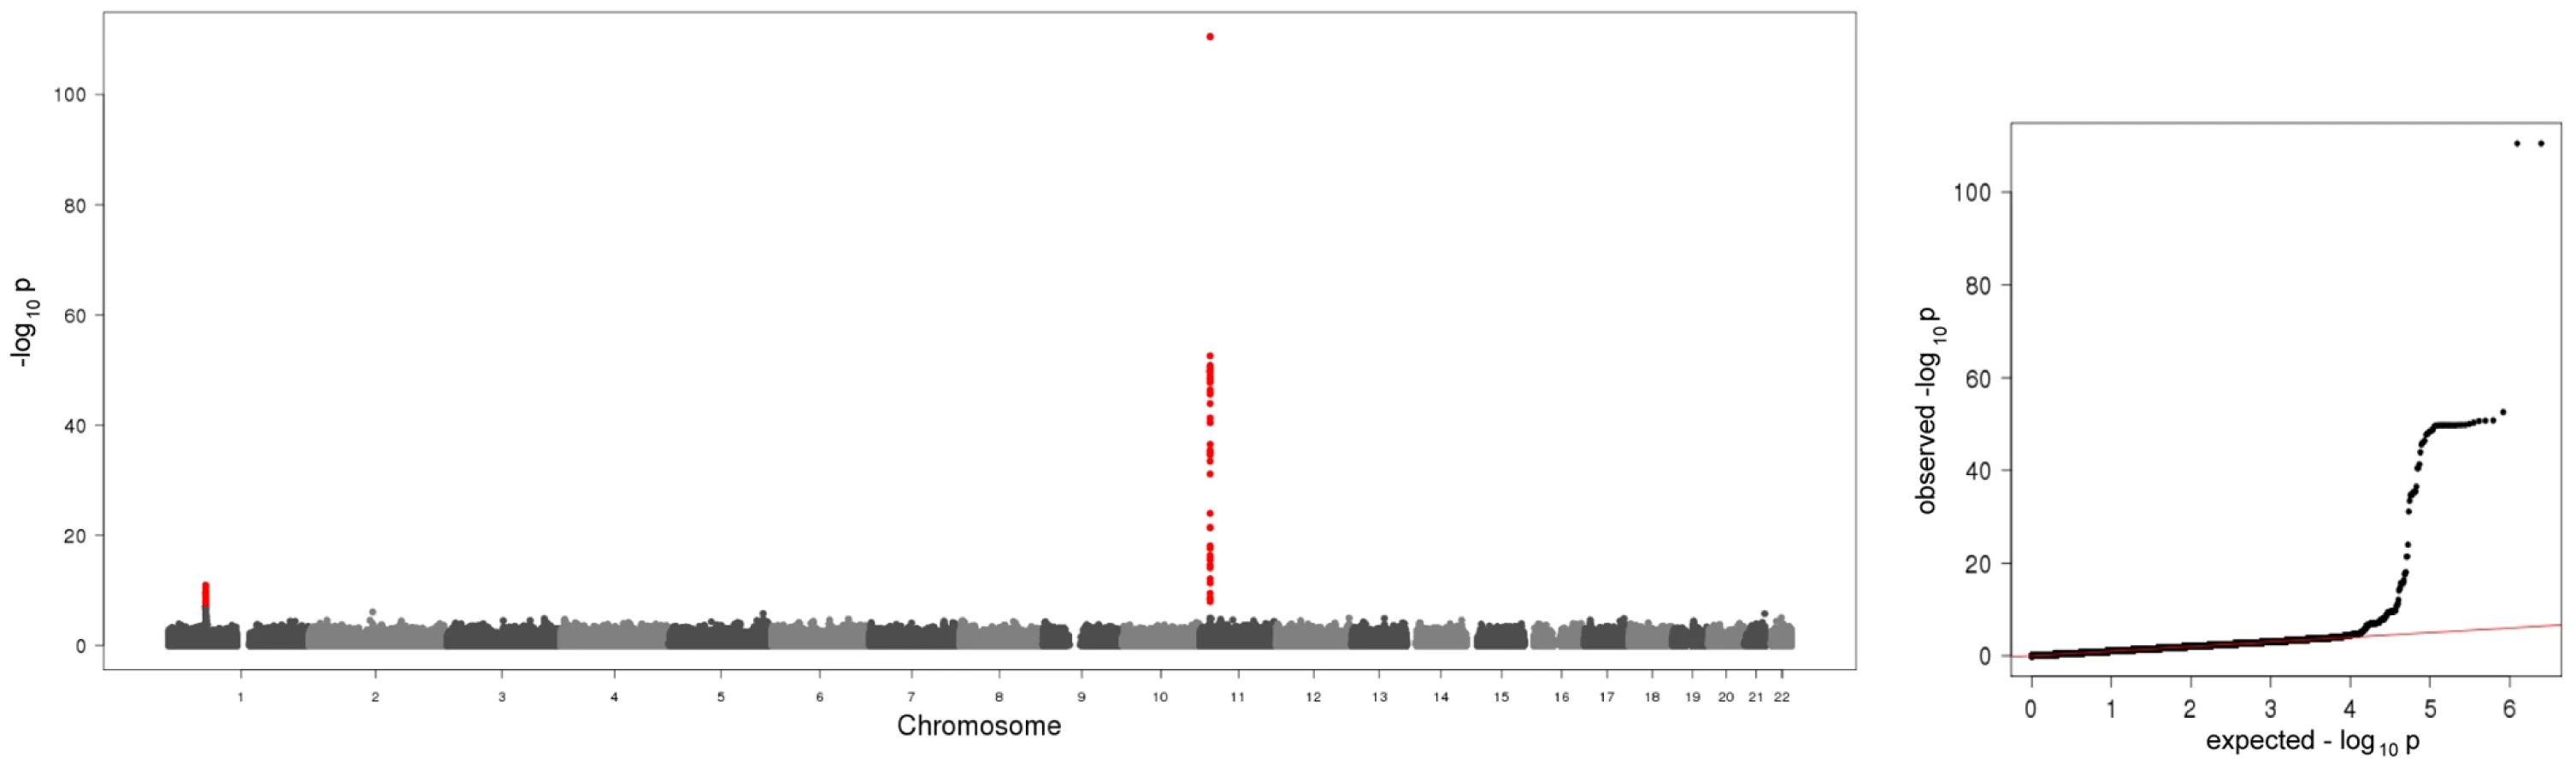
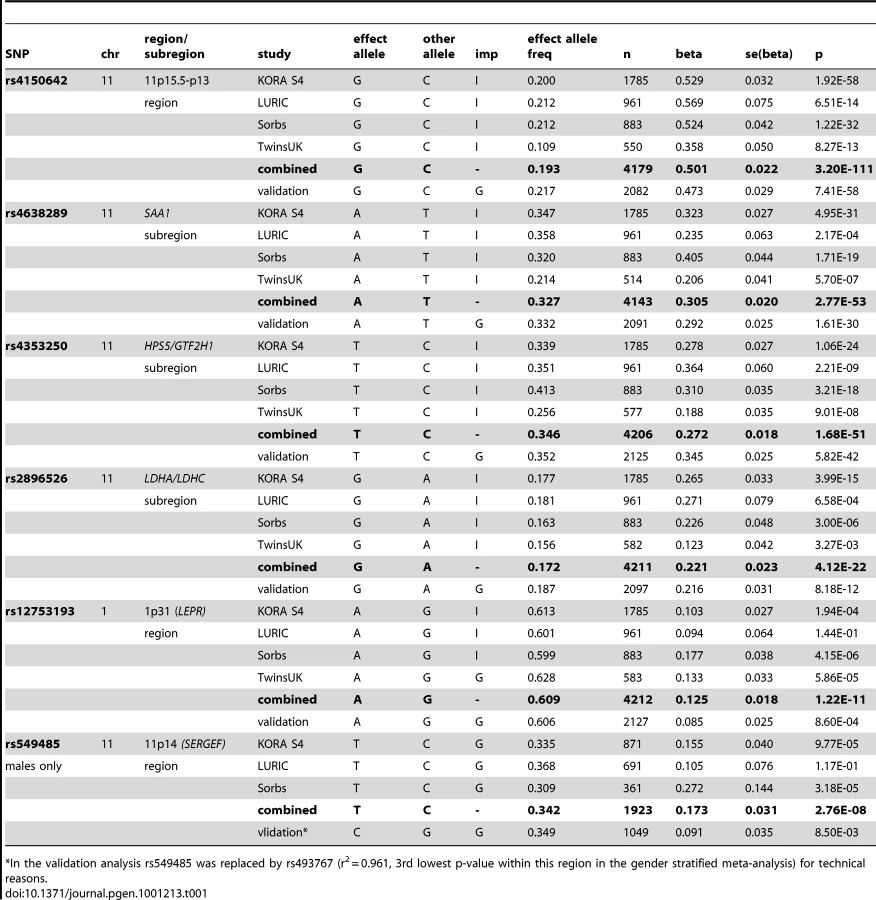
The first region (193.3 kb of length) resides at 11p15.5-p13 and includes SAA1 one of the structure genes of A-SAA. Within this region the strongest association was found for two highly correlated intronic polymorphisms of the general transcription factor 2 H1 (GTF2H1) gene, rs4150642 (p = 3.20×10−111) and rs7103375 (p = 3.26×10−111) (Figure 2A). These two top hits show modest correlation (r2≤0.376) with other significantly associated SNPs within this region. When the structure of correlation and explained variances within the region were analysed three mostly independent subregions were identified (Table S4, Figure 2B–2D). The first subregion encloses the 5′ end of SAA1 (Figure 2B) with strongest association for rs4638289 (p = 2.77×10−53). The other two subregions harbour the genes Hermansky-Pudlak Syndrome 5 (HPS5) and GTF2H1 (Figure 2C) and lactate dehydrogenase A and C (LDHA and LDHC) (Figure 2D) with strongest associations for rs4353250 (p = 1.68×10−51) and rs2896526 (p = 4.12×10⁻²²), two intronic polymorphisms of HPS5 and LDHA, respectively.

The second region was detected at 1p31 (Figure 2E). All 38 significantly associated variants cluster around the 3′ end of the leptin receptor gene (LEPR). The most significantly associated SNP, rs12753193, (p = 1.22×10⁻¹¹) is located downstream of LEPR.
All associations were consistent in the KORA S4 validation analyses (Table 1 for the top hits, Table S5 for all SNPs selected for validation).
The entire regression model (including the top SNPs of the two genomic regions (rs4150642 and rs12753193), age, gender and BMI) explains 19.32% of the total variation of A-SAA in our data. With an explained variance of 10.84% for the top SNP (rs4150642) of the 11p15.5-p13 locus (5.57% for rs4638289 of the SAA1 subregion, 5.34% for rs4353250 of the HPS5/GTF2H1 subregion, and 2.37% for rs2896526 of the LDHA/LDHC subregion; Table S4) and 0.93% for the top SNP (rs12753193) of the 1p31 locus the identified genomic regions account for a major part of such variance.
When the analysis was stratified by gender, one additional SNP (rs549485) located about 350 kb apart from the SAA1 subregion at 11p14 in the secretion regulating guanine nucleotide exchange factor (SERGEF) gene showed a borderline significant association with A-SAA levels in men (p = 2.76×10⁻⁸) in the meta-analysis. In the validation analysis the association between two highly correlated SNPs within this region (rs493767 and rs550659, r2 = 0.961) and A-SAA levels was also borderline significant (p = 8.50×10⁻³ and p = 1.65×10⁻², respectively). No significant differences between men and women were found within the regions identified in the overall meta-analysis (data not shown).
Discussion
Based on a meta-analysis of four genome-wide association studies including 4,212 participants of European descent two novel genetic susceptibility regions were identified to be associated with baseline A-SAA concentrations. With 11.68% explained variance in our data, which makes up 19.76% of the total estimated heritability of 59%, these two regions seem to have a major impact on baseline A-SAA concentrations. The region at 11p15.5-p13 accounts for most of the explained variance. Its SAA1 subregion contains part of a highly conserved region between the two bona fide acute-phase structure genes SAA1 and SAA2, which consist of at least 5 and 2 allelic variants, respectively [1], [24]. These two genes are concurrently induced during the acute-phase [1], and cluster within 18 kb of each other in a head to head arrangement [25]. This study is the first presenting the complex genetic architecture of A-SAA levels at this locus. In the identified region, there has been evidence of regulatory elements like C/EBPalpha and C/EBPbeta (http://genome.ucsc.edu), which are necessary for the full responsiveness to IL-1β and IL-6 either alone or in combination [1]. Our finding underlines the high functional potential for this region.
The adjacent GTF2H1 is a basal transcription factor involved in nucleotide excision repair of DNA and RNA transcription by RNA polymerase II [26]. HPS5 encodes a protein, which is probably involved in organelle biogenesis associated with melanosomes and platelet dense granule, its mutations lead to a homonymous clinical entity [27]. And LDHA and LDHC, which are expressed in muscle tissue and in testes, respectively, encode for lactate dehydrogenase, an enzyme that catalyzes the interconversion of lactate and pyruvate [28].
Variants of the GTF2H1 gene have been recently found to be associated with lung cancer in a Chinese population [29]. Furthermore, it was demonstrated that LDHA is involved in tumour genecity and its reduction causes bioenergetic and oxidative stress leading to cell death [30]–[32]. Finally, Kosolowski et al. [33] found LDHC to be expressed in several types of tumour cell lines. It is thought, that recurrent or persistent chronic inflammation may play a role in carcinogenesis by causing DNA damage, inciting tissue reparative proliferation and/or by creating an environment that is enriched with tumour-promoting cytokines and growth factors [12]. Furthermore, SAA synthesis could be found in human carcinoma metastases and cancer cell lines [17].
As the approach taken in this study is observational in nature it is not possible to draw causal inferences. For that reason, it could be possible that not genes, but small regulatory elements may be responsible for the findings. This is most likely the case as the identified region contains one structure gene and the adjacent region. In any case, the major impact on baseline A-SAA concentrations demonstrates a key role of the 11p15.5-p13 region in the regulation of inflammation. Therefore, the identification of causal variants and their impact on diseases related to elevated baseline A-SAA concentrations represent promising targets for future functional and epidemiological studies.
The second region was found on chromosome 1p31, harbouring the LEPR gene locus. Leptin, an important circulating signal for the regulation of body weight, was found to be correlated with SAA concentrations independently of BMI, and both were expressed in adipose tissue [34]. In the KORA F3 study (Text S1) a moderate but significant correlation was found between circulating A-SAA and leptin concentrations in blood in 181 participants with measurements of both proteins (Spearman correlation = 0.25, p = 7×10⁻⁴). So far it is unclear whether leptin influences SAA expression directly or via the leptin stimulated cytokines, IL-6 and TNF-α [34]. LEPR is a single transmembrane receptor of the cytokine receptor family most related to the gp130 signal-transducing component of the IL-6 receptor, the granulocyte colony-stimulating factor (GCSF) receptor, and the Leukaemia Inhibitory Factor (LIF) receptor, all of which are thought to play an essential role in the inflammatory process [35], [36]. Previous studies have provided evidence of an association of the LEPR gene locus with CRP and fibrinogen [37]–[40], which were both correlated with A-SAA in the KORA S4 study (Text S1) (CRP: Spearman correlation = 0.58, p = 3.22×10−155, and fibrinogen: Spearman correlation = 0.31, p = 3.89×10−41; N = 1734). The finding gives confirmative evidence of the importance of the LEPR gene locus for inflammatory processes and the close relationship between leptin, A-SAA, CRP and fibrinogen.
Furthermore, in the gender stratified analysis one region containing SERGEF was identified to be presumably associated with A-SAA in men. The adjacency of this identified region to the SAA gene family suggests that regulatory elements may be responsible for this signal. However, the association with A-SAA levels was only borderline significant in our study and therefore awaits replication.
Two limitations of our study have to be mentioned. Firstly, due to the restrictions in laboratory methods our analyses were confined to the A-SAA isoforms and did not capture the constitutively expressed C-SAA isoform which might also be of interest, especially when analyzing baseline SAA levels. Secondly, the number of studies with genome-wide data and measured A-SAA levels was limited compared to other genome-wide association studies. Nevertheless, the study had enough power to detect two novel genetic susceptibility regions for A-SAA which explain 19.76% of the total estimated heritability already. Furthermore, results were consistent across all four studies and within different genotyping platforms, the regions are biologically highly plausible, and the results may contribute to future research on the regulation of inflammatory response and its role in related clinical entities.
Taken together, the present meta-analysis is the first whole genome approach to identify genetic variants that are associated with baseline A-SAA concentrations. Two novel genetic susceptibility regions were identified to be associated with baseline A-SAA concentrations. The findings demonstrate a major impact of the 11p15.5-p13 gene region on the regulation of inflammation and suggest a close interplay between leptin, A-SAA, and other acute-phase proteins as well as a larger role of the LEPR gene locus in inflammatory processes as it has been assumed in the past.
Materials and Methods
Participating studies
The present meta-analysis combined data from four genome-wide scans: one survey of the Cooperative Health Research in the Region of Augsburg (KORA S4), the Ludwigshafen Risk and Cardiovascular Health study (LURIC), the UK Adult Twin Register (TwinsUK) and a self-contained population from Eastern Germany (Sorbs) (). Approval was obtained by each of the local Ethic Committees for all studies and written informed consent was given by all study participants. In total, the meta-analysis included 4,212 individuals (1,928 males, 2,284 females) of European ancestry with measured baseline A-SAA concentrations. For validation analyses we used data of 2,136 participants of the KORA S4 sample, which were not included in the meta-analysis (Text S1). Sample sizes and characteristics of the study participants of the four genome-wide scans and the validation sample are displayed in Table S6.
Measurement of A-SAA concentrations
In all four studies, study participants were fasting and EDTA plasma samples were analyzed by immunonephelometry on a BNAII device from Siemens, Germany, and well-validated automated microparticle capture enzyme immunoassays [10], [41]. The inter-assay coefficients of variation were below 7% in all four studies.
Genome-wide genotyping and imputation
For genotyping different platforms as the Affymetrix 500K GeneChip array (Sorbs), Affymetrix 6.0 GeneChip array (KORA S4, LURIC, Sorbs), Illumina HumanHap300 BeadChip (317K) (TwinsUK) and Illumina Human 610K BeadChip (TwinsUK) were used. Quality control before imputation was undertaken in each study separately. Detailed information on genotyping and imputation is reported in Table S7. Imputation based on the HapMap Phase 2 CEU population was performed using IMPUTE [42] in all studies. After imputation all genotype data had to meet the following quality criteria: a minor allele frequency ≥0.01, a call rate per SNP ≥0.9, and r2.hat metrics ≥0.40 for imputed SNPs. In total, 2,593,456 genotyped or imputed autosomal SNPs were analyzed in the meta-analysis.
For validation and comparison of genotyping platforms, we selected 27 of the most significantly associated SNPs. Genotyping of these SNPs was performed with the MassARRAY system using the iPLEX technology (Sequenom, San Diego, CA) in the KORA S4 study. The allele-dependent primer extension products were loaded onto one 384-element chip using a nanoliter pipetting system (SpectroCHIP, Spectro-POINT Spotter; Sequenom), and the samples were analyzed by matrix-assisted laser desorption-ionization time-of-flight mass spectrometry (Bruker Daltonik, Leipzig, Germany). The resulting mass spectra were analyzed for peak identification via the SpectroTYPER RT 3.4 software (Sequenom). To control for reproducibility, 9.8% of samples was genotyped in duplicate with a discordance rate of less than 0.5%.
Genome-wide association analyses and meta-analysis
In each study, linear regression models for all available SNPs have been calculated on ln-transformed A-SAA levels in mg/l. The genetic effect has been assumed to be additive. Adjustment has been made for age, gender, BMI, and study specific covariates, i.e. the Friesinger Score in the LURIC population [43] and a genotyping batch variable in the TwinsUK population. Additionally, this analysis was undertaken stratified by gender. The genome-wide scans were calculated with the analysis software SNPTEST (http://www.stats.ox.ac.uk/~marchini/software/gwas/snptest.html) (KORA S4, LURIC) QUICKTEST (http://toby.freeshell.org/software/quicktest.shtml) (Sorbs) and Merlin (http://www.sph.umich.edu/csg/abecasis/Merlin/) (TwinsUK).
The results of all four genome-wide scans were meta-analysed using a fixed-effects model applying inverse variance weighting with the METAL software (www.sph.umich.edu/csg/abecasis/metal). Study specific results were corrected for population stratification using the genomic control method. For the overall meta-analysis, the inflation factor was 1.009. No further correction was applied.
P-values below the threshold of p = 5×10⁻⁸, which corresponds to a Bonferroni correction for the estimated number of one million tests for independent common variants in the human genome of European individuals [44], were considered to be significant.
As a measure for between study heterogeneity I2 was calculated [45]. Deviations from Hardy-Weinberg-Equilibrium were tested for all identified SNPs by means of the exact Hardy Weinberg test. For the calculation of explained variances, we subtracted the multiple R2 value of the covariate model from those of the full model including covariates and top hits of the loci in every single study and assessed the weighted mean (KORA S4, LURIC, and the Sorbs). We tested adjacent regions for independency by analyzing the significance of their top SNPs in a joint model.
Accession numbers
The OMIM (http://www.ncbi.nlm.nih.gov/omim) accession numbers for genes mentioned in this article are 104750 for SAA1, 607521 for HPS5, 189972 for GTF2H1, 150000 for LDHA, 150150 for LDHC, 601007 for LEPR, and 606051 for SERGEF.
Supporting Information
Zdroje
1. UhlarCM
WhiteheadAS
1999 Serum amyloid A, the major vertebrate acute-phase reactant. Eur J Biochem 265 501 523
2. ZhaoY
HeX
ShiX
HuangC
LiuJ
2010 Association between serum amyloid A and obesity: a meta-analysis and systematic review. Inflamm Res 59 323 334
3. SchillingerM
ExnerM
MlekuschW
SabetiS
AmighiJ
2005 Inflammation and Carotid Artery—Risk for Atherosclerosis Study (ICARAS). Circulation 111 2203 2209
4. JohnsonBD
KipKE
MarroquinOC
RidkerPM
KelseySF
2004 Serum amyloid A as a predictor of coronary artery disease and cardiovascular outcome in women: the National Heart, Lung, and Blood Institute-Sponsored Women's Ischemia Syndrome Evaluation (WISE). Circulation 109 726 732
5. MaierW
AltweggLA
CortiR
GayS
HersbergerM
2005 Inflammatory markers at the site of ruptured plaque in acute myocardial infarction: locally increased interleukin-6 and serum amyloid A but decreased C-reactive protein. Circulation 111 1355 1361
6. FyfeAI
RothenbergLS
DeBeerFC
CantorRM
RotterJI
1997 Association between serum amyloid A proteins and coronary artery disease: evidence from two distinct arteriosclerotic processes. Circulation 96 2914 2919
7. DaneshJ
WhincupP
WalkerM
LennonL
ThomsonA
2000 Low grade inflammation and coronary heart disease: prospective study and updated meta-analyses. BMJ 321 199 204
8. RidkerPM
RifaiN
PfefferMA
SacksFM
MoyeLA
1998 Inflammation, pravastatin, and the risk of coronary events after myocardial infarction in patients with average cholesterol levels. Cholesterol and Recurrent Events (CARE) Investigators. Circulation 98 839 844
9. KinlayS
SchwartzGG
OlssonAG
RifaiN
SzarekM
2008 Myocardial Ischemia Reduction with Aggressive Cholesterol Lowering (MIRACL) Study Investigators. Inflammation, statin therapy, and risk of stroke after anacute coronary Syndrome in the MIRACL study. Arterioscler Thromb Vasc Biol 28 142 147
10. MüllerS
MartinS
KoenigW
Hanifi-MoghaddamP
RathmannW
2002 Impaired glucose tolerance is associated with increased serum concentrations of interleukin 6 and co-regulated acute-phase proteins but not TNF-α or its receptors. Diabetologia 45 805 812
11. YangR-Z
LeeM-J
HuH
PollinTI
RyanAS
2006 Acute-phase serum amyloid A: an inflammatory adipokine and potential link between obesity and its metabolic complications. PLoS Med 3 e287 doi:10.1371/journal.pmed.0030287
12. MalleE
Sodin-SemrlS
KovacevicA
2009 Serum amyloid A: an acute-phase protein involved in tumour pathogenesis. Cell Mol Life Sci 66 9 26
13. SellarGC
JordanSA
BickmoreWA
FantesJA
van HeyningenV
1994 The human serum amyloid A protein (SAA) superfamily gene cluster: mapping to chromosome 11p15.1 by physical and genetic linkage analysis. Genomics 19 221 227
14. SellarGC
OgheneK
BoyleS
BickmoreWA
WhiteheadAS
1994 Organization of the region encompassing the human serum amyloid A (SAA) gene family on chromosome 11p15.1. Genomics 23 492 495
15. ThornCF
LuZY
WhiteheadAS
2004 Regulation of the human acute-phase serum amyloid A genes by tumour necrosis factor-α, interleukin-6 and glucocorticoids in hepatic and epithelial cell lines. Scand J Immunol 59 152 158
16. JensenLE
WhiteheadAS
1998 Regulation of serum amyloid A protein expression during the acute-phase response. Biochem J 334 489 503
17. Urieli-ShovalS
LinkeRP
MatznerY
2000 Expression and function of serum amyloid A, a major acute-phase protein, in normal and disease states. Curr Opin Hematol 7 64 69
18. MacGregorAJ
GallimoreJR
SpectorTD
PepysMB
2004 Genetic effects on baseline values of C-reactive protein and serum amyloid a protein: a comparison of monozygotic and dizygotic twins. Clin Chem 50 130 134
19. YamadaT
WadaA
ItohY
ItohK
1999 Serum amyloid A1 alleles and plasma concentrations of serum amyloid A. Amyloid 6 199 204
20. BoothDR
BoothSE
GillmoreJD
HawkinsPN
PepysMB
1998 SAA1 alleles as risk factors in reactive systemic AA amyloidosis. Amyloid 5 262 265
21. BakkalogluA
DuzovaA
OzenS
BalciB
BesbasN
2004 Influence of Serum Amyloid A (SAA1) and SAA2 gene polymorphisms on renal amyloidosis, and on SAA/C-reactive protein values in patients with familial mediterranean fever in the Turkish population. J Rheumatol 31 1139 1142
22. SjöholmK
LundgrenM
OlssonM
ErikssonJW
2009 Association of serum amyloid A levels with adipocyte size and serum levels of adipokines: differences between men and women. Cytokine 48 260 266
23. ThorandB
BaumertJ
DöringA
HerderC
KolbH
2006 Sex differences in the relation of body composition to markers of inflammation. Atherosclerosis 184 216 224
24. SipeJ
1999 Revised nomenclature for serum amyloid A (SAA). Nomenclature Committee of the International Society of Amyloidosis. Part 2. Amyloid 6 67 70
25. Kluve-BeckermanB
SongM
1995 Genes encoding human serum amyloid A proteins SAA1 and SAA2 are located 18 kb apart in opposite transcriptional orientations. Gene 159 289 290
26. OrphanidesG
LagrangeT
ReinbergD
1996 The general transcription factors of RNA polymerase II. Genes Dev 10 2657 2683
27. HuizingM
HessR
DorwardH
ClaassenDA
Helip-WooleyA
2004 Cellular, molecular and clinical characterization of patients with Hermansky-Pudlak syndrome type 5. Traffic 5 711 722
28. CoriCF
1981 The glucose-lactic acid cycle and gluconeogenesis. Curr Top Cell Regul 18 377 387
29. WuW
LiuH
LeiR
ChenD
ZhangS
2008 Genetic variants in GTF2H1 and risk of lung cancer: a case-control analysis in a Chinese population. Lung Cancer 63 180 186
30. FantinVR
St-PierreJ
LederP
2006 Attenuation of LDH-A expression uncovers a link between glycolysis, mitochondrial physiology, and tumor maintenance. Cancer Cell 9 425 434
31. XieH
ValeraVA
MerinoMJ
AmatoAM
SignorettiS
2009 LDH-A inhibition, a therapeutic strategy for treatment of hereditary leiomyomatosis and renal cell cancer. Mol Cancer Ther 8 626 635
32. LeA
CooperCR
GouwAM
DinavahiR
MaitraA
2010 Inhibition of lactate dehydrogenase A induces oxidative stress and inhibits tumor progression. Proc Natl Acad Sci U S A 107 2037 2042
33. KoslowskiM
TüreciO
BellC
KrauseP
LehrHA
2002 Multiple splice variants of lactate dehydrogenase C selectively expressed in human cancer. Cancer Res 62 6750 6755
34. LappalainenT
KolehmainenM
SchwabU
PulkkinenL
LaaksonenDE
2008 Serum concentrations and expressions of serum amyloid A and leptin in adipose tissue are interrelated: the Genobin Study. Eur J Endocrinol 158 333 341
35. TartagliaLA
DembskiM
WengX
DengN
CulpepperJ
1995 Identification and expression cloning of a leptin receptor, OB-R. Cell 83 1263 1271
36. TartagliaLA
1997 The leptin receptor. J Biol Chem 272 6093 6096
37. ElliottP
ChambersJC
ZhangW
ClarkeR
HopewellJC
2009 Genetic Loci associated with C-reactive protein levels and risk of coronary heart disease. JAMA 302 37 48
38. ZhangYY
GottardoL
MlynarskiW
FrazierW
NolanD
2007 Genetic variability at the leptin receptor (LEPR) locus is a determinant of plasma fibrinogen and C-reactive protein levels. Atherosclerosis 191 121 127
39. RidkerPM
PareG
ParkerA
ZeeRY
DanikJS
2008 Loci related to metabolic-syndrome pathways including LEPR,HNF1A, IL6R, and GCKR associate with plasma C-reactive protein: the Women's Genome Health Study. Am J Hum Genet 82 1185 1192
40. SabattiC
ServiceSK
HartikainenAL
PoutaA
RipattiS
2009 Genome-wide association analysis of metabolic traits in a birth cohort from a founder population. Nat Genet 41 35 46
41. WilkinsJ
GallimoreJR
TennentGA
HawkinsPN
LimburgPC
1994 Rapid automated enzyme immunoassay of serum amyloid A. Clin Chem 40 1284 1290
42. MarchiniJ
HowieB
MyersS
McVeanG
DonnellyP
2007 A new multipoint method for genome-wide association studies by imputation of genotypes. Nat Genet 39 906 913
43. FriesingerGC
PageEE
RossRS
1970 Prognostic significance of coronary arteriography. Trans Assoc Am Physicians 83 78 92
44. Pe'erI
YelenskyR
AltshulerD
DalyMJ
2008 Estimation of the multiple testing burden for genomewide association studies of nearly all common variants. Genet Epidemiol 32 381 385
45. HigginsJP
ThompsonSG
DeeksJJ
AltmanDG
2003 Measuring inconsistency in meta-analyses. BMJ 327 557 560
Štítky
Genetika Reprodukční medicínaČlánek vyšel v časopise
PLOS Genetics
2010 Číslo 11
Nejčtenější v tomto čísle
- Genome-Wide Association Study Identifies Two Novel Regions at 11p15.5-p13 and 1p31 with Major Impact on Acute-Phase Serum Amyloid A
- Analysis of the 10q11 Cancer Risk Locus Implicates and in Human Prostate Tumorigenesis
- The Parental Non-Equivalence of Imprinting Control Regions during Mammalian Development and Evolution
- Genome-Wide Effects of Long-Term Divergent Selection