
Global Analysis of the Impact of Environmental Perturbation on -Regulation of Gene Expression
Genetic variants altering cis-regulation of normal gene expression (cis-eQTLs) have been extensively mapped in human cells and tissues, but the extent by which controlled, environmental perturbation influences cis-eQTLs is unclear. We carried out large-scale induction experiments using primary human bone cells derived from unrelated donors of Swedish origin treated with 18 different stimuli (7 treatments and 2 controls, each assessed at 2 time points). The treatments with the largest impact on the transcriptome, verified on two independent expression arrays, included BMP-2 (t = 2h), dexamethasone (DEX) (t = 24h), and PGE2 (t = 24h). Using these treatments and control, we performed expression profiling for 18,144 RefSeq transcripts on biological replicates of the complete study cohort of 113 individuals (ntotal = 782) and combined it with genome-wide SNP-genotyping data in order to map treatment-specific cis-eQTLs (defined as SNPs located within the gene ±250 kb). We found that 93% of cis-eQTLs at 1% FDR were observed in at least one additional treatment, and in fact, on average, only 1.4% of the cis-eQTLs were considered as treatment-specific at high confidence. The relative invariability of cis-regulation following perturbation was reiterated independently by genome-wide allelic expression tests where only a small proportion of variance could be attributed to treatment. Treatment-specific cis-regulatory effects were, however, 2 - to 6-fold more abundant among differently expressed genes upon treatment. We further followed-up and validated the DEX–specific cis-regulation of the MYO6 and TNC loci and found top cis-regulatory variants located 180 kb and 250 kb upstream of the transcription start sites, respectively. Our results suggest that, as opposed to tissue-specificity of cis-eQTLs, the interactions between cellular environment and cis-variants are relatively rare (∼1.5%), but that detection of such specific interactions can be achieved by a combination of functional genomic approaches as described here.
Published in the journal:
. PLoS Genet 7(1): e32767. doi:10.1371/journal.pgen.1001279
Category:
Research Article
doi:
https://doi.org/10.1371/journal.pgen.1001279
Summary
Genetic variants altering cis-regulation of normal gene expression (cis-eQTLs) have been extensively mapped in human cells and tissues, but the extent by which controlled, environmental perturbation influences cis-eQTLs is unclear. We carried out large-scale induction experiments using primary human bone cells derived from unrelated donors of Swedish origin treated with 18 different stimuli (7 treatments and 2 controls, each assessed at 2 time points). The treatments with the largest impact on the transcriptome, verified on two independent expression arrays, included BMP-2 (t = 2h), dexamethasone (DEX) (t = 24h), and PGE2 (t = 24h). Using these treatments and control, we performed expression profiling for 18,144 RefSeq transcripts on biological replicates of the complete study cohort of 113 individuals (ntotal = 782) and combined it with genome-wide SNP-genotyping data in order to map treatment-specific cis-eQTLs (defined as SNPs located within the gene ±250 kb). We found that 93% of cis-eQTLs at 1% FDR were observed in at least one additional treatment, and in fact, on average, only 1.4% of the cis-eQTLs were considered as treatment-specific at high confidence. The relative invariability of cis-regulation following perturbation was reiterated independently by genome-wide allelic expression tests where only a small proportion of variance could be attributed to treatment. Treatment-specific cis-regulatory effects were, however, 2 - to 6-fold more abundant among differently expressed genes upon treatment. We further followed-up and validated the DEX–specific cis-regulation of the MYO6 and TNC loci and found top cis-regulatory variants located 180 kb and 250 kb upstream of the transcription start sites, respectively. Our results suggest that, as opposed to tissue-specificity of cis-eQTLs, the interactions between cellular environment and cis-variants are relatively rare (∼1.5%), but that detection of such specific interactions can be achieved by a combination of functional genomic approaches as described here.
Introduction
The genetic contribution to population variation in cis-regulation of gene expression has been well studied in expression QTL (eQTL) studies where genome-wide expression profiles in cells or tissues of interest are statistically linked to sequence variants, known as “expression SNPs” or eSNPs. Following the pioneering of mapping eQTLs using Epstein-Barr virus transformed lymphoblastoid cell lines (LCLs) [1] such as those analyzed in the HapMap project [2], [3], various primary cells [4]–[8] and complex tissues [5], [8]–[10] have been used for the identification of cis-regulatory variants. These eQTL studies have all been able to show a strong effect of common cis-variants on gene expression as compared to trans-effects that are more difficult to detect due to smaller effect sizes [7]. More recently, eQTL studies have included multiple cell types from the same study population where results have pointed towards a substantial proportion of cis-effects being reproducible across different cell types [11]. However, although a large proportion of the cis-effects seem to be cell-type invariant, others may act in a cell-type specific manner [4], [11].
Environmental factors influence gene expression, and undoubtedly interaction between sequence variants and environmental stimuli represents a critical step to cellular development and disease pathogenesis. Modeling gene-environment interactions in a clinical setting is challenging, but eQTL mapping may represent an excellent model for identifying these important interactions that impact phenotype. Smirnov et al [12] studied inter-individual differences in expression in response to radiation in LCLs and found that most regulators influencing radiation-induced gene expression act in trans with very few cis-regulatory effects. Similarly, in a recent report studying the effect of pro-inflammatory oxidized phospholipids on global gene expression in human primary endothelial cell lines, the majority of the regulated transcripts were shown to be influenced by trans-acting loci [13].
In an attempt to elucidate the impact of non-genetic, experimental factors such as growth conditions on eQTL mapping in cultured cells, we previously studied multiple primary cell lines derived independently from the same individual, and assessed the replicability of cis - versus trans-associations using these biological replicates. We found that cis-eQTLs are highly reproducible across biological replicates, as compared to trans-eQTLs that showed much lower than expected overlap across replicates [7]. Clearly, larger sample sizes are needed in order to find SNPs with true trans regulatory effects on gene expression.
To explore the impact of environmental perturbation on cis-regulation (defined here as variants located within the gene or in a ±250kb window flanking the gene) of human gene expression, we performed large-scale induction experiments using human primary osteoblasts (HOb) from a population panel described previously [7], [14]. Environmental stimuli included growth factors [15], [16], cytokines [17], [18] and hormones [19]–[21], all with previous known effects on the osteoblast transcriptome. We verified that the response upon treatment was robust before proceeding with cis-eQTL analysis. In addition to standard eQTL mapping, we applied an alternative approach with improved sensitivity for mapping cis-regulatory variants based on the measurement of allele-specific expression (AE) that directly demonstrates that a variant acts in cis [11], [22], [23]. We employed the Illumina HumanOmni1-Quad BeadChip for global assessment of AE - an approach based on the quantitative assessment of allele ratios in expressed heterozygous SNPs in RNA samples, which are then normalized to corresponding genomic DNA heterozygote ratios. An outline of the study is presented in Figure 1. Using these approaches we find that the cis-regulatory landscape within a cell is very stable, with only a small proportion of the identified cis-eQTLs being specific to environmental stimuli.

Results
Differential gene expression upon environmental perturbation
Human osteoblast-like cells (HOb) derived from 113 unrelated Swedish donors, each with independently derived primary cell lines (n = 3), were cultured under 18 different conditions: seven different treatments (BMP-2, dexamethasone (DEX), IGF1, PTH, PGE2, TNFα, 1.25VitD3) and two controls, each at two time points (2h and 24h, respectively). To identify those conditions that most clearly influenced global gene expression, we first performed a pilot study, assessing the response of each treatment on gene expression upon treatment in three biological replicates for one individual using Affymetrix GeneChip U133+2 arrays. In general, all treatments demonstrated significantly more genes that were up - or down-regulated after 24h exposure than at the earlier time point (FDR adjusted P value<0.05 and Fold change >2) (Figure 2A and Figure S1A). Based on both magnitude and biological relevance of regulated genes, BMP-2, DEX and PGE2 were chosen for the subsequent global analysis of the effect of environmental perturbation on cis-regulation. DEX and BMP-2 treatment regulate the expression of several immediate-early (2h exposure) and late (24h exposure) genes and pathways related to bone cell function as previously described [14]. For instance, upon stimulation with BMP-2 for 2h, a large number of negative regulators are up-regulated including the inhibitory Smads (SMAD6 and SMAD7) and the BMP inhibitor, Noggin. In DEX-treated samples, the IGF1 signaling pathway is one of the top canonical signaling pathways down-regulated following stimulation. We further analyzed the genes regulated by PGE2 and found them significantly associated with skeletal development and function including growth (P = 3×10⁻⁴, Fisher's exact test), differentiation (P = 3×10⁻⁴, Fisher's exact test) and formation of bone cells (P = 9×10⁻⁴, Fisher's exact test).

To verify that the observed responses upon treatment were robust across expression platforms, we profiled one additional individual using Illumina HumanRef8 v2 BeadChips and again found that stimulation by DEX, BMP-2 and PGE2 resulted in the most striking gene expression changes (Figure 2B) with modest to weak effects of the remaining treatments (Figure S1B). The proportions of differentially expressed genes (1-pi0) among all tested genes for the three treatments are presented in Table S1. In addition, complete lists of response genes upon treatment are shown in Tables S2, S3, S4. We have previously validated response genes upon DEX and BMP-2 treatment [14] by real-time RT-PCR, and upon PGE2 stimulation in this study, and in all cases the direction of effect was the same (Figure S2).
We then obtained whole genome expression profiles from the cultured primary cells that were untreated (t = 24h, N = 94) and treated with DEX (t = 24h, N = 107), BMP-2 (t = 2h, N = 101), PGE2 (t = 24h, N = 100), each with at least two biological replicates, using Illumina HumanRef8 v2 arrays. For each individual, we averaged the normalized expression scores across biological replicates to obtain a single measure for each of the 18,144 genes included on the array.
We further studied whether responses upon DEX, BMP-2 and PGE2 treatments seen in a single sample as described above using Affymetrix GeneChips accurately represented a general effect in the study population. Approximately 13,000 RefSeq transcripts overlapped the two studies and the expression response for each treatment from the different studies was used in a correlation analysis (median log2 fold change was used as an estimate of the general effect in the study population). We found strong correlations (r = 0.5–0.6) of expression changes by individual genes from the different studies (Figure S3) indicating that the selected treatments robustly impact the expression profiles in the study population.
Mapping of cis-eQTLs upon perturbation
The samples included here have previously been genotyped using the Illumina Hap550K arrays and were included in our recent work of cis-eQTL analysis focused on the untreated control samples from the same study population [7]. All probes overlapping a SNP (dbSNP 126) were removed as previously described resulting in ∼17,000 probes included in the eQTL analyses. The conditioned expression traits were used as dependent variables in linear regression models and adjusted for sex and year of birth. Our analysis focused on cis-regulatory variants defined as SNPs (N = 388,946) located in a 250kb window flanking the target transcript [7].
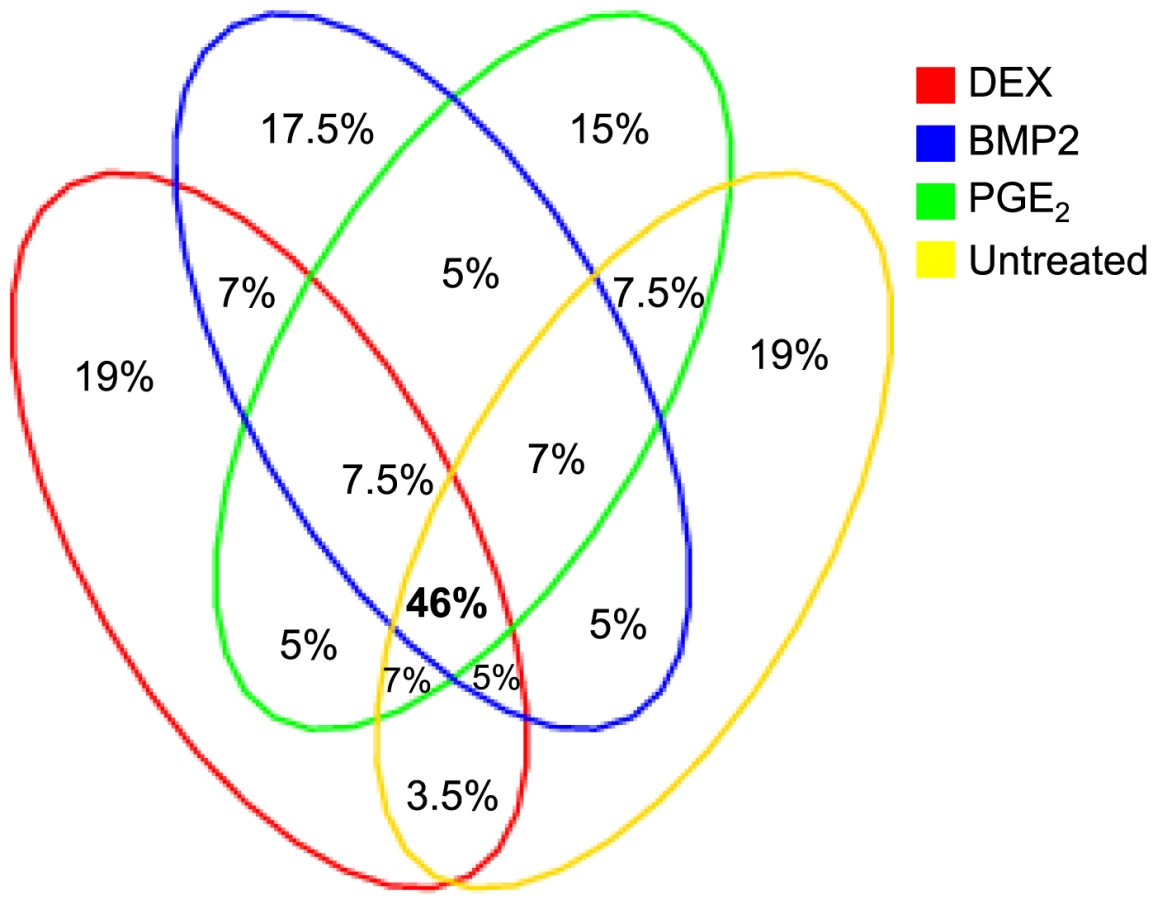
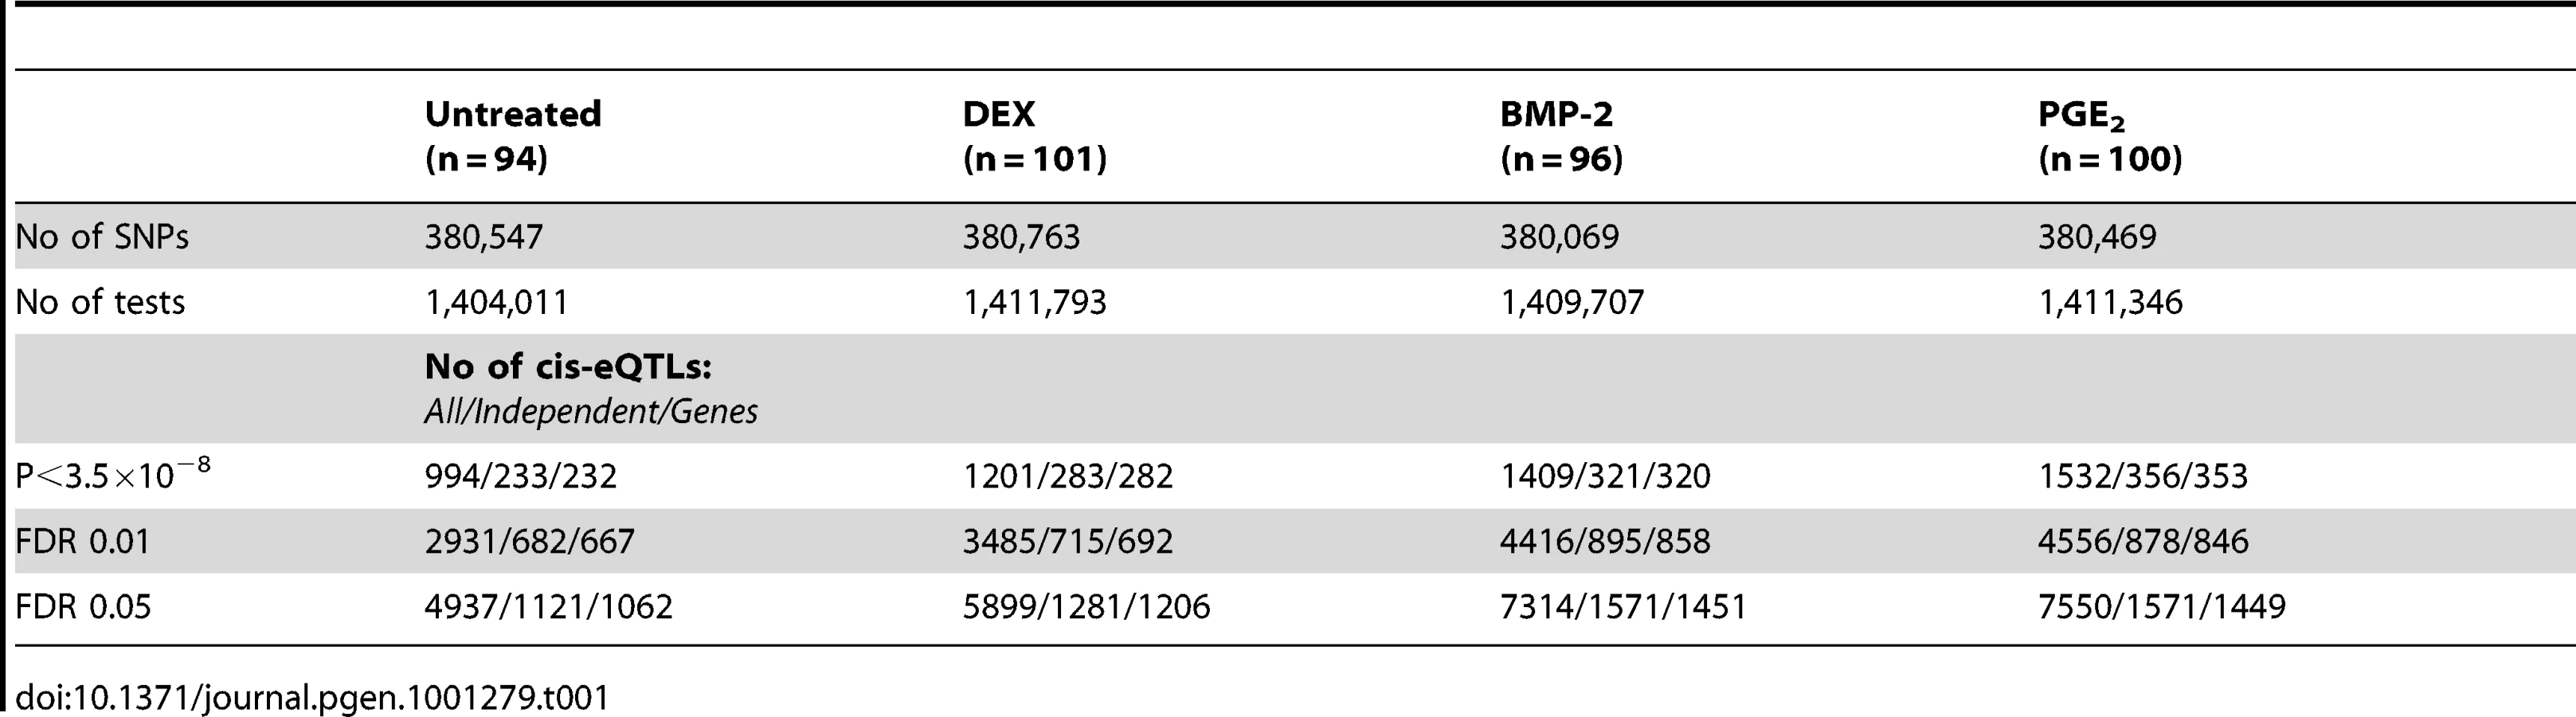
Summary statistics from the cis-eQTL analyses are presented in Table 1 and in Figure S4 using all samples (n = 94–101) and in Table S5 separating the biological replicates in identical samples across treatments (n = 80). Characteristics of all significant, independent cis-variants (5% FDR) including distance to transcription start site (TSS) and SNP category (i.e. intronic, 3′UTR, coding etc) are presented in Table S6 and Figure S5. At all three significance levels (Bonferroni P<3.5×10⁻⁸, 1% FDR, and 5% FDR), we identified on average ∼40% more cis-eQTLs in induced samples as compared to the untreated controls. However, when we compared top ranked cis-eQTLs between treatments we found a high overlap of significant associations across treatments (Figure 3). Despite clear global effects of each treatment to expression profiles, genes under genetic cis-regulatory component demonstrate very similar dependence on local variants. For example, 93% of cis-eQTLs identified in DEX treated samples at 1% FDR (P<2.5×10⁻⁵) are observed in at least one other condition at a slightly less stringent P-value threshold of P = 5×10⁻⁴. The overlap changes only slightly when considering independent signals (87% versus 93%). This degree of overlap across treatment groups is similar to the proportion of shared cis-eQTLs between two biological replicates, as previously described [7]. Similarly, when we restrict analysis to significant cis-eQTLs (1% FDR) in DEX-treated samples, we note strong enrichments of low P-values in the eQTL analysis for both of the other treatments (BMP-2, PGE2) and in the untreated control samples, confirming that the vast majority of observed eQTL associations are observed regardless of experimental condition (Figure S6). We then asked whether the shared cis-eQTLs across treatments are for genes that significantly respond to each treatment or if they are expressed, but not differentially expressed. We classified the genes as responders (significant >1.5-fold difference in expression upon induction) and non-responders based on the pilot data (Table S2, S3, S4) but found no difference in the proportion of overlapped cis-eQTLs between the two lists of genes.
We defined high-confidence environmental-specific cis-eQTLs as being 1) significant in one treatment at 1% FDR or 5% FDR, respectively, and 2) non-significant (P>0.05) in all three remaining conditions. As expected based on the results from the initial analysis described above, treatment-specific cis-eQTLs were found to be rare. At 1% FDR, we identified on average 1.4% treatment-specific cis-eQTLs, representing only a slight excess to the expected false discovery rate (Table 2). When restricting to independent cis-eQTLs only, the treatment specificity at 1% FDR was increased to ∼2.5% (all treatment-specific cis-eQTLs at 5% FDR are presented in Table S7, S8, S9). The identified high-confidence cis-eQTLs at 5% FDR corresponded to 72–143 genes per treatment group (Table 2) where we found evidence of a ∼2-fold enrichment of treatment-specific expression pattern for the DEX-specific genes harboring an eQTL, than expected by chance (binomial P<0.05). No such enrichment was seen for the BMP-2 or PGE2 specific associations.

We further analyzed the genes harboring treatment-specific cis-eQTLs for enrichment in biological processes or pathways using the Ingenuity Pathway Analysis software and the results are presented in Table S10. Interestingly, the top mapped canonical pathway for DEX-specific genes is MIF (macrophage migration inhibitory factor)-mediated glucocorticoid regulation (P = 7.43E-04, Fisher's exact test).
We also analyzed the data sets jointly by fitting a linear mixed model where the treatment*SNP interaction term was included and we found similar proportions as above; i.e. at 5% FDR we found a total of 853 cis-eQTLs interacting with any treatment compared to 932 at similar FDR using the approach described above (Table S11).
We then sought to validate our top high-confidence DEX-specific cis-eQTLs using low-throughput sequencing-based AE assessment [24], [25] in samples heterozygous for 1) the top cis-eSNP and 2) an intragenic exonic marker either included on the Illumina Hap550K array or imputed from the HapMapII panel. We selected the top five (MYO6, CDSN, ZNF480, LSM16, TMBIM1) DEX-specific genes (Table 3) where the expression levels were detectable by RT-PCR. CA2 was excluded due to absence of an exonic marker, and PLEKHA6 and USP10 were excluded due to undetected expression in BMP-2 and PGE2 treated samples, respectively. Of the five selected genes, one failed in sequencing reaction (CDSN). Of the remaining four genes we were able to successfully validate treatment specific cis-regulation of the MYO6 locus (Figure 4 and Table S12). Specifically, DEX-treated samples heterozygous for the top eSNP from the cis-eQTL analysis (rs646967; DEX eQTL P = 8.8×10⁻¹⁰, BMP-2 eQTL P = 0.8, PGE2 eQTL P = 0.06; Figure 4A) showed allele-specific expression revealed by differences in RNA (cDNA) allele ratios at the marker heterozygous site. The normalized allele ratio within each DEX-treated sample deviated greater than 2SD from the corresponding BMP-2, PGE2, and genomic DNA heterozygote ratio, respectively, and we found an overall significant difference in mean |Δ het ratio| between treatments (rs12606; |Δ het ratio|DEX = 0.52±0.26 and |Δ het ratio|BMP-2+PGE2 = 0.04±0.02; P = 2.7×10⁻⁴, t-test; Figure 4B).


We fine-mapped the candidate region upstream of the MYO6 gene by including imputed, untyped HapMapII SNPs and found the rs584677 SNP, located ∼160kb upstream of the TSS, to have the strongest effect on MYO6 expression (Figure 4C).
Global impact of perturbation on cis-regulation
To directly investigate the impact of environmental perturbation to allelic cis-regulation in primary cells, we carried out an independent AE assessment in a subset of five randomly selected samples included in the eQTL study. This was achieved by applying a direct method for measuring allele-specific cis-regulation in a genome-wide manner as we described recently [26]. The genome-wide AE test was carried out on Illumina HumanOmni1-Quad genotyping chips by interrogating differences in RNA (cDNA) allele ratios at heterozygous sites across primary transcripts normalized to genomic DNA allele ratios from the same individual. All four cell-culture conditions (DEX, BMP-2, PGE2 and untreated control) were employed in the experiment with the DEX treatment carried out in duplicate, resulting in a total of 25 samples from five individuals included in the analysis. We verified that these newly cultured cells responded to each treatment as expected (Table S13, see Methods). A duplicate DEX and PGE2 sample failed for one individual leaving a total of 23 AE profiles for analysis. The cDNA data at each heterozygous site were subjected to expression (signal intensity) and allele resolution filters [26], respectively, along with a novel method for normalization of signal intensity induced biases in allele ratio estimates (see Methods).
Initially, we looked for convergence of the AE data with our cis-eQTL data. Using five individuals we did not have power to independently map cis-rSNPs [26], therefore we focused on samples heterozygous for significant treatment-specific cis-eSNPs (defined as being significant in one treatment at 5% FDR and non-significant, P>0.05, in all three remaining conditions). In total, 162/485 genes (Table S14) with treatment-specific cis-regulation from the eQTL study were informative for AE test, i.e. at least one out of five samples being heterozygous for a cis-eSNP and with the region being robustly expressed. We then used windows of three consecutive heterozygous SNPs (at least three of four informative SNPs above signal threshold in each sample) to detect differential allelic expression, defined as an average |Δ het ratio|>0.05 (corresponding to 1.2-fold difference between alleles) among SNPs showing empirical probability of P<0.05 (see Methods).
Of the 162 tested regions, evidence of a cis-regulatory effect was independently confirmed for 73 (45%) genes (Table S14). However, of these, we were able to confirm treatment-specific effects for only a minority (5 of 73 loci, 7%). For the remaining 68 loci (93%), allele-specific expression was observable across treatments (Table S14). The five validated treatment-specific cis-eSNPs were shown to have a greater effect on induced gene expression indicated by differences in fold change (AA versus BB) than the 68 treatment-independent loci (Figure S7).
Next, we used our AE data set to assess the global impact of treatment in allelic cis-regulation by measuring AE differences within (for duplicate measurements used in the case of DEX) or between treatments in one individual or across samples. The genome-wide profiles of treatment induced allelic cis-variation measured the difference of average allele-ratios [mean(|Δ het ratio|test−|Δ het ratio|ref)] using windows of three consecutive heterozygous SNPs in robustly expressed RefSeq regions (at least three of four informative SNPs above signal threshold in both samples). Each treatment (“test”) was correlated to the same DEX (“reference”) sample and only windows expressed in all treatments were used for within individual comparisons. Treatment explained ∼10–15% of variance of AE within an individual (r = 0.87–0.89 DEX versus DEX, r = 0.77–0.79 DEX versus other treatment) (Figure 5A). In contrast, the variance of allelic expression among individuals was considerably higher (average r = 0.4), which eliminated any observable difference within (Figure 5B) or between treatments (Figure 5C). Overall, these results reiterate the relative stability of allelic cis-regulation upon environmental perturbation within a cell type as observed in our eQTL survey as well as heritability of AE phenotypes observed earlier by us [26] and others [11].

Finally, we explored the possibility of identifying loci accounting for the 10–15% higher variance in cis-regulation observed upon perturbation by observing outliers in treatment comparisons within samples. We used three SNP windows where all measurement points consistently showed either lower or higher deviation from equal expression in reference (DEX) versus test samples (BMP-2, PGE2 or untreated control), with 40K window pairs available on average. Genome-wide distribution of pair-wise differences allowed us to assign a probability (empirical significance) for observing three consecutive SNPs with a certain degree of directional difference (consistently greater or smaller deviation from equal expression in consecutive SNPs) between reference and test sample. On average, window pairs reaching permutation significance of 0.05 or lower (1.8% on average) were further assessed to look for genes with DEX-specific allelic expression differences. We observed 16–84 genes (at 12–25% FDR, see Methods) per sample (Table S15) where DEX treatment consistently differed from all three other cell culture conditions suggesting a direct interaction between cis-variants and environmental perturbation. Notably, these genes were 2.3–6.2-fold more common among the DEX response genes (significant >1.5-fold difference in expression upon DEX induction) (Table S2 and S15) than expected by chance (binomial P<0.05 for each sample). These results suggest that specific interaction of cis-regulatory sequences with the environment can be directly identified in vivo by genome-wide AE measurements.
Dexamethasone specific cis-regulation of the Tenascin-C (TNC) locus—a corticosteroid pharmacogenetic candidate locus
We followed-up and validated our top DEX-dependent cis-regulated locus, the Tenascin-C (TNC) locus, identified in the global AE test (Figure 6A) using low-throughput methods in an extended set of samples as well as at different time points (t = 2h and t = 24h). We were able to successfully confirm the treatment-specific effect after 24h but no difference in AE was seen after 2h (Figure 6B) indicating a time-dependent effect of the gene regulation.

We extended our cis-eQTL analysis in DEX-treated samples by including imputed HapMapII SNPs in order to fine-map the association and found the top SNP (rs7850103, P = 2×10⁻⁷) located ∼250 kb upstream of the TSS (Figure 6C). Further real-time RT-PCR experiments confirmed that down-regulation of TNC expression by DEX is genotype-dependent (Figure S8). We then asked whether DEX-dependent heritable cis-regulation of TNC expression could underlie the difference in inhaled corticosteroid treatment response in the treatment of childhood asthma. We chose asthma as a clinical model given that (1) inhaled corticosteroids represent the most commonly prescribed and efficacious asthma controller medication; (2) clinical response to inhaled corticosteroids in asthma is variable between subjects; and (3) TNC expression is known to be increased in lung tissue of asthmatics, which is modulated by corticosteroid treatment [27]. We tested six SNPs located in our candidate region in children with mild-to-moderate persistent asthma enrolled in a multicenter, randomized, placebo-controlled trial of inhaled anti-inflammatory medication. The analysis was limited to 170 children of self-reported non-hispanic white ancestry randomized to daily, inhaled budesonide treatment, on whom lung function (forced expiratory volume in one second (FEV1)) had been measured before and after two months of corticosteroid treatment. We found suggestive associations between the TNC cis-variants and response to inhaled corticosteroid (rs955387-A, beta = −6.99, P = 0.005; rs10982634-C, beta = −6.01, P = 0.01; rs10817727-G, beta = −5.78, P = 0.02; rs12380804-A, beta = −8.09 P = 0.02; rs10982611-G, beta = −2.87, P = 0.07; rs10817762-C, beta = −2.785, P = 0.08) (Figure 6D) although independent replication is needed to confirm these findings.
Discussion
We have studied how environmental perturbation impacts genetic cis-regulation of global gene expression in primary human osteoblasts. To our knowledge, this is the first study exploring the cis-regulatory landscape in a population panel of human cells cultured under multiple conditions and time points. Environmental stimuli included growth factors, cytokines and steroid hormones known to be relevant to the cell type studied and with previous known effects on the osteoblast transcriptome [15]–[21]. The robust response to treatment was verified both within and across samples using different expression platforms and clearly showed evidence of biologically relevant transcript changes such as the significant down-regulation of the IGF1 signaling pathway following glucocorticoid stimulation [14]. However, despite the large impact on the transcriptome by the treatments, we found that only a small proportion of the identified cis-eQTLs can be considered as true treatment-specific, indicating that global changes in gene expression may be governed more by subtle heritable and environmental effects.
Our experimental design with the inclusion of multiple independently derived cell lines as biological replicates improved not only the detection of response genes but also the discovery of treatment-specific and treatment-independent cis-eQTLs. We have previously shown that by including such replicates, approximately 60% more cis-eQTLs can be identified compared to the use of single replicates [7]. Using this design in multiple conditions, we identified ∼40% more cis-eQTLs in conditioned samples as compared to untreated controls but interestingly, when we compared them across treatments we found that the majority (>90%) of them were seen in more than one condition. These findings were confirmed in a slightly different study design separating the biological replicates and performing two independent cis-eQTL analyses per treatment. This indicates that environmental perturbation seems to allow a higher discovery rate of genetic cis-effects not because of treatment-specific regulatory variants but rather due to increased power in cis-eQTL analysis in conditioning cells, perhaps attributable to a higher level of coordination of gene regulatory activity between treatments (i.e. reducing environmental variability of “resting cell culture”).
In contrast to environmental-dependence, cell-type specific cis-regulation of gene expression has previously been studied with contrasting results. Using human primary fibroblasts and immortalized B-lymphocytes, Lee et al [11] found that up to 10% of the genes studied might be influenced by tissue-specific cis-regulatory variants whereas Dimas et al [4] reported that 69–80% of regulatory variants operate in a cell type-specific manner using similar human cell panels. Notably, the former study utilized AE monitoring and the latter applied eQTL-mapping. Lee et al [11] also explored how cis-regulation is affected by experimental conditions following iPS reprogramming, and their results indicated that allele-specific expression remained largely invariable. Our results are consistent with the more conservative estimates of context specificity of cis-regulatory variation reported by others [11], [28]. In line with this are the recent observations indicating that at genome-wide level, trans-variants predominate when hypothesis free mapping of perturbation specific effects are mapped [12], [13], [29]. Based on our earlier results [7], we chose not to pursue analyses including trans variants, since even among biological replicates these cannot be reproduced in the current sample size.
However, we followed-up and validated our findings from the cis-eQTL analysis by measuring global allele-specific expression pattern in the different conditioned cells. This allowed us to study treatment-specific cis-effects in more detail due to higher sensitivity and specificity of the approach [26]. We were able to validate ∼45% of the cis-regulatory effects identified in the eQTL analysis which is in fact similar to what has been shown previously comparing AE mapping with traditional cis-eQTL mapping [26]. The reason for the remaining 55% of the cis-eQTL not being validated can be due to insufficient power in AE test, false positives in eQTL mapping, or measurement of mRNA versus pre-mRNA in eQTL and AE studies, respectively. Nevertheless, the results from these allele-specific expression assessments confirmed our previous findings from eQTL analysis and strengthened the hypothesis that a large proportion of cis-regulatory variants are shared across treatments. In fact, the majority of the environmental-dependent regulatory variants that were identified in eQTL analysis were shown to be shared across multiple treatments. The reason for these numerous false-negatives could be explained by the sensitivity of the eQTL approach where identification of cis-regulation of low expression transcripts is challenging. An example of this occurrence is the cis-acting variant regulating the expression of TNFSF4 that has been associated with susceptibility to systemic lupus erythematosus and whose cis-regulatory effect is largely pronounced in activated cells as compared to non-activated cells due to up-regulation of TNFSF4 expression upon activation [30].
In addition to validating our findings from cis-eQTL analysis, we used the AE assessments to try and further detect environmental-dependent cis-regulatory effects, focusing on the DEX treatment. DEX is a synthetic glucocorticoid steroid hormone that regulates gene expression through binding to its nuclear receptor, the glucocorticoid receptor (GR). The ligand-receptor complex binds the DNA at specific glucocorticoid response elements (GRE) resulting in activation or repression of gene expression [31]. Here, we were able to detect on average ∼60 genes/sample with evidence of DEX-specific AE differences enriched among DEX-responsive genes (i.e. showed a significant >1.5-fold difference in expression upon DEX stimulation) allowing us to speculate whether the causative eSNP may affect the GR-GRE binding and subsequent the DEX-GR ability to regulate gene expression. Recently a comprehensive ChIP-seq study was presented of DEX-GR binding and its effect on gene expression throughout the human genome [32]. Reddy et al showed that while genes activated with DEX treatment have GR bound in proximity to the TSS, genes repressed with DEX treatment have GR bound >100kb from the TSS. Moreover, another striking difference between genes activated and repressed by DEX was the time required for gene expression response to DEX with repression beginning much later than activation following DEX exposure. Interestingly, these features were seen for our top significant DEX-specific cis-regulated locus, the Tenascin-C (TNC) locus. Tenascin-C is an extracellular matrix protein whose expression is up-regulated in inflammatory conditions, such as rheumatoid arthritis [33] and asthma [27] and known to be down-regulated by DEX [27], [34]. Here we showed that the DEX-specific down-regulation of TNC is both genotype - and time-dependent with a significant cis-regulatory effect seen only after the later time point of DEX exposure and with the top SNP being located ∼250 kb upstream of the TSS. In fact, the same region on chromosome 9 was identified by ChIP-seq to be bound by GR in human A549 lung epithelial carcinoma in response to DEX treatment [32].
In conclusion, our results indicate that qualitative (“on/off”) interactions between controlled environmental perturbation and heritable cis-regulatory SNPs are uncommon. Therefore, uncovering true interactions requires either multi-pronged approaches where independent tools are used to assess treatment specificity on genetically controlled expression, as employed here. Alternatively, larger sample sizes with adequate replication in independent cohorts are required for establishing cis-regulatory variant – environment interaction, due to much smaller effect sizes than those observed for natural variation in gene expression among populations. At the same time, the existence of validated, genetically controlled, treatment cis-specific effects shown here suggests that systematic functional genomic screens may yield a valuable alternative approach for identifying pharmacogenomic biomarkers altering gene regulation [35], often difficult to access in clinical cohorts due to limited sample sizes.
Methods
Ethics statement
All research involving human participants have been approved by institutional review boards (Dnr Ups 03-561, McGill IRB A10-M121-06B) and conducted according to the principles expressed in the Declaration of Helsinki.
Primary cell culture
Human trabecular bone from the proximal femoral shaft was collected from 113 donors (51 female and 62 male donors, respectively) undergoing total hip or knee replacement at the Uppsala University Hospital, Uppsala, Sweden. The bone samples from each donor were thoroughly minced and cultured in three biological replicates. The cells were grown in medium containing α-MEM (SigmaAldrich, Suffolk, UK) supplemented with 2 mmol/l L-Glutamine, 100U/mL penicillin, 100mg/mL streptomycin (National Veterinary Institute of Sweden, Uppsala, Sweden), and 10% fetal bovine serum (SigmaAldrich, Suffolk, UK) at 37°C with 5% CO2. At 70–80% confluence, the cells were passaged and sub-cultured in 6-well plates (100,000 cells/well) for 12 days. The culture medium was changed twice weekly. Prior to treatment, the cells were starved for 20h by adding complete cell medium containing 0.5% fetal bovine serum. The cells were then incubated for 2h and 24h with 0.1 µg/ml of rhBMP-2, 100 nM of dexamethasone, 100 nM of IGF-1, 1µM of PGE2, 100 nM of PTH (1–34), 0.1 nM of TNF-α, 100 nM of 1.25 VitD3 and with the same concentration of control, respectively (Table S16). At the two time points, the cell medium was removed and the cells were harvested by adding 600µL of RLT buffer (Qiagen, GmbH, Germany). The cell lysates were homogenized by using QIAshredder (Qiagen, GmbH, Germany) homogenizers and stored in −70°C until RNA extraction.
The study was approved by the local ethics committees (Dnr Ups 03-561, McGill IRB A10-M121-06B).
RNA extraction
RNA was extracted from cell lysates using the RNeasy Mini Kit (Qiagen, Mississauga, Canada). High RNA quality was confirmed for all samples using the Agilent 2100 BioAnalyzer (Agilent technologies, Palo Alto, CA, USA) and the concentrations were determined using NanoDrop ND-1000 (NanoDrop Technologies, Wilmington, DE, USA).
Expression profiling—Affymetrix GeneChip
Expression profiling of one complete sample was performed in triplicate (biological replicates) using the Affymetrix Human Genome U133 plus 2.0 Array (Affymetrix, Santa Clara, CA, USA). One microgram of RNA was reverse transcribed into cDNA and in vitro transcription was performed to generate biotin-labeled cRNA for subsequent hybridization. Hybridized target cRNA was then stained with streptavidin phycoerythrin, and arrays were scanned using a GeneArray Scanner at an excitation wavelength of 488nm. The raw data was imported to BioConductor [36] using the R 2.5.0 package and normalized mean expression values were generated by the Robust Multichip Average algorithm [37], [38].
The microarray data have been deposited in the Gene Expression Omnibus (GEO), www.ncbi.nlm.nih.gov/geo (accession no. GSE10311).
Expression profiling—Illumina BeadChips
Expression profiling of one complete sample and of all BMP-2 (2h, n = 101), dexamethasone (24h, n = 106), PGE2 (24h, n = 105) and untreated control (24h, n = 95) samples, each with at least two biological replicates, was performed using the Illumina HumRef-8v2 BeadChips (Illumina Inc. San Diego, CA, US) where 200ng of total RNA was processed according to the protocol supplied by Illumina. The raw data was imported to BioConductor [36] using the R 2.5.0 lumi package for variance-stabilizing transformation and robust spline normalization to obtain normalized mean expression values. The detectionCall algorithm in the lumi package was used to find genes uniquely expressed in one condition. A gene was considered expressed if present in at least 10% of the measured samples.
The microarray data has been deposited in the Gene Expression Omnibus (GEO), www.ncbi.nlm.nih.gov/geo (accession no. GSE15678, GSE21410, GSE21725, GSE21726, GSE21727).
Gene network and pathway analysis
In order to visualize whole-genome expression data in the context of biological networks, functions or pathways data were analyzed through the use of Ingenuity Pathway Analysis (IPA) system (Ingenuity Systems, Mountain View, CA, USA, www.ingenuity.com). The datasets containing differently expressed genes (FDR adjusted P<0.05 and Fold change >2) or genes harboring a treatment-specific cis-eQTL were uploaded to the application. Each gene identifier was mapped to its corresponding gene object in the Ingenuity Pathways Knowledge Base. A fold change cutoff was set to identify genes whose expression was significantly differentially up or down-regulated. These genes, called Focus Genes, were overlaid onto a global molecular network developed from information contained in the Ingenuity Pathways Knowledge Base. Networks of these Focus Genes were then algorithmically generated based on their connectivity.
The Functional Analysis identified the biological functions that were most significant to the dataset. Genes from the dataset that met the cutoff and were associated with biological functions in the Ingenuity Pathways Knowledge Base were considered for the analysis. Fisher's exact test was used to calculate a p-value determining the probability that each biological function assigned to the dataset is due to chance only.
Assessment of differently expressed genes
The Cyber-t test was used to determine the significance between the observed differences in gene expression. The Cyber-t test is based on simple t-tests and uses the observed variance of gene measurements across replicate experiments, thereby accommodating noise, variability, and low replication, often typical of microarray data [39]. Since the number of tests (genes) is large, the p-values are adjusted for multiple comparisons using the false discovery rate (FDR) algorithm [40] in Bioconductor using the R 2.5.0-package [36].
For the proportion of differentially expressed genes among all tested genes for each treatment (1-pi0) the qvalue package implemented in R was used [40].
DNA extraction
DNA was successfully extracted from cell lysates of 109/113 samples and re-suspended in 200µl PBS using the GenElute DNA Miniprep Kit (SigmaAldrich, Suffolk, UK). Concentrations were determined using the Quant-iT PicoGreen kit (Molecular Probes).
Whole-genome genotyping
Genotyping was performed on 106 samples using the Illumina HapMap 550k Duo chip (Illumina Inc., San Diego, CA, US) according to the protocol provided by the manufacturer. The total number of SNPs included on the chip is 561,303. Individuals with low genotyping rate (<90%) and SNPs showing significant deviation from Hardy-Weinberg equilibrium (P<0.05) were excluded. Similarly, low frequency SNPs (MAF<0.10) and SNPs with high rates of missing data (>5%) were excluded. The average success rate of the genotyping of the 561,303 SNPs across all individuals was 99%.
Genotype–phenotype association analysis
Of the 22,184 Illumina probes (corresponding to 18,144 genes), those with SNPs (dbSNP build 126) within them were excluded. We tested for association of the induced expression levels to SNPs using the linear regression model implemented in the PLINK software (http://pngu.mgh.harvard.edu/purcell/plink/) [41] assuming additive effect of the SNPs. Two covariates were also included in the regression model; year of birth and sex (mRNA = a+b1SNP1+b2cov12+b3cov23+e). Cis-regulatory effects were tested using SNPs mapping ±250kb flanking the gene or within the gene itself. In order to study whether array hybridization time point (i.e. batch) biased our data and masked weak treatment-specific effects we also analyzed the data including batch as a cofactor in exactly overlapping samples across treatments (n = 80) keeping the biological replicates separate in independent cis-eQTL analyses.
We also analyzed the data sets jointly by fitting a linear mixed model using the SAS 9.1 software (SAS institute Inc., Cary, NC, US). Treatment group was included as a random effect and year of birth and sex as fixed effects. Two interactions terms were also included; treatment*SNP and sex*SNP, respectively. No significant sex*SNP interaction effects were found.
Independent cis-eQTLs were identified by first obtaining genome-wide recombination hotspot coordinates based on the HapMap Phase 2 (release 22, NCBI 36) data (http://hapmap.ncbi.nlm.nih.gov/downloads/recombination). Within each locus we first identified top associations within each interval between recombination hotspots and retained the top ranking association. Next we tested for potential residual LD (D′>0.5) between significant associations mapping to independent recombination hotspot intervals in our population using our genotyping as input in the Haploview software (version 4.2) (www.broadinstitute.org/haploview). Only the top association from SNPs showing pairwise D′>0.5 was kept for each locus to identify unique cis-eQTLs.
Genotype imputation
Genotypes from 103 samples that passed quality control were imputed for all SNPs (n = 478,805) oriented to the positive strand from phased (autosomal) chromosomes of the HapMap CEU Phase II panel (release 22, build 36). Untyped markers were inferred using algorithms implemented in MACH 1.0 [42], [43]. R2 was used as imputation quality control metrics and estimates the squared correlation between imputed and true genotypes. A cut-off of R2<0.3 was used to remove poorly imputed markers. Association of imputed genotypes using estimated genotype probabilities with expression traits was performed using a linear regression model implemented in the MACH2QTL software [42]–[44] with sex and year of birth as covariates.
The genomic DNA data collected in parallel from 1.1 M SNPs in these individuals also allowed us to measure imputation accuracy across the dataset using a common set of 636,676 SNPs. Overall, 88% of the HapMap SNPs were imputed at 100% accuracy across samples and the error rate within a sample was 3% which is similar to what has been reported previously [45].
Primer design
Primers were designed using the Primer3 v. 0.4.0 software (http://frodo.wi.mit.edu/) and all primer sequences can be found in Table S17.
Sequencing-based AE analysis
Allele-specific expression was assessed by quantitative sequencing [24]. High-quality RNA was used to synthesize first strand cDNA with random hexamers (Invitrogen, Burlington, Canada) and Superscript II reverse transcriptase (Invitrogen, Burlington, Canada). For each locus, we designed exonic primers and we used PeakPicker v.2.115 with the default settings to quantify the relative amount of the two alleles at the heterozygote site measured from the chromatogram after peak intensity normalization. The normalized heterozygote ratios of genomic DNA samples were used to calculate mean and SD for each SNP. If all heterozygote ratios from three technical replicates showed concordant deviation greater than two SDs from the genomic DNA heterozygote ratio mean, the sample was called to have allele-specific expression.
Retroviral transduction of primary osteoblasts
The PA317-neo packaging cells (ATCC Inc, Manassas, VA, US) expressing pLXSN hTERT and pLXSN HPV16-E7 were kindly provided by Dr Eric Shoubridge (McGill University, Montreal, QC, CA). The packaging cells were grown to near confluence in DMEM containing 10% FBS (SigmaAldrich, Suffolk, UK). After 24 h to 48h, the medium containing retroviral particles was harvested and filtered through a 0.45-µm filter and mixed with complete cell medium. Polybrene was added to a final concentration of 4ug/mL.
Five of the cultured human osteoblast lines (see above) were plated in 75-cm2 culture flasks and cultured in α-MEM (SigmaAldrich, Suffolk, UK) supplemented with 2 mmol/l L-Glutamine, and 10% fetal bovine serum (SigmaAldrich, Suffolk, UK). When cells reached 30–40% confluence, the media were removed and 6 ml of fresh prepared retroviral suspension (1.5 ml of hTERT suspension, and 1.5 ml of E7 suspension and 3 ml of medium, respectively) was added to the cells and incubated 1–2 hours at 37°C. Growth medium was then added with polybrene to bring up to usual flask volume and maintain incubating overnight at 37°C. The media were then removed and the cells were rinsed once with fresh medium and new culture medium without polybrene was added. After 48h, the media were changed to selection media containing 400µg/ml of G418 (Invitrogen, Burlington, ON, CA) and the cells were cultured under these selection conditions for 2–3 weeks.
The immortalized osteoblasts were seeded in 75-cm2 and cultured in complete cell medium. At 80% confluence, the cells were starved for 20h by adding complete cell medium containing 0.5% fetal bovine serum (SigmaAldrich, Suffolk, UK). The cells were then incubated with 10−4 mg/ml of rhBMP-2 (2h), 10−7 M of dexamethasone (24h) and 10−6 M of PGE2 (24h) and with the same concentration of control, respectively. At the different time points, the cell medium was removed and the cells were harvested by adding 2mL of TRIzol Reagent (Invitrogen, Burlington, ON, CA) and stored in −70°C until RNA extraction.
Robust responses to each treatment of these newly cultured cells were confirmed by comparison of gene expression assessed by real-time RT-PCR experiments in both immortalized and the corresponding primary treated HObs, respectively. Genes validated were selected from expression profiling using the Illumina Ref8 Beadarrays of primary cells.
Real-time RT-PCR
Aliquots of the different RNA from the primary or immortalized cell, respectively, were each annealed to 500 ng of random hexamers (Invitrogen Corporation, Carlsbad, CA, USA) at 70°C in 10 min. First-strand cDNA synthesis was performed using SuperScript II reverse transcriptase (Invitrogen Corporation, Carlsbad, CA, USA) according to manufacturer's instructions.
The target gene as well as the 18S housekeeping gene were analyzed in triplicates as well as a calibration curve from a two-fold dilution series of control cDNA and non-template control (NTC) samples. The real-time PCR assays were performed on the Rotor-Gene™ 6000 real-time rotary analyzer (Corbett Life Sciences, Sydney, Australia) using the Platinum SYBR Green qPCR SuperMix-UDG (Invitrogen Corporation, Carlsbad, CA, USA) according to manufacturer's recommendation. The cycling conditions on the Rotor-Gene™ 6000 real-time rotary analyzer were: 4 minutes at 95°C, 40 cycles x (20 seconds at 95°C, 30 seconds at 58°C and 30 seconds at 72°C) followed by the dissociation protocol at 72°C.
Results of the experimental samples were analyzed using the comparative CT method. The CT mean and standard deviation value of each technical replicate sample was calculated and the mean CT value was then normalized to the 18S mean CT value. All statistical analyses for the associations of delta CT values with genetic variants were performed using a general linear model in SAS 9.1 (SAS institute Inc., Cary, NC, US).
RNA and DNA preparation for Illumina Human omni1-quad BeadArrays
Approximately 150µg of total RNA was extracted from the cells using the commercially available TRIzol reagent protocol (Invitrogen, Burlington, ON, CA) and subsequently treated with 18 U DNaseI (Ambion Inc., Austin, TX, USA) for 30 min at 37°C and further extracted with phenol/chloroform. High RNA quality was confirmed for all samples using the Agilent 2100 BioAnalyzer (Agilent Technologies, Palo Alto, CA, USA) and the concentrations were determined using the NanoDrop ND-1000 (NanoDrop Technologies, Wilmington, DE, USA). Poly(A) RNA was then isolated using the MicroPoly(A)Purist protocol (Ambion Inc., Austin, Tx, USA) and poly-A enriched RNA quality and quantity was measured using the Agilent 2100 BioAnalyzer and NanoDrop ND-1000, respectively.
DNA from the cell lysates was extracted using the GenElute DNA Miniprep Kit (SigmaAldrich) according to the protocol provided by the manufacturer and concentrations were determined using the NanoDrop ND-1000.
First - and second-strand cDNA synthesis
Approximately 1µg poly-A enriched RNA was annealed to 50ng of random hexamers (Invitrogen, Burlington, ON, CA) at 70°C for 10 min. First - and second strand cDNA synthesis was performed using the Superscript Double-Stranded cDNA Synthesis Kit (Invitrogen, Burlington, ON, CA) according to the manufacturer's instructions. The double-stranded cDNA was extracted with phenol∶chloroform∶isoamyl alcohol and dissolved in 12ul DEPC-treated water. The size distribution of the double-stranded cDNA samples (average 1.2–1.5kb) was confirmed using the Agilent BioAnalyzer DNA Kit.
Genotyping and AE analysis on Illumina Human omni1-quad BeadChips
Approximately 200ng of genomic DNA and 50–300ng double-stranded cDNA sample was used for the parallel genotyping and AE analysis on the Illumina Infinium Omni1-Quad BeadArrays according to the manufacturer's instructions (Illumina Inc., San Diego, CA, US). Genotypes in genomic DNA were extracted using BeadStudio. The parallel assessment of genomic DNA and cDNA heterozygote ratios was carried out essentially as described earlier [26], but signal intensity normalization at heterozygous sites followed a slightly modified approach. For AE analysis we utilized the Xraw and Yraw signal intensities and since the variances in the two channels are not same (i.e. it is a function of total intensity from both channels) we need to correct this variation through normalization to allow comparison between gDNA and cDNA allele ratios. In this study, we only normalized β ratio (Xraw/(Xraw+Yraw)) from heterozygous SNPs with total intensity (Xraw+Yraw) higher than the threshold value of 3000. The scatter plot of β ratio against the logarithm 10 scaled total intensity fits well with polynomial regression model (quadratic regression model). This model shows better fitting than linear regression model we employed earlier for normalization [26], which works well in higher intensity part, but poor in lower intensity part in many samples. The normalization process can be briefly summarized to following steps: 1) The β ratio is calculated along with total intensity in log10 scale for all heterozygous SNPs. 2) All data points with greater than 3000 in total intensity are divided into 50 intensity bins. 3) A fitted curve from the median β ratio in each bin is computed using a polynomial regression model (quadratic regression) y = b1x+b2x2+a where y is expected β ratio from the curve and x is log10 scaled total intensity. 4) From the fitted curve, the expected β ratio based on total intensity calculated. 5) The final normalized β ratio equals (βobs−βexpected+0.5). Following normalization, all median β ratio values in all intensity bins should be close, if not equal, to 0.5.
Empirical probabilities for observing differences in AE for transcripts were assessed by first observing the genome-wide distribution of AE-magnitude at expressed heterozygous sites [Δhet ratio = XDNA/(XDNA+YDNA)−XRNA/(XRNA+YRNA)]. The use of AE magnitude alone allows us to do the comparisons in unphased chromosomes, which we chose to use as a global test since statistical phasing introduces potential errors. However, in case of TNC (Figure 6A), we used derived phased [46] data to show that significant biases at individual sites are observed for the same expressed allele. We defined three SNP expressed windows by requiring that at least three of four consecutive heterozygous sites showed signal above threshold. We note that in comparison across treatments, we used only multi-SNP windows that were above signal threshold in all treatments within an individual. This restricted the analysis to 6791/8097 informative RefSeq genes and captured all informative genes (n = 2880) showing above median expression scores based on Illumina Ref-8 data used in eQTL analysis. Multiplicative likelihood of observing three consecutive SNPs with high Δhet ratio magnitude was compared to 5th percentile of multiplicative likelihood in randomly permuted data from same sample. The same process was used in assessing empirical probability of observing DEX-specific changes in allelic expression, except that direction of effect (greater or lower ΔDexa het ratio) was taken into account for the three consecutive SNPs and we applied the following formula to calculate ΔDex het ratio = XRNA_DEX/(XRNA_DEX+YRNA_DEX)−XRNA_OTHER/(XRNA_OTHER+YRNA_OTHER). The gene-based false discovery rate (FDR) of DEX-specific AE was also empirically assessed for each sample using RefSeq annotated genes where multiple three SNP windows had been independently measured for same transcript and the empirical FDR represents the proportion of discordant calls among all genes from same sample.
CAMP cohort association analyses
Association between TNC SNPs and clinical response to inhaled corticosteroids was performed using information from subjects participating in the Childhood Asthma Management Program (CAMP). CAMP is a multicenter, randomized, double-blind, placebo-controlled trial to investigate the long-term effects of inhaled anti-inflammatory medication (budesonide 200 µg twice daily or nedocromil 8 mg twice daily both versus placebo) in children 5 to 12 years of age. 1,041 asthmatic children were followed for a mean 4.6 years. Trial design and primary outcomes have been published [47]. Individuals were randomized to budesonide, nedocromil, or placebo. Of the non-Hispanic white CAMP probands randomized to inhaled corticosteroids, 118 subjects and their parents were genotyped on the Illumina HumanHap550v3 BeadChip [48], with an additional 52 trios genotyped on the Illumina Human 610-Quad BeadChip. All CAMP subjects provided assent and their legal guardians consent to study protocols and ancillary genetic testing. The two month change in FEV1 in response to inhaled corticosteroids was calculated as previously described and was shown to be normally distributed [49]. Association between TNC SNPs common to both genotyping platforms and inhaled steroid response was calculated using PLINK [41]under the assumption of an additive model and adjusted for non-genetic covariates including sex, height and age.
Supporting Information
Zdroje
1. DixonAL
LiangL
MoffattMF
ChenW
HeathS
2007 A genome-wide association study of global gene expression. Nat Genet 39 1202 1207
2. KwanT
BenovoyD
DiasC
GurdS
ProvencherC
2008 Genome-wide analysis of transcript isoform variation in humans. Nat Genet 40 225 231
3. StrangerBE
NicaAC
ForrestMS
DimasA
BirdCP
2007 Population genomics of human gene expression. Nat Genet 39 1217 1224
4. DimasAS
DeutschS
StrangerBE
MontgomerySB
BorelC
2009 Common regulatory variation impacts gene expression in a cell type-dependent manner. Science 325 1246 1250
5. EmilssonV
ThorleifssonG
ZhangB
LeonardsonAS
ZinkF
2008 Genetics of gene expression and its effect on disease. Nature 452 423 428
6. GoringHH
CurranJE
JohnsonMP
DyerTD
CharlesworthJ
2007 Discovery of expression QTLs using large-scale transcriptional profiling in human lymphocytes. Nat Genet 39 1208 1216
7. GrundbergE
KwanT
GeB
LamKC
KokaV
2009 Population Genomics in a Disease Targeted Primary Cell Model. Genome Res
8. HeinzenEL
GeD
CroninKD
MaiaJM
ShiannaKV
2008 Tissue-specific genetic control of splicing: implications for the study of complex traits. PLoS Biol 6 e1 doi:10.1371/journal.pbio.0060001
9. MyersAJ
GibbsJR
WebsterJA
RohrerK
ZhaoA
2007 A survey of genetic human cortical gene expression. Nat Genet 39 1494 1499
10. SchadtEE
MolonyC
ChudinE
HaoK
YangX
2008 Mapping the genetic architecture of gene expression in human liver. PLoS Biol 6 e107 doi:10.1371/journal.pbio.0060107
11. LeeJH
ParkIH
GaoY
LiJB
LiZ
2009 A robust approach to identifying tissue-specific gene expression regulatory variants using personalized human induced pluripotent stem cells. PLoS Genet 5 e1000718 doi:10.1371/journal.pgen.1000718
12. SmirnovDA
MorleyM
ShinE
SpielmanRS
CheungVG
2009 Genetic analysis of radiation-induced changes in human gene expression. Nature 459 587 591
13. RomanoskiCE
LeeS
KimMJ
Ingram-DrakeL
PlaisierCL
Systems genetics analysis of gene-by-environment interactions in human cells. Am J Hum Genet 86 399 410
14. GrundbergE
BrandstromH
LamKC
GurdS
GeB
2008 Systematic assessment of the human osteoblast transcriptome in resting and induced primary cells. Physiol Genomics 33 301 311
15. ChenD
JiX
HarrisMA
FengJQ
KarsentyG
1998 Differential roles for bone morphogenetic protein (BMP) receptor type IB and IA in differentiation and specification of mesenchymal precursor cells to osteoblast and adipocyte lineages. J Cell Biol 142 295 305
16. LangdahlBL
KassemM
MollerMK
EriksenEF
1998 The effects of IGF-I and IGF-II on proliferation and differentiation of human osteoblasts and interactions with growth hormone. Eur J Clin Invest 28 176 183
17. KajiH
SugimotoT
KanataniM
FukaseM
KumegawaM
1996 Prostaglandin E2 stimulates osteoclast-like cell formation and bone-resorbing activity via osteoblasts: role of cAMP-dependent protein kinase. J Bone Miner Res 11 62 71
18. YaoZ
LiP
ZhangQ
SchwarzEM
KengP
2006 Tumor necrosis factor-alpha increases circulating osteoclast precursor numbers by promoting their proliferation and differentiation in the bone marrow through up-regulation of c-Fms expression. J Biol Chem 281 11846 11855
19. KimHJ
ZhaoH
KitauraH
BhattacharyyaS
BrewerJA
2006 Glucocorticoids suppress bone formation via the osteoclast. J Clin Invest 116 2152 2160
20. LocklinRM
KhoslaS
TurnerRT
RiggsBL
2003 Mediators of the biphasic responses of bone to intermittent and continuously administered parathyroid hormone. J Cell Biochem 89 180 190
21. PandaDK
MiaoD
BolivarI
LiJ
HuoR
2004 Inactivation of the 25-hydroxyvitamin D 1alpha-hydroxylase and vitamin D receptor demonstrates independent and interdependent effects of calcium and vitamin D on skeletal and mineral homeostasis. J Biol Chem 279 16754 16766
22. PastinenT
GeB
GurdS
GaudinT
DoreC
2005 Mapping common regulatory variants to human haplotypes. Hum Mol Genet 14 3963 3971
23. VerlaanDJ
GeB
GrundbergE
HobermanR
LamKC
2009 Targeted screening of cis-regulatory variation in human haplotypes. Genome Res 19 118 127
24. GeB
GurdS
GaudinT
DoreC
LepageP
2005 Survey of allelic expression using EST mining. Genome Res 15 1584 1591
25. PastinenT
SladekR
GurdS
SammakA
GeB
2004 A survey of genetic and epigenetic variation affecting human gene expression. Physiol Genomics 16 184 193
26. GeB
PokholokDK
KwanT
GrundbergE
MorcosL
2009 Global patterns of cis variation in human cells revealed by high-density allelic expression analysis. Nat Genet 41 1216 1222
27. LaitinenA
AltrajaA
KampeM
LindenM
VirtanenI
1997 Tenascin is increased in airway basement membrane of asthmatics and decreased by an inhaled steroid. Am J Respir Crit Care Med 156 951 958
28. IdaghdourY
CzikaW
ShiannaKV
LeeSH
VisscherPM
2010 Geographical genomics of human leukocyte gene expression variation in southern Morocco. Nat Genet 42 62 67
29. SmithEN
KruglyakL
2008 Gene-environment interaction in yeast gene expression. PLoS Biol 6 e83 doi:10.1371/journal.pbio.0060083
30. Cunninghame GrahamDS
GrahamRR
MankuH
WongAK
WhittakerJC
2008 Polymorphism at the TNF superfamily gene TNFSF4 confers susceptibility to systemic lupus erythematosus. Nat Genet 40 83 89
31. DebloisG
GiguereV
2008 Nuclear receptor location analyses in mammalian genomes: from gene regulation to regulatory networks. Mol Endocrinol 22 1999 2011
32. ReddyTE
PauliF
SprouseRO
NeffNF
NewberryKM
2009 Genomic determination of the glucocorticoid response reveals unexpected mechanisms of gene regulation. Genome Res 19 2163 2171
33. MidwoodK
SacreS
PiccininiAM
InglisJ
TrebaulA
2009 Tenascin-C is an endogenous activator of Toll-like receptor 4 that is essential for maintaining inflammation in arthritic joint disease. Nat Med 15 774 780
34. ZhaoY
1999 Tenascin is expressed in the mesenchyme of the embryonic lung and down-regulated by dexamethasone in early organogenesis. Biochem Biophys Res Commun 263 597 602
35. WangD
ChenH
MomaryKM
CavallariLH
JohnsonJA
2008 Regulatory polymorphism in vitamin K epoxide reductase complex subunit 1 (VKORC1) affects gene expression and warfarin dose requirement. Blood 112 1013 1021
36. GentlemanRC
CareyVJ
BatesDM
BolstadB
DettlingM
2004 Bioconductor: open software development for computational biology and bioinformatics. Genome Biol 5 R80
37. BolstadBM
IrizarryRA
AstrandM
SpeedTP
2003 A comparison of normalization methods for high density oligonucleotide array data based on variance and bias. Bioinformatics 19 185 193
38. IrizarryRA
HobbsB
CollinF
Beazer-BarclayYD
AntonellisKJ
2003 Exploration, normalization, and summaries of high density oligonucleotide array probe level data. Biostatistics 4 249 264
39. BaldiP
LongAD
2001 A Bayesian framework for the analysis of microarray expression data: regularized t -test and statistical inferences of gene changes. Bioinformatics 17 509 519
40. StoreyJD
TibshiraniR
2003 Statistical significance for genomewide studies. Proc Natl Acad Sci U S A 100 9440 9445
41. PurcellS
NealeB
Todd-BrownK
ThomasL
FerreiraMA
2007 PLINK: a tool set for whole-genome association and population-based linkage analyses. Am J Hum Genet 81 559 575
42. LiY
AbecasisG
2006 Mach 1.0: Rapid Haplotype Reconstruction and Missing Genotype Inference. Am J Hum Genet S79 2290
43. LiY
WillerC
SannaS
AbecasisG
2009 Genotype imputation. Annu Rev Genomics Hum Genet 10 387 406
44. LiY
WillerC
DingJ
ScheetP
AbecasisG
2006 Rapid Markov Chain Haplotyping and Genotype Inference. Submitted
45. HaoK
ChudinE
McElweeJ
SchadtEE
2009 Accuracy of genome-wide imputation of untyped markers and impacts on statistical power for association studies. BMC Genet 10 27
46. BrowningSR
BrowningBL
2007 Rapid and accurate haplotype phasing and missing-data inference for whole-genome association studies by use of localized haplotype clustering. Am J Hum Genet 81 1084 1097
47. 2000 Long-term effects of budesonide or nedocromil in children with asthma. The Childhood Asthma Management Program Research Group. N Engl J Med 343 1054 1063
48. HimesBE
HunninghakeGM
BaurleyJW
RafaelsNM
SleimanP
2009 Genome-wide association analysis identifies PDE4D as an asthma-susceptibility gene. Am J Hum Genet 84 581 593
49. TantisiraKG
LakeS
SilvermanES
PalmerLJ
LazarusR
2004 Corticosteroid pharmacogenetics: association of sequence variants in CRHR1 with improved lung function in asthmatics treated with inhaled corticosteroids. Hum Mol Genet 13 1353 1359
Štítky
Genetika Reprodukční medicínaČlánek vyšel v časopise
PLOS Genetics
2011 Číslo 1
Nejčtenější v tomto čísle
- H3K9me-Independent Gene Silencing in Fission Yeast Heterochromatin by Clr5 and Histone Deacetylases
- Evolutionary Conserved Regulation of HIF-1β by NF-κB
- Rnf12—A Jack of All Trades in X Inactivation?
- Joint Genetic Analysis of Gene Expression Data with Inferred Cellular Phenotypes