
Horizontal Transfer, Not Duplication, Drives the Expansion of Protein Families in Prokaryotes
Gene duplication followed by neo - or sub-functionalization deeply impacts the evolution of protein families and is regarded as the main source of adaptive functional novelty in eukaryotes. While there is ample evidence of adaptive gene duplication in prokaryotes, it is not clear whether duplication outweighs the contribution of horizontal gene transfer in the expansion of protein families. We analyzed closely related prokaryote strains or species with small genomes (Helicobacter, Neisseria, Streptococcus, Sulfolobus), average-sized genomes (Bacillus, Enterobacteriaceae), and large genomes (Pseudomonas, Bradyrhizobiaceae) to untangle the effects of duplication and horizontal transfer. After removing the effects of transposable elements and phages, we show that the vast majority of expansions of protein families are due to transfer, even among large genomes. Transferred genes—xenologs—persist longer in prokaryotic lineages possibly due to a higher/longer adaptive role. On the other hand, duplicated genes—paralogs—are expressed more, and, when persistent, they evolve slower. This suggests that gene transfer and gene duplication have very different roles in shaping the evolution of biological systems: transfer allows the acquisition of new functions and duplication leads to higher gene dosage. Accordingly, we show that paralogs share most protein–protein interactions and genetic regulators, whereas xenologs share very few of them. Prokaryotes invented most of life's biochemical diversity. Therefore, the study of the evolution of biology systems should explicitly account for the predominant role of horizontal gene transfer in the diversification of protein families.
Published in the journal:
. PLoS Genet 7(1): e32767. doi:10.1371/journal.pgen.1001284
Category:
Research Article
doi:
https://doi.org/10.1371/journal.pgen.1001284
Summary
Gene duplication followed by neo - or sub-functionalization deeply impacts the evolution of protein families and is regarded as the main source of adaptive functional novelty in eukaryotes. While there is ample evidence of adaptive gene duplication in prokaryotes, it is not clear whether duplication outweighs the contribution of horizontal gene transfer in the expansion of protein families. We analyzed closely related prokaryote strains or species with small genomes (Helicobacter, Neisseria, Streptococcus, Sulfolobus), average-sized genomes (Bacillus, Enterobacteriaceae), and large genomes (Pseudomonas, Bradyrhizobiaceae) to untangle the effects of duplication and horizontal transfer. After removing the effects of transposable elements and phages, we show that the vast majority of expansions of protein families are due to transfer, even among large genomes. Transferred genes—xenologs—persist longer in prokaryotic lineages possibly due to a higher/longer adaptive role. On the other hand, duplicated genes—paralogs—are expressed more, and, when persistent, they evolve slower. This suggests that gene transfer and gene duplication have very different roles in shaping the evolution of biological systems: transfer allows the acquisition of new functions and duplication leads to higher gene dosage. Accordingly, we show that paralogs share most protein–protein interactions and genetic regulators, whereas xenologs share very few of them. Prokaryotes invented most of life's biochemical diversity. Therefore, the study of the evolution of biology systems should explicitly account for the predominant role of horizontal gene transfer in the diversification of protein families.
Introduction
Prokaryotes have highly variable gene repertoires, varying from just over 100 genes to nearly 10000 [1], [2]. Such variations in genome size are typically associated with expansions and contractions of protein families. Expansions of protein families are associated with the acquisition of novel functions, novel regulatory structures and system robustness [3]–[5]. They can take place by horizontal gene transfer, in which case homologs are called xenologs, or by intra-chromosomal duplication, in which case homologs are called paralogs. Genes are identical upon duplication and if there is no direct selection on multiple copies, the redundant extra copies are quickly lost. Yet, sometimes gene duplications persist in genomes due to selection for increased gene dosage. Periods of such adaptive gene duplication are windows of opportunity for the acquisition of new functions by the slow evolutionary divergence between the duplicates [6]–[8]. Duplicated genes can thus be fixed because sub - or neo-functionalization processes render the two copies adaptive when selection for higher gene dosage ceases (reviewed in [9]–[12]). There is ample evidence that intra-chromosomal gene duplication (IGD) has an adaptive role in bacteria [13], [14], e.g. in antigenic variation, antibiotic resistance or in genome expansion [8], [15]–[19]. Furthermore, models aiming at explaining the patterns of biological networks are in general based on the preconception that protein families expand by gene duplication processes [20], [21].
Horizontal gene transfer (HGT) results in the acquisition of radically new genetic information, liberating genomic evolutionary processes from tinkering exclusively with pre-existing genes [22]–[24]. HGT occurs at very high rates leading to very large species pan-genomes [25]. Yet, while up to 96% of the genes in a given prokaryote genome might have been affected by HGT [26]–[28], it has been estimated that HGT contributes at best to 25% of all expansions of protein families [26], [29]–[32] (22% overall but 60% for large protein families in [23]). These contradictory conclusions require an explanation. Prior analyses on the relative abundance of paralogs over xenologs were performed several years ago using the available distant genomes. However, comparisons of genomes from very divergent lineages pose several problems: (i) disambiguation of orthologs, paralogs and xenologs is very error-prone, (ii) lineages are saturated with changes, (iii) expansions within terminal branches are associated with paralogy when they can result from HGT between closely related taxa. In fact, long terminal branches hide a complex history of duplications and transfer and consequently the relative roles of transfer and duplication can only be assessed using closely related genomes.
Here, we apply a protein family analysis pipeline to a multitude of closely related complete genomes to re-examine the role of transfer and duplication in expansion of protein families in prokaryotes. Our comparisons involve genomes that have diverged recently (Figures S1 and S2). As a result, we can use sequence similarity and co-localization information to infer accurate core genomes, phylogenies and ancestral events. At these evolutionary distances, paralogs arising from duplications having occurred since the last common ancestor are very similar in sequence and thus can easily be separated from most xenologs. Finally, at these evolutionary scales the population data enables the analysis of fixation of protein family expansions and test if some processes have a longer-term effect on genomes than others.
Results
Identification and characterization of protein families
We analyzed 110 genomes encompassing eight distant clades (Table S1): Helicobacter, Neisseria, Streptococcus and Sulfolobus (small genomes, ∼2 Mb), Enterobacteriaceae and Bacillus (average, ∼4–5 Mb), Bradyrhizobiaceae and Pseudomonas (large, ∼6 Mb). The clades were selected to include a large number of closely related genomes and to span diverse phyla, G+C contents and genome sizes (Table 1). By using sequence similarity analysis followed by clustering (see Materials and Methods), we obtained a set of 59,541 families containing a total of 419,035 proteins (Table 1). Families with exactly one member per genome and where all members are highly similar (i.e. putative orthologs) were used to define the core genomes and to build highly robust phylogenetic trees of the clades (100% bootstraps in nearly all branches, Figure S3). Many families (48%) consisted of singletons, i.e. they contained one single protein, thereby confirming that new families in prokaryotes are introduced at high rates by HGT. These families were excluded from the analysis.

Given the pattern of presence/absence of genes and a reference tree, we inferred gene expansion events with BayesTraits [33]. Families without protein expansions within the lineages were excluded from further analysis. We also removed IS and phage sequences, but not the corresponding cargo regions, because these elements constitute a large fraction of repeats in genomes [15], are known to be horizontally transferred and are in general quickly lost [34], [35]. Our main analysis includes the remaining 3190 families. These families have few members (0–3) in each genome (Figure 1) showing that expansions are rare at these narrow evolutionary scales. This is in agreement with high rates of change but low rates of fixation of changes in gene repertoires [36], [37]. The most frequent event found in our data was the gain of a paralog or xenolog by the largest genomes in the clade (Table S2), such as S. agalactiae NEM316 (20% of all expansions in Streptococcus). Around 50% of all gene expansions occur in the clade with largest genomes –Bradyrhizobium - with 35% occurring in the two largest genomes of that clade. Although families with recent expansions account for a small fraction of genomes this is in good agreement with an association between expansions of protein families and increased genome size.

Expansions of protein families arise most frequently by HGT
Duplication processes in prokaryotes produce tandem, strictly identical copies of genes [8], [38], [39]. At the evolutionary distances considered in this work, this implies that paralogs arising in the lineages are co-localized because of the low rearrangement rates and are highly similar in sequence because of the low mutation rates. On the other hand, transferred genes are inserted almost randomly in genomes and show a large range of sequence similarity relative to the native homolog. Therefore, we disentangle IGD from HGT using sequence similarity and positional information (see Materials and Methods). We define a minimal similarity threshold for paralogs assuming that they evolve at rates close to the ones of the core genome. This threshold is therefore based on the distribution of similarities between pairs of orthologs of the core genome. More precisely, we define three thresholds corresponding to values where protein divergence exceeds that of 95%, 99% or 99.9% of the comparisons between orthologous core genes. Different thresholds produced qualitatively similar results and we use the 99% thresholds throughout this work (see Materials and Methods, Figure S4). The use of sequence similarity alone will lead to spurious classification of genes transferred between closely related genomes, because such genes are expected to be highly similar. We thus add the positional criterion considering that two genes are co-localized if no core gene separates them. Expansions producing highly similar co-localized homologs are thus assumed to be created by IGD, whereas the others are created by HGT. We find that the vast majority, between 88% and 98%, of the expansions of protein families are due to HGT (Figure 2). This is true even for large genomes, such as in Bradyrhizobiaceae, which have been proposed to increase in size by gene duplication. Hence, by default, expansions are much more likely to arise by transfer than by internal duplication.

The majority (65%) of the expansions are assigned to HGT using either the criterion of sequence similarity or of co-localization, showing the robustness of the method. If one removes the co-localization criterion, thus assuming that expansions of highly similar proteins arise exclusively by IGD, we still find HGT as the major cause for expansions of protein families in 6 of the 8 clades. The two exceptions, Neisseria and Helicobacter, have a disproportionate fraction of highly similar homologs in different locations in the genome so that removing the co-localization criterion impacts significantly in the relative contribution of IGD (resp. accounting for 78% and 45%). It is well-established that such repeated elements often engage in gene conversion for antigenic variation both in Neisseria and in Helicobacter [40], [41]. Interestingly, both clades naturally transform conspecific DNA and are known to have extremely high rates of intra-species horizontal transfer [42], [43]. The high frequency of HGT within the species is liable to produce a large fraction of very similar xenologs scattered in the genome. This factor is presumably corrected by the use of the co-localization criterion. Importantly, the relative abundance of xenologs over paralogs in the largest genomes, the ones with more expansions, remains almost unchanged when removing the co-localization criterion.
Xenologs persist longer than paralogs
HGT might be less relevant if xenologs were lost at higher rates than paralogs. We calculated the age of introduction of each gene in its lineage. We found that xenologs have an average age of introduction that is twice that of paralogs (Mann-Whitney-Wilcoxon, p<0.0001). Xenologs are therefore more persistent than paralogs (Table 2). These results remain qualitatively unchanged when discarding positional information (same test, p<0.0001). This trend holds for all clades, except for Helicobacter and Bradyrhizobiaceae, where differences are not statistically significant. The phylogenetic tree of Helicobacter has very small internal branches (Figure S3) and we only identified 25 ancient events in them. All 25 ancient events correspond to HGT suggesting that paralogs are quickly purged also in Helicobacter. In Bradyrhizobiaceae all terminal branches are long thereby reflecting a mixture of recent and ancient events (Figure S2). There is thus no significant difference between internal and terminal nodes. Yet, HGT created ∼98% of family expansions in both the internal and the terminal branches of this lineage. Overall, these results show that expansions by HGT are more abundant and remain for longer periods of time in genomes.

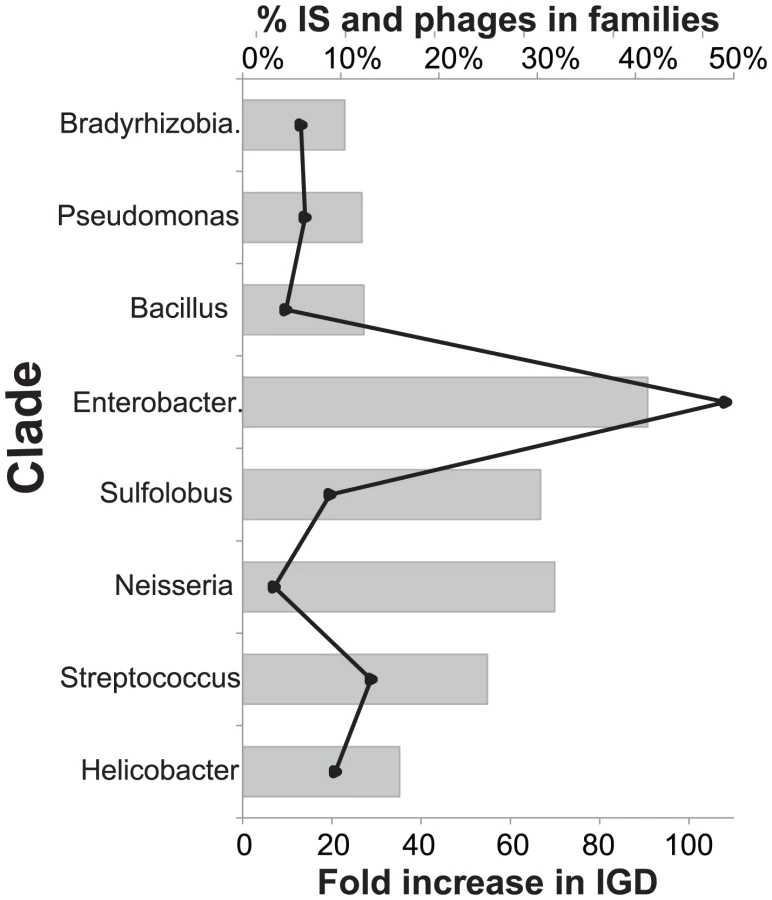
Mobile elements spuriously inflate the estimates of paralogy
Prophages and IS were removed from the previous analyses. Since they represent 10–40% of all expansions of protein families (Figure 3) we analyzed the effect of re-introducing them. As expected this resulted in similar conclusions. When including IS and phages in the analyses we still find that HGT accounts for more than 88% of expansions in all clades. However, if we include prophages and IS and drop the co-localization criterion, we infer a dramatic increase in duplications (Figure 3). The effect is most pronounced in Enterobacteriaceae where expansions associated to IGD increase 100 fold, largely caused by the abundance of homologous lambda-like prophages in these genomes and at a much lesser extent by the expansion of transposable elements in Shigella. In spite of this, expansions of protein families are predominantly classified as HGT in all but the smallest genomes (Neisseria, Streptococcus, Sulfolobus). The scattered insertion of homologous prophage and transposable elements in genomes can thus introduce in the analysis many family expansions that are spuriously assigned to gene duplications when in fact they result from horizontal transfer and are quickly lost. The co-localization criterion renders the method robust to mobile elements even when they are not explicitly removed. In the subsequent analyses we use the original dataset where prophages and IS are excluded.
Paralogs are more highly expressed
Are there significant differences between protein families expanding by duplication or transfer? To answer this question we restricted the following analyses to E. coli because it is the only species for which there is sufficient genome-wide experimental data. We first tested if the two classes of protein families have different gene expression levels using the codon adaptation index (CAI; [44]). CAI is higher for paralogs than for xenologs (0.68 and 0.48, Mann-Whitney-Wilcoxon test, p<0.0001) and smallest for genes in families without expansions (0.42, Figure 4). Similar results were found using proteomic data (emPAI) [45] (p<0.005). We conclude that paralogs are more expressed than xenologs. While this is at odds with previous work on E. coli, where genes with the lowest CAI were found to be overrepresented among recent duplications [30], this discrepancy probably results from our explicit removal of IS and phages that have very low CAI because they are A+T rich and are lowly expressed under exponential growth. When such elements are removed from the analysis it is clear that families with expansions are more expressed than average and, in particular, the families producing paralogs.

Xenologs evolve faster
To analyze the evolutionary rates of paralogs and xenologs we aligned them to the corresponding ortholog, when there was one. We analyzed separately non-synonymous (dN) and synonymous (dS) substitution rates, after excluding highly divergent pairs (if dS>1.5) [46]. As expected we found the highest dN and dS values in xenologs (dSHGT = 0.43, dSIGD = 0.26, p<0.001; dNHGT = 0.07, dNIGD = 0.03, p<0.001, Mann-Whitney-Wilcoxon tests). The lower values of dN and dS reflect the recent divergence of paralogs relative to xenologs and the methodological bias of imposing a sequence similarity filter to paralogs. But the plot of dS against dN shows that dN/dS is 50% higher for xenologs than for paralogs over the entire range of dN and dS values (p = 0.01, Wilcoxon test, Figure 5). This strongly suggests that xenologs evolve faster. Yet, we capped paralog similarity in proteins using the sequence similarity threshold and this might bias our dN/dS estimate. To make a direct comparison of dS and dN values between paralogs and xenologs, we filtered the latter using the same similarity threshold as used for paralogs. We found that both dN and dS were higher in xenologs than in paralogs (p<0.01, Mann-Whitney-Wilcoxon tests). We also tested if higher evolutionary rates in xenologs were caused by amelioration to the host GC content [47] (see Materials and Methods). As expected, xenologs have higher G+C deviations to the core genome than paralogs (0.05 vs. 0.04, p<0.01, Wilcoxon test). This difference is small, as found previously in Salmonella [48], possibly because we removed IS and phages. For similar GC deviations we still found that xenologs have higher synonymous and non-synonymous substitution rates (Mann-Whitney-Wilcoxon tests on the ratio of the rate over Δ(G+C), both p<0.05). These results show that xenologs evolve faster. This could be caused by relaxed selection on protein function in xenologs relative to paralogs, but this explanation seems at odds with our observation that xenologs are more persistent than paralogs. Instead, the results are consistent with the observed negative correlation between expression levels and both dN and dS in E. coli [49]. Paralogs being more expressed than xenologs, they evolve slower in synonymous positions, due to selection on codon usage bias, and even slower in non-synonymous positions, due to purifying selection on protein sequence.

Xenologs share fewer protein interactions
To assess the differences between the processes of protein family expansions in terms of cellular networks we used a set of 74,776 protein-protein interactions (PPI) in E. coli MG1655 [50]. We computed the fraction of interactions shared by pairs of proteins in families with expansions (ΔPPI). As expected, paralogs share more interactions than xenologs (ΔPPI 1.0 and 0.30, p<0.01, Mann-Whitney-Wilcoxon test), even when discarding positional information in paralog and xenolog disambiguation (0.61 and 0.29, p<0.001, same test). As similarity increases between the pair of proteins so does the percentage of shared protein interactions (R2 = 0.60, p<0.01). Highly similar xenologs have ΔPPI similar to paralogs. Hence, the differences observed between xenologs and paralogs in terms of their integration in protein-protein interactions reflect the intrinsic consequences of the mechanisms of acquisition; xenologs may or may not be very similar in sequence, but recent paralogs are necessarily very similar. As a result, PPI networks will evolve very differently in lineages affected by horizontal transfer relative to lineages with strictly vertical transmission of genetic information.
Xenologs share fewer regulatory mechanisms
We then estimated the genetic regulation overlap between paralogs and between xenologs. We computed the fraction of shared regulatory interactions as the number of regulators interacting with both homologs over the sum of regulators interacting with at least one of them. Homologs with no known interactions were recorded as zero. We used E. coli data [51] on 2020 regulators including regulation by (1) transcription factors, (2) RNA-binding proteins, (3) sigma factors, (4) protein–protein interactions and 5) DNA supercoiling. As expected, paralogs share more regulators than xenologs (0.1 to 0.0, p = 0.06, Mann-Whitney-Wilcoxon test). The difference is small because most genes have no known regulators in contemporary datasets. We therefore restricted our analysis to genes known to be under the control of at least one regulator. In this case, paralogs share twice the regulators of xenologs (p<0.0001, same test). Hence, the evolution of regulatory networks by expansion of protein families depends on the type of mechanism involved. As it is the case for protein-protein interactions, duplications generate paralogs with overlapping regulatory dependencies, whereas transfer generates xenologs that potentially have highly different regulatory dependencies. This picture is in agreement with the frequently observed co-transfer of transcription factors and their target genes [52], and subsequent slow integration of these sub-networks in the larger genetic network [53].
Discussion
Contrary to previous studies, we found a high rate of HGT in all eight clades of prokaryotes analyzed in this study. At least 88% of all expansions of protein families originated by HGT noth when including or discarding prophages and IS. The largest genomes in each clade are also the ones containing more new xenologs. This is concordant with the proposed role of horizontal transfer in the increase in size of the largest bacterial genomes [54]. The important contribution of xenology to family expansions is also consistent with data showing E. coli's promiscuity to most transferred genes [55] and data highlighting the impact of transferred genes on the evolution of Salmonella [56]. It has been proposed that due to deletion biases in prokaryotes, gene duplications are not afforded with sufficient opportunity for neo - or sub-functionalization, reducing its role to transient gene amplification [57]. Xenologs are related, yet different, proteins that can provide a potentially advantageous distinct function immediately upon transfer. Since they tend to be located apart from the native homolog they are also less prone to genetic deletion. These two effects contribute to explain the higher persistence of xenologs.
Our disambiguation method uses information on gene co-localization and protein sequence similarity, which can both lead to misclassifications. There are two major sources of errors when using the co-localization criterion. First, while amplifications generally occur in tandem, they may be separated by genome rearrangements and produce spurious xenologs. This is unlikely to produce many false classifications in the present work because: (i) dropping the co-localization criterion still results in a preponderance of xenologs, (ii) rearrangements are rare at these evolutionary distances [58]. Second, xenologs can integrate close to their homolog in the genome. This can occur by chance alone, as a rare event, or because transferred genes tend to insert in integration hotspots. Additionally, amplified regions in one chromosome can be transferred as one single block into another genome. This will lead to spurious classification of these xenologs as paralogs. We found that around 7% of the highly divergent xenologs are co-localized. It is therefore likely that around 7% of the highly similar xenologs are mis-classified as paralogs. Highly similar xenologs are a minority of all xenologs suggesting that the analysis is not affected in an important way by co-localized gene transfer. On the other hand, the co-localization criterion is very useful to control for two effects that lead to the misclassification of xenologs: (i) the propagation of mobile genetic elements such as prophages, (ii) extensive gene transfer within the species.
The sequence similarity threshold allows classing the highly divergent pairs of genes as xenologs but can be misleading in some circumstances. If paralogs and core genome proteins evolve at similar rates, then the threshold (similarity lower than 99% of genes of the core genome) means that ∼1% of duplicated genes are spuriously classed as xenologs. This fraction of false positives has a negligible impact in the quantification of xenology. Yet, our estimation of false positives might be affected by two factors of opposite effect. First, core genes might evolve slower than families with paralogs, placing the sequence similarity threshold too high and thereby increasing the number of spurious xenologs. This is unlikely because paralogs are highly expressed, and thus highly conserved, and high similarity and physical proximity between paralogs favors gene conversion, which also slows evolutionary rates. Second, we find that most expansions are recent, thus duplicates should be very similar, but we use a sequence similarity threshold that includes comparisons involving core genes between all, including the most distant, genomes in the clade. This leads to a conservative (i.e. too low) sequence similarity threshold. Importantly, variations in the sequence similarity threshold produced no significant changes in the results: xenolog expansions vastly outnumber paralog expansions.
Many models assume that duplication is the major mechanism underlying the evolution of protein-protein interactions (PPI) [4], [20] or regulatory networks [21]. Duplications constrain genomic evolutionary processes to tinker with pre-existing information producing identical genes that are functionally and genetically redundant. Instead, horizontal transfer allows the acquisition of xenologs with differentiated functions and regulatory networks. These processes have thus different roles in the evolution of protein families. Here, we showed extensive evidence that paralogs and xenologs have different characteristics. Paralogs are more highly expressed, more conserved in sequence and they share regulatory networks and physical interactions. This is consistent with experimental works showing that paralogy is often transiently selected to attain higher gene dosage [8]. Xenologs exhibit expression levels closer to that of the average gene, they differ remarkably from their pair in their physical and genetic interactions and they tend to persist longer in populations. Contrary to the current view, transfer might then be responsible for most long-term adaptive expansions of protein families in prokaryotes. As such, expansions are a particular case of the processes leading to the horizontal transfer of genetic information that is known to shape metabolic [59], genetic [53] and interaction networks [60], [61] in prokaryotes. Importantly, recent works have shown that extensive horizontal transfer also exists among eukaryotes [62]–[64]. These results may thus also be relevant to understand the evolution of biological processes in eukaryotes.
Materials and Methods
Bacterial strains
We analyzed the genome sequences of bacteria from eight widely studied phylogenetic groups representing four different genome sizes (Table S1).
Small (∼1.5–3 Mb)
8 Helicobacter (7 Helicobacter pylori and 1 Helicobacter acinonychis), 11 Neisseria (8 Neisseria meningitidis, 2 Neisseria gonorrhoeae, 1 Neisseria lactamica), 17 Streptococcaceae (12 Streptococcus pyogenes, 3 Streptococcus equitans, 2 Streptococcus agalactiae). and 7 Sulfolobus (6 Sulfolobus islandicus, 1 Sulfolobus solfataricus).
Average (4–5 Mb)
41 Enterobacteriaceae (28 Escherichia and 13 Salmonella), 12 Bacillus (8 Bacillus cereus, 2 Bacillus thuringiensis, 1 Bacillus anthracis, 1 Bacillus weihenstephanensis).
Large (∼6 Mb)
9 Bradyrhizobiaceae (6 Rhodopseudomonas and 3 Bradyrhizobium), 5 Pseudomonas (4 Pseudomonas putida and 1 Pseudomonas fluorescens). Unfortunately, a deeply sequenced clade containing only very large genomes (>7 Mb) is not yet available. On the other end of the spectrum, genomes much smaller than Helicobacter have few family expansions. All genomes were retrieved from Genbank, except for Neisseria lactamica that was provided by the Sanger Center.
Gene family construction
The procedure used for defining gene families is summarized as follows (Figure 6). First, we performed in each clade all-against-all BLASTP [65] comparisons, inter - and intra - genomically. We set the e-value cutoff to 10−7, required the hits to be at least 100 aa in length and the length of the BLASTP hit to span at least 70% of the length of the smallest protein. Also, similar to the procedure in [23] we evaluated the results with a BLASTP bit score threshold equal to 30% of the maximal bit score (i.e. a protein matching itself). Since we are interested in multi-gene families (i.e. at least one genome has two or more genes), we clustered pairwise BLASTP hits into multiple relationships using mclblastline from MCL [66], with parameters: --blast-m9 --blast-score = e --blast-sort = a --mcl-I = 2.0 --mcl-scheme = 7. After inspection of the results using inflation parameter values from 1.0 to 10.0 in increments of 0.2, we set it to 2.0.

Identification and removal of IS, prophages, and rDNA repeats
Insertion Sequences (IS) were identified by BLASTP query of a custom IS database, including all Uniprot transposases (Touchon, in preparation) and removed from the analysis. We verified that for E. coli our databank contained all IS present in IS Finder [67]. We used Phage_finder to predict prophages [68]. IS are frequently pseudogenized. To remove small fragments of IS elements we searched for regions of homology with known IS in the genome using Repeatoire [69].
Core genome construction
Since genomes in each clade have diverged recently, the orthologs should be highly similar. We enlisted OrthoMCL [70] to build the groups of orthologs inside of the gene families via all-against-all BLASTP comparisons in a clade of interest. OrthoMCL defines putative orthologous relationships between a pair of genomes as BLASTP reciprocal better/best hits. To limit false positives this list was further refined by combining information on the distribution of similarity of these putative orthologs with gene order conservation data (as in [71]). At these distances, gene order conservation is high [58], and positional information can significantly decrease classification errors [72]. Each ortholog pair was then tested for gene order conservation via the ordered list of putative orthologs between the two genomes (i.e. lateral transfer is discounted). Genes not satisfying the constraint are removed from the core genome. Finally, we removed all ortholog pairs less than 65% similar in sequence and differing by more than 30% in length. Naturally, one cannot exclude that some core genes have endured changes by homologous recombination with exogenous genetic material. Yet, gene conversion requires very high similarity and such effects will not affect significantly our study. On the other hand the rare xenologous replacements of core genes by very divergent sequences are expected to lead to loss of synteny and they are therefore discarded from our core genome.
Phylogenetic analyses
The reference phylogenetic tree of each clade was reconstructed from the concatenated alignments of genes comprising their core genome. Protein alignments were generated using MUSCLE [73] and then back-translated to DNA. Tree-Puzzle [74] was used to generate the matrix of distances by maximum likelihood with the HKY+Γ model and exact parameter estimates. The trees were then computed from these distance matrices using BIONJ [75]. We performed 100 bootstrap experiments on the concatenated sequences to assess the robustness of the topology.
Ancestral state reconstruction
We used the reference phylogeny and maximum likelihood (ML) optimization in the “Multistates” component of BayesTraits [33] to estimate ancestral states (0, gene not present, 1, family with no expansions, 2, expanded family, Table S3) for each gene family on all branches of the taxa. We enabled the covarion model for trait evolution, a variant of the continuous-time Markov model that allows for traits to vary their rate of evolution within and between branches. 100 optimization attempts were carried out to find the ML solution. For each node, a gene expansion was considered as present (state = 2) if its probability as estimated by BayesTraits was ≥0.5 (the analysis was repeated with p≥0.9 and yielded similar results). In our analysis we only included gene expansion events, not deletions.
Calculating the age of expansions
Using the BayesTraits ancestral state information [33], we calculated the age of expansions as the distance from the leaf node (genome currently containing the paralog or xenolog) to the ancestral node where the gene expansion event occurred (with respect to the root). Expansions appearing in genomes with very long terminal edges were discarded because they might include recent and ancient acquisitions. This includes the following genomes: E. fergusonii, P. fluorescens, S. equitans, S. agalactiae.
Classifying the origin of gene family expansions
The key point of our methodology is the disambiguation between paralogs and xenologs by combining two key pieces of evidence: (1) sequence similarity and (2) positional information (Figure 6).
1) Sequence similarity
Genes deriving from a single gene in the last common ancestor of a clade are highly similar because mutations accumulate at a slow pace and the clades selected in this study have diverged recently. In this case the distribution of similarities within gene families of the core genome is narrowly distributed around 100% (Figure 7). As the last common ancestor between two genomes becomes more distant, e.g. comparisons between different species or genera, the range of similarity of genes in the core genome becomes larger. After a certain evolutionary distance, a significant number of duplications preceding the last common ancestor will be less divergent than some orthologs of the core genome because genes evolve at markedly different rates (Figure 7). This is why it is crucial to restrict the analysis to closely related genomes. To define a meaningful threshold of similarity we computed all pairwise sequence similarities between orthologous core genes. We then identified the 99% threshold of sequence similarity, i.e. the sequence similarity below which we found only 1% of the pairwise comparisons. Two genes were regarded as highly similar when their sequence similarity was above this threshold. If the paralogs evolve as the core genome then this threshold implicates that ∼1% of paralogs are spuriously assigned as xenologs. We re-did all the analysis with the 95% and 99.9% threshold for the two clades with highest and lowest fraction of xenologs over paralogs (Enterobacteriaceae and Neisseria). The results remain largely unchanged (Figure S4). A gene arising in a lineage after the last common ancestor that has a similarity lower than that of the 99% of comparisons between the genes of the core genome is regarded as having diverged excessively to result from a duplication process and we infer that it arose by horizontal gene transfer.

2) Positional information
The remaining recently acquired genes are more similar to at least one member of the gene family than 1% of the pairwise similarities within families of the core genome. These may have arisen by gene duplication or by transfer from genomes containing closely related copies of the gene, e.g. conspecifics. Many experimental and in silico studies indicate that genetic duplications in prokaryotes create tandem repeats [8], [38], [39]. Since rearrangements occur at low rates in prokaryotes, recent paralogs are expected to be co-localized. Hence, we regard co-localized highly similar expansions as paralogs and non-colocalized expansions as xenologs. Using the syntenic map provided by the core genome and the core genome genes as markers of gene order in the ancestral genome, if two gene expansions are located in the same syntenic block and not separated by core genome genes, then they are regarded as co-localized. For paralogs or xenologs that fall in positions corresponding to synteny breakpoints in a genome, if they are inside the same breakpoint region they are considered to be co-localized. In any other situation we consider that the position is not conserved. Although, strictly speaking, genetic duplications occur in tandem, we used this more flexible definition of co-localization because pairs of paralogs can be separated by insertions and deletions after duplication (these newly arising spacing genes are not part of the core genome).
Supporting Information
Zdroje
1. McCutcheonJP
McDonaldBR
MoranNA
2009
Origin of an alternative genetic code in the extremely small and GC-rich genome of a bacterial symbiont.
PLoS Genet
5
e1000565
doi:10.1371/journal.pgen.1000565
2. SchneikerS
PerlovaO
KaiserO
GerthK
AliciA
2007
Complete genome sequence of the myxobacterium Sorangium cellulosum.
Nat Biotechnol
25
1281
1289
3. PasekS
RislerJL
BrezellecP
2006
The role of domain redundancy in genetic robustness against null mutations.
J Mol Biol
362
184
191
4. Pereira-LealJB
LevyED
KampC
TeichmannSA
2007
Evolution of protein complexes by duplication of homomeric interactions.
Genome Biol
8
R51
5. WagnerA
2008
Gene duplications, robustness and evolutionary innovations.
Bioessays
30
367
373
6. FrancinoMP
2005
An adaptive radiation model for the origin of new gene functions.
Nat Genet
37
573
577
7. KugelbergE
KofoidE
ReamsAB
AnderssonDI
RothJR
2006
Multiple pathways of selected gene amplification during adaptive mutation.
Proc Natl Acad Sci U S A
103
17319
17324
8. AnderssonDI
HughesD
2009
Gene amplification and adaptive evolution in bacteria.
Annu Rev Genet
43
167
195
9. ConantGC
WolfeKH
2008
Turning a hobby into a job: how duplicated genes find new functions.
Nat Rev Genet
9
938
950
10. RothC
RastogiS
ArvestadL
DittmarK
LightS
2007
Evolution after gene duplication: models, mechanisms, sequences, systems, and organisms.
J Exp Zoolog B Mol Dev Evol
308
58
73
11. DemuthJP
HahnMW
2009
The life and death of gene families.
Bioessays
31
29
39
12. InnanH
KondrashovF
2010
The evolution of gene duplications: classifying and distinguishing between models.
Nat Rev Genet
11
97
108
13. AlmE
HuangK
ArkinA
2006
The evolution of two-component systems in bacteria reveals different strategies for niche adaptation.
PLoS Comput Biol
2
e143
doi:10.1371/journal.pcbi.0020143
14. SerresMH
KerrAR
McCormackTJ
RileyM
2009
Evolution by leaps: gene duplication in bacteria.
Biol Direct
4
46
15. TreangenTJ
AbrahamAL
TouchonM
RochaEP
2009
Genesis, effects and fates of repeats in prokaryotic genomes.
FEMS Microbiol Rev
33
539
571
16. ChoNH
KimHR
LeeJH
KimSY
KimJ
2007
The Orientia tsutsugamushi genome reveals massive proliferation of conjugative type IV secretion system and host-cell interaction genes.
Proc Natl Acad Sci U S A
104
7981
7986
17. GoldmanBS
NiermanWC
KaiserD
SlaterSC
DurkinAS
2006
Evolution of sensory complexity recorded in a myxobacterial genome.
Proc Natl Acad Sci U S A
103
15200
15205
18. McLeodMP
WarrenRL
HsiaoWW
ArakiN
MyhreM
2006
The complete genome of Rhodococcus sp. RHA1 provides insights into a catabolic powerhouse.
Proc Natl Acad Sci U S A
103
15582
15587
19. LindroosH
VinnereO
MiraA
RepsilberD
NaslundK
2006
Genome rearrangements, deletions, and amplifications in the natural population of Bartonella henselae.
J Bacteriol
188
7426
7439
20. EvlampievK
IsambertH
2008
Conservation and topology of protein interaction networks under duplication-divergence evolution.
Proc Natl Acad Sci U S A
105
9863
9868
21. TeichmannSA
BabuMM
2004
Gene regulatory network growth by duplication.
Nat Genet
36
492
496
22. OchmanH
LawrenceJG
GroismanEA
2000
Lateral gene transfer and the nature of bacterial innovation.
Nature
405
299
304
23. LeratE
DaubinV
OchmanH
MoranNA
2005
Evolutionary origins of genomic repertoires in bacteria.
PLoS Biol
3
e130
doi:10.1371/journal.pbio.0030130
24. GogartenJP
DoolittleWF
LawrenceJG
2002
Prokaryotic evolution in light of gene transfer.
Mol Biol Evol
19
2226
2238
25. TettelinH
RileyD
CattutoC
MediniD
2008
Comparative genomics: the bacterial pan-genome.
Curr Opin Microbiol
11
472
477
26. KuninV
OuzounisCA
2003
The balance of driving forces during genome evolution in prokaryotes.
Genome Res
13
1589
1594
27. ZhaxybayevaO
GogartenJP
CharleboisRL
DoolittleWF
PapkeRT
2006
Phylogenetic analyses of cyanobacterial genomes: quantification of horizontal gene transfer events.
Genome Res
16
1099
1108
28. DaganT
Artzy-RandrupY
MartinW
2008
Modular networks and cumulative impact of lateral transfer in prokaryote genome evolution.
Proc Natl Acad Sci U S A
105
10039
10044
29. SnelB
BorkP
HuynenMA
2002
Genomes in flux: the evolution of archaeal and proteobacterial gene content.
Genome Res
12
17
25
30. HooperSD
BergOG
2003
Duplication is more common among laterally transferred genes than among indigenous genes.
Genome Biol
4
R48
31. GeversD
VandepoeleK
SimillonC
Van de PeerY
2004
Gene duplication and biased functional retention of paralogs in bacterial genomes.
Trends Microbiol
12
148
154
32. PushkerR
MiraA
Rodriguez-ValeraF
2004
Comparative genomics of gene-family size in closely related bacteria.
Genome Biol
5
R27
33. PagelM
MeadeA
BarkerD
2004
Bayesian estimation of ancestral character states on phylogenies.
Syst Biol
53
673
684
34. WagnerA
2006
Periodic extinctions of transposable elements in bacterial lineages: evidence from intragenomic variation in multiple genomes.
Mol Biol Evol
23
723
733
35. TouchonM
RochaEP
2007
Causes of insertion sequences abundance in prokaryotic genomes.
Mol Biol Evol
24
969
981
36. van PasselMW
MarriPR
OchmanH
2008
The emergence and fate of horizontally acquired genes in Escherichia coli.
PLoS Comput Biol
4
e1000059
doi:10.1371/journal.pcbi.1000059
37. RochaEP
2008
Evolutionary patterns in prokaryotic genomes.
Curr Opin Microbiol
11
454
460
38. RomeroD
PalaciosR
1997
Gene amplification and genomic plasticity in prokaryotes.
Annu Rev Genet
31
91
111
39. AchazG
RochaEPC
NetterP
CoissacE
2002
Origin and fate of repeats in bacteria.
Nucleic Acids Res
30
2987
2994
40. Howell-AdamsB
SeifertHS
2000
Molecular models accounting for the gene conversion reactions mediating gonococcal pilin antigenic variation.
Mol Microbiol
37
1146
1158
41. ArasRA
KangJ
TschumiAI
HarasakiY
BlaserMJ
2003
Extensive repetitive DNA facilitates prokaryotic genome plasticity.
Proc Natl Acad Sci U S A
100
13579
13584
42. FalushD
KraftC
TaylorNS
CorreaP
FoxJG
2001
Recombination and mutation during long-term gastric colonization by Helicobacter pylori: estimates of clock rates, recombination size, and minimal age.
Proc Natl Acad Sci U S A
98
15056
15061
43. FeilEJ
HolmesEC
BessenDE
ChanMS
DayNP
2001
Recombination within natural populations of pathogenic bacteria: short - term empirical estimates and long-term phylogenetic consequences.
Proc Natl Acad Sci U S A
98
182
187
44. SharpPM
LiWH
1987
The codon Adaptation Index - a measure of directional synonymous codon usage bias, and its potential applications.
Nucleic Acids Res
15
1281
1295
45. MasudaT
SaitoN
TomitaM
IshihamaY
2009
Unbiased quantitation of Escherichia coli membrane proteome using phase transfer surfactants.
Mol Cell Proteomics
8
2770
2777
46. ParmleyJL
HurstLD
2007
How common are intragene windows with KA>KS owing to purifying selection on synonymous mutations?
J Mol Evol
64
646
655
47. LawrenceJG
OchmanH
1997
Amelioration of bacterial genomes: rates of change and exchange.
J Mol Evol
44
383
397
48. VernikosGS
ThomsonNR
ParkhillJ
2007
Genetic flux over time in the Salmonella lineage.
Genome Biol
8
R100
49. RochaEPC
DanchinA
2004
An analysis of determinants of protein substitution rates in Bacteria.
Mol Biol Evol
21
108
116
50. HuP
JangaSC
BabuM
Diaz-MejiaJJ
ButlandG
2009
Global functional atlas of Escherichia coli encompassing previously uncharacterized proteins.
PLoS Biol
7
e96
doi:10.1371/journal.pbio.1000096
51. Martinez-NunezMA
Perez-RuedaE
Gutierrez-RiosRM
MerinoE
2010
New insights into the regulatory networks of paralogous genes in bacteria.
Microbiology
156
14
22
52. PriceMN
DehalPS
ArkinAP
2008
Horizontal gene transfer and the evolution of transcriptional regulation in Escherichia coli.
Genome Biol
9
R4
53. LercherMJ
PalC
2008
Integration of horizontally transferred genes into regulatory interaction networks takes many million years.
Mol Biol Evol
25
559
567
54. CorderoOX
HogewegP
2009
The impact of long-distance horizontal gene transfer on prokaryotic genome size.
Proc Natl Acad Sci U S A
106
21748
21753
55. SorekR
ZhuY
CreeveyCJ
FrancinoMP
BorkP
2007
Genome-wide experimental determination of barriers to horizontal gene transfer.
Science
318
1449
1452
56. VernikosG
ThomsonN
ParkhillJ
2007
Genetic flux over time in the Salmonella lineage.
Genome Biology
8
R100
57. IsambertH
SteinRR
2009
On the need for widespread horizontal gene transfers under genome size constraint.
Biol Direct
4
28
58. RochaEPC
2006
Inference and Analysis of the Relative Stability of Bacterial Chromosomes.
Mol Biol Evol
23
513
522
59. PalC
PappB
LercherMJ
2005
Adaptive evolution of bacterial metabolic networks by horizontal gene transfer.
Nat Genet
37
1372
1375
60. OchmanH
LiuR
RochaEP
2007
Erosion of interaction networks in reduced and degraded genomes.
J Exp Zoolog B Mol Dev Evol
308
97
103
61. WellnerA
LurieMN
GophnaU
2007
Complexity, connectivity, and duplicability as barriers to lateral gene transfer.
Genome Biol
8
R156
62. KeelingPJ
PalmerJD
2008
Horizontal gene transfer in eukaryotic evolution.
Nat Rev Genet
9
605
618
63. DerelleE
FerrazC
RombautsS
RouzeP
WordenAZ
2006
Genome analysis of the smallest free-living eukaryote Ostreococcus tauri unveils many unique features.
Proc Natl Acad Sci U S A
103
11647
11652
64. BowlerC
AllenAE
BadgerJH
GrimwoodJ
JabbariK
2008
The Phaeodactylum genome reveals the evolutionary history of diatom genomes.
Nature
456
239
244
65. AltschulSF
GishW
MillerW
MyersEW
LipmanDJ
1990
Basic local alignment search tool.
J Mol Biol
215
403
410
66. EnrightAJ
Van DongenS
OuzounisCA
2002
An efficient algorithm for large-scale detection of protein families.
Nucleic Acids Res
30
1575
1584
67. SiguierP
PerochonJ
LestradeL
MahillonJ
ChandlerM
2006
ISfinder: the reference centre for bacterial insertion sequences.
Nucleic Acids Res
34
D32
36
68. FoutsDE
2006
Phage_Finder: automated identification and classification of prophage regions in complete bacterial genome sequences.
Nucleic Acids Res
34
5839
5851
69. TreangenTJ
DarlingAE
AchazG
RaganMA
MesseguerX
2009
A novel heuristic for local multiple alignment of interspersed DNA repeats.
IEEE/ACM Trans Comput Biol BioInf
6
180
189
70. LiL
StoeckertCJJr
RoosDS
2003
OrthoMCL: identification of ortholog groups for eukaryotic genomes.
Genome Res
13
2178
2189
71. RochaEP
TouchonM
FeilEJ
2006
Similar compositional biases are caused by very different mutational effects.
Genome Res
16
1537
1547
72. AzadRK
LawrenceJG
2007
Detecting laterally transferred genes: use of entropic clustering methods and genome position.
Nucleic Acids Res
35
4629
4639
73. EdgarRC
2004
MUSCLE: multiple sequence alignment with high accuracy and high throughput.
Nucleic Acids Res
32
1792
1797
74. SchmidtHA
StrimmerK
VingronM
von HaeselerA
2002
TREE-PUZZLE: maximum likelihood phylogenetic analysis using quartets and parallel computing.
Bioinformatics
18
502
504
75. GascuelO
1997
BIONJ: an improved version of the NJ algorithm based on a simple model of sequence data.
Mol Biol Evol
14
685
695
76. YangZ
1997
PAML: a program package for phylogenetic analysis by maximum likelihood.
CABIOS
13
555
556
Štítky
Genetika Reprodukční medicínaČlánek vyšel v časopise
PLOS Genetics
2011 Číslo 1
Nejčtenější v tomto čísle
- H3K9me-Independent Gene Silencing in Fission Yeast Heterochromatin by Clr5 and Histone Deacetylases
- Evolutionary Conserved Regulation of HIF-1β by NF-κB
- Rnf12—A Jack of All Trades in X Inactivation?
- Joint Genetic Analysis of Gene Expression Data with Inferred Cellular Phenotypes