
Genome-Wide Association Study SNPs in the Human Genome Diversity Project Populations: Does Selection Affect Unlinked SNPs with Shared Trait Associations?
Genome-wide association studies (GWAS) have identified more than 2,000 trait-SNP associations, and the number continues to increase. GWAS have focused on traits with potential consequences for human fitness, including many immunological, metabolic, cardiovascular, and behavioral phenotypes. Given the polygenic nature of complex traits, selection may exert its influence on them by altering allele frequencies at many associated loci, a possibility which has yet to be explored empirically. Here we use 38 different measures of allele frequency variation and 8 iHS scores to characterize over 1,300 GWAS SNPs in 53 globally distributed human populations. We apply these same techniques to evaluate SNPs grouped by trait association. We find that groups of SNPs associated with pigmentation, blood pressure, infectious disease, and autoimmune disease traits exhibit unusual allele frequency patterns and elevated iHS scores in certain geographical locations. We also find that GWAS SNPs have generally elevated scores for measures of allele frequency variation and for iHS in Eurasia and East Asia. Overall, we believe that our results provide evidence for selection on several complex traits that has caused changes in allele frequencies and/or elevated iHS scores at a number of associated loci. Since GWAS SNPs collectively exhibit elevated allele frequency measures and iHS scores, selection on complex traits may be quite widespread. Our findings are most consistent with this selection being either positive or negative, although the relative contributions of the two are difficult to discern. Our results also suggest that trait-SNP associations identified in Eurasian samples may not be present in Africa, Oceania, and the Americas, possibly due to differences in linkage disequilibrium patterns. This observation suggests that non-Eurasian and non-East Asian sample populations should be included in future GWAS.
Published in the journal:
. PLoS Genet 7(1): e32767. doi:10.1371/journal.pgen.1001266
Category:
Research Article
doi:
https://doi.org/10.1371/journal.pgen.1001266
Summary
Genome-wide association studies (GWAS) have identified more than 2,000 trait-SNP associations, and the number continues to increase. GWAS have focused on traits with potential consequences for human fitness, including many immunological, metabolic, cardiovascular, and behavioral phenotypes. Given the polygenic nature of complex traits, selection may exert its influence on them by altering allele frequencies at many associated loci, a possibility which has yet to be explored empirically. Here we use 38 different measures of allele frequency variation and 8 iHS scores to characterize over 1,300 GWAS SNPs in 53 globally distributed human populations. We apply these same techniques to evaluate SNPs grouped by trait association. We find that groups of SNPs associated with pigmentation, blood pressure, infectious disease, and autoimmune disease traits exhibit unusual allele frequency patterns and elevated iHS scores in certain geographical locations. We also find that GWAS SNPs have generally elevated scores for measures of allele frequency variation and for iHS in Eurasia and East Asia. Overall, we believe that our results provide evidence for selection on several complex traits that has caused changes in allele frequencies and/or elevated iHS scores at a number of associated loci. Since GWAS SNPs collectively exhibit elevated allele frequency measures and iHS scores, selection on complex traits may be quite widespread. Our findings are most consistent with this selection being either positive or negative, although the relative contributions of the two are difficult to discern. Our results also suggest that trait-SNP associations identified in Eurasian samples may not be present in Africa, Oceania, and the Americas, possibly due to differences in linkage disequilibrium patterns. This observation suggests that non-Eurasian and non-East Asian sample populations should be included in future GWAS.
Introduction
Genome-wide association studies (GWAS) have become a popular method for identifying genomic loci that contribute to complex traits [1]. In GWAS, large sample sets of individuals (now on the order of several thousand), whose phenotype for some trait has been assessed, are genotyped for common SNPs. Algorithms are then used to identify SNPs that demonstrate allele frequency differences between cases and controls or between persons representing opposite ends of the phenotypic range (for continuous traits such as height) [1]. It remains controversial how often the alleles at these SNPs themselves have direct effects on the phenotype under study; it is likely that in many cases these SNPs instead act as markers linked to the causal genomic variants [2], [3]. Nonetheless, numerous individual SNPs have significant trait associations in more than one independent GWAS, confirming the association between these SNPs and particular human phenotypes [4], [5]. As it is increasingly common for complex traits to have been the focus of multiple independent GWAS, it is now possible to discern which SNPs are most likely to have true trait associations and which are likely false positives [5].
Most GWAS are conducted on subjects of European ancestry [6]. As GWAS have reduced power to detect trait associations for SNPs with low minor allele frequency (MAF), this means that most “GWAS SNPs” have a relatively high MAF in Europe [6]. Outside Europe, the allele frequencies of some GWAS SNPs vary considerably. Perhaps the most cited examples of this are the SNPs associated with pigmentation phenotypes, many of which exhibit extreme allele frequency differences between continental groups [7]. Other examples of individual GWAS SNPs with large allele frequency differences between particular pairs of continents have been found, including variants associated with Type 2 Diabetes and Crohn's disease [7], [8]. However, most individual GWAS SNPs have allele frequency patterns that are indistinguishable from those of random SNPs with no known trait associations [8], [9].
An understanding of the global allele frequency distributions of GWAS SNPs is important for two reasons. First, the frequency of a trait-associated allele determines to what degree it can contribute to variability in its phenotype in a given population. This is particularly true for SNPs that contribute directly to phenotypic variation rather than tagging causative variants [10]. Second, large allele frequency differences between populations for trait-associated SNPs may indicate that selection has acted upon the trait [8]. Past studies of the allele frequency patterns of GWAS SNPs have tended to be limited to particular human populations or pairs of populations [9], [11]. Such studies have also tended to focus on SNPs associated with phenotypes thought to be likely targets of selection (e.g. metabolic diseases like Type 2 Diabetes and resistance to infectious pathogens) [7], [8]. Additionally, these studies have examined the allele frequency patterns of individual GWAS SNPs rather than looking for commonalities in the behavior of groups of SNPs associated with a particular trait or identified in a single study [7], [9], [11]. Here we examine approximately 1,300 GWAS SNPs associated with a wide variety of phenotypes. We explore the allele frequency patterns of these SNPs in 53 globally distributed populations using 4 different statistics. These statistics are calculated for different population groupings in order to detect individual GWAS SNPs and groups of SNPs that exhibit unusual allele frequency patterns on a local and/or global level. While pigmentation SNPs do seem to exhibit the most extreme variations in allele frequency, we found that groups of SNPs associated with blood pressure, infectious disease, and autoimmune disease also differ from random groups of SNPs in their allele frequency distributions.
Results
Dataset
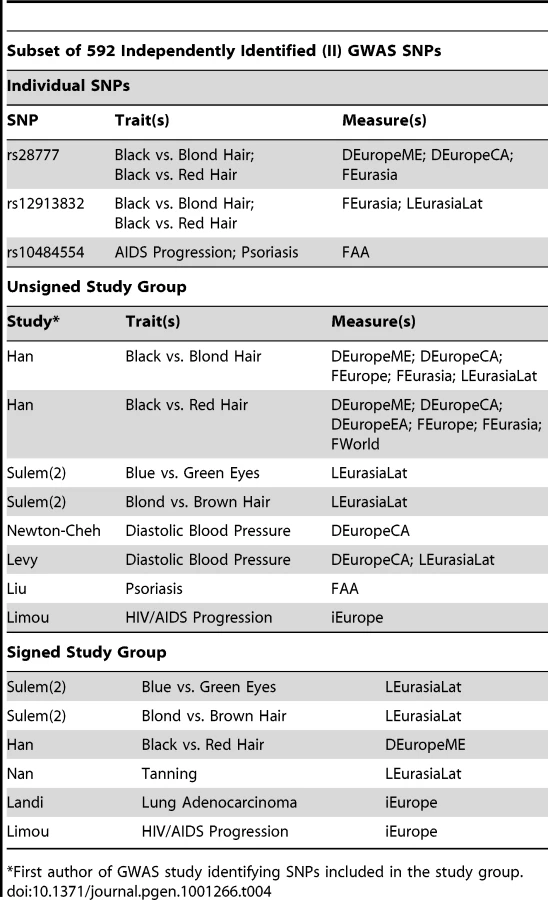
We analyzed trait-associated SNPs reported by published genome-wide association studies (GWAS) and cataloged online by the National Human Genome Research Institute (NHGRI) [5]. As of April 1, 2010, this database contained 2,284 SNPs (both autosomal and X-linked) that had reached genome-wide significance in at least one GWAS. These SNPs were associated with a total of 330 traits in 477 different studies (some SNPs have been identified in multiple studies and some have been associated with multiple traits). We investigated these SNPs in the dataset reported by Li et al. [12], which contains information on 640,698 autosomal SNPs genotyped in 938 individuals of the Centre D'Etude du Polymorphism Humaine-Human Genome Diversity Project (CEPH-HGDP) collection. These individuals are members of 53 globally distributed populations which can be divided into 8 continental groups [13], [14]. Of the 2,259 autosomal SNPs that we compiled from the NHGRI website, 1,336 are found in this dataset. The remainder of this paper will focus mainly on these 1,336 SNPs, 592 of which were identified in more than one GWAS (see Methods). The full set of 1,336 GWAS SNPs and this subset of 592 (which we will refer to as “independently identified SNPs”) are handled separately in the analyses below.
GWAS Traits with Unusual Allele Frequency Distributions and/or Elevated iHS Scores
Before beginning our primary analyses, we calculated the minor allele frequencies (MAFs) in Europe of all autosomal SNPs from the Li et al. [12] dataset (see Methods). GWAS studies have more power to detect trait-SNP associations for SNPs with high MAF [1], so GWAS SNPs are expected to have a higher average MAF in Europe than the remaining SNPs in our dataset (see Text S1, Figure S8, and Figure S9). This is indeed the case; we found that there were proportionally more GWAS SNPs in all high MAF bins (Figure 1A). GWAS SNPs are also expected to differ from the other SNPs in our dataset in terms of their linkage disequilibrium (LD) relationships with neighboring SNPs (see Text S1, Figure S8, and Figure S9). SNPs that are in high LD with their neighbors “tag” larger regions of the genome than do SNPs that are not in LD with surrounding variants. Because of this, the former are more likely to tag a region of the genome containing a causative variant for a particular GWAS trait. To quantify LD in our dataset, we calculated an “LD score” (see Methods) for all 640,698 autosomal SNPs. Again we found that GWAS SNPs differ from the remaining SNPs in the dataset in that proportionally more GWAS SNPs were found to be in high LD with neighboring SNPs (Figure 1B).

We used 3 statistics to characterize SNP allele frequency distributions across the 53 CEPH-HGDP populations: (i) delta values, which represent the difference in allele frequency between two continental groups or populations, (ii) group Fst values, which reflect the variation in allele frequency among populations in a group of populations, and (iii) correlations with longitude and latitude (we will refer to these as latitude/longitude correlation or “LLC” scores), which assess how closely changes in the allele frequency of a SNP follow geographical coordinates. We also used a fourth statistic, iHS [15] to characterize the lengths of the haplotypes surrounding each allele of a SNP. We chose to use iHS rather than other statistics that indicate genomic regions which may have been subject to past selection, because previous studies [8], [9] have found few GWAS SNPs with large allele frequency differences between populations (with the notable exception of pigmentation SNPs). This suggests that the selective sweeps affecting GWAS SNPs are likely to have been weak or incomplete (see Text S2). Such sweeps are more effectively detected by iHS than by other selection statistics [15]. We calculated each of these four statistics for the pairs and groups of populations listed in Table 1. For clarity, we will refer to a delta, Fst, LLC, or iHS value calculated for a particular population or populations as a “measure” or “score”.

We used these measures of allele frequency and haplotype length to compare GWAS SNPs to SNPs from the CEPH-HGDP dataset in three different ways. First, we assigned a p-value to each individual GWAS SNP by comparing its value for a particular allele frequency measure or iHS score to the values of other SNPs from our full set of 640,698 autosomal SNPs. These “other SNPs” were similar to each GWAS SNP in terms of MAF and LD score (see Methods for full details). For each delta, Fst, LLC, and iHS measurement, SNPs with sufficiently extreme p-values were deemed significant (see Table 2 for significance criteria and Table 3 and Table 4 for SNPs with significant p-values). We will refer to this first phase of the analysis as the “individual SNP analysis”. Next, we divided our 1,336 GWAS SNPs into groups based on the GWAS study that reported their trait association (some SNPs were in multiple groups if they were identified in more than one study). These “study groups” were then “pruned” by removing one SNP of any pair that were less than 1MB apart; the remaining SNP was the one with the smaller association p-value in the relevant GWAS. Our objective in carrying out this pruning process was to have in each study group one SNP (the one with the most significant trait association) representing each trait-associated genomic region. Groups with only one SNP remaining after this process were removed from consideration in the following analysis. For each delta, Fst, LLC, and iHS measure, each group was assigned a score based on the measure values of all SNPs in the group. As our group size ranged from n = 2 to n = 51 SNPs, we created an empirical distribution for each measure and each group size n (see Methods). We used these empirical distributions to assign to each group a p-value for each measure. Finally, we used the NHGRI website [5] to determine which allele was the risk allele for 1,041 of our GWAS SNPs (the risk allele for GWAS SNPs is not always identified). We were then able to assign a signed value for all of our delta, LLC, and iHS measures to these 1,041 SNPs (see Methods). SNPs were again grouped according to the study that identified them and we again created empirical distributions for each measure and each group size (see Methods). To distinguish between the two types of group analyses, we will refer to the first as the “unsigned group analysis” and to the latter as the “signed group analysis”.


In the individual SNP analysis, three SNPs were significant for one or more delta, Fst, LLC, or iHS measure. These three - rs28777, rs1834640, and rs12913832 – were all associated with pigmentation traits in GWAS (see Table 3 for a complete list of SNPs with significant p-values). A total of 8 groups reached significance for at least one measure in the unsigned group analysis while 10 reached significance in the signed group analysis. Included among these 10 were 3 pigmentation study groups that were significant in both analyses. We observed three other study groups that were significant in both analyses: an obesity study group [16] containing SNPs whose allele frequencies were significantly correlated with latitude in Eurasia, a hypertension study group [17] whose SNPs were associated with latitude in Africa, and a study group containing SNPs that are associated with the rate of AIDS progression [18] that produced high iHS scores in Europe. Other study groups were significant only in the unsigned or signed group analysis. SNPs in a psoriasis study group [19] produced high Fst scores in the African Agriculturists in the unsigned analysis, while a study group of SNPs associated with lung adenocarcinoma [20] and another containing SNPs associated with response to treatment for acute lymphoblastic leukemia (ALL) [21] were significant only in the signed analysis.
SNPs and study groups associated with pigmentation and immunological traits made up a majority of those that reached significance in our analysis. To test whether any of these general trait categories were enriched for SNPs producing large delta, Fst, LLC, or iHS scores, we divided the GWAS SNPs into 18 groups based on the trait with which they were associated. These 18 groups, which we will call “trait classes”, are listed in Table S1. For each of the 128 lists of p-values (there are a total of 45 delta, Fst, LLC, and iHS measures each in the individual SNP and unsigned group analyses and 38 total measures in the signed group analysis), we identified trait classes with a large number of SNPs or study groups with p-values less than or equal to 0.05 (see Methods for details and Figure S1 for full results). For the individual SNP analysis, there were a large number of delta, Fst, LLC, and iHS measures (12 and 9, respectively) for which pigmentation and autoimmune disease SNPs were over-represented in the top 5% of the empirical distribution. Pigmentation SNPs tended to produce low p-values for delta, Fst, and LLC measurements involving Eurasian and East Asian populations while autoimmune disease SNPs produced high iHS scores and correlated well with latitude on several continents. Pigmentation study groups had low p-values for many of the same delta, Fst, LLC, and iHS measures in the unsigned and signed group analyses. The measures for which autoimmune disease SNPs/study groups had low p-values varied somewhat across the phases of analysis, but in all phases they tended to produce high iHS scores.
Blood pressure SNPs and study groups were also over-represented in the top 5% of the empirical distribution for 10 measures in the individual SNP analysis and 8 measures in the unsigned group analysis. These measures included several Eurasian and East Asian delta, Fst, and iHS measures, but blood pressure SNPs also had high scores for measures assessing allele frequency correlation with latitude in Africa. Blood pressure study groups did not have particularly low p-values for any measures in the signed group analysis; this may have been due to the small number of blood pressure study groups considered in this particular phase of the analysis. Several other trait classes were notable in two of the three phases of analysis. In the individual analysis and the signed group analysis, the SNPs/study groups of the infectious diseases trait class had low p-values for iHS scores in the Middle East (iME), East Asia (iEA), and Oceania (iOceania) and for measures of allele frequency correlation with latitude in East Asia (LEALat and LEurasiaEALat). Additionally, the metabolic trait class (which includes weight and Type 2 Diabetes study groups) produced low p-values for a number of measures in both the unsigned and signed group analysis, although the measures varied between analyses.
We repeated all our above analyses focusing only on the 592 GWAS SNPs that were reported in more than one study (see Methods for details). We will call these 592 SNPs “independently identified” or II SNPs. The results were quite similar to those for the full set of 1,336 GWAS SNPs with a few exceptions (Table 4). A number of study groups included in our initial analysis were not considered here because they contained fewer than two II SNPs. Included among these was the hypertension study group [17] whose SNPs significantly correlated with latitude in Africa (LAfricaLatDE). However, we found that two other blood pressure study groups containing SNPs associated with diastolic blood pressure (DBP) [17], [22] were significant for at least one measure in our II unsigned group analysis. Both of these DBP study groups were significant for allele frequency difference between Europe and Central Asia (DEuropeCA) and one was significant for allele frequency correlation with latitude in Eurasia (LEurasiaLat). Again for each delta, Fst, LLC, and iHS measure, we looked for trait classes containing a large number of SNPs or study groups with p-values ≤0.05. Although the number of study groups in some trait classes was quite small for the II analyses, the results were still similar to those from our analysis of all GWAS SNPs. The pigmentation and blood pressure trait classes again produced low p-values for more delta, Fst, LLC, and iHS measures than did the other trait classes in the individual SNP and unsigned group analyses. In one departure from previous observations, blood pressure study groups also produced low p-values for a number of measures in the signed group analysis. Additionally, we noted that in the II unsigned group analysis, study groups of the hematological trait class produced low p-values for a number of iHS and LLC measures in Eurasia and East Asia. Overall, our analyses indicate that SNPs associated with pigmentation, blood pressure, and autoimmune disease have unusual allele frequency distributions (or elevated iHS scores) relative to random SNPs; to a lesser degree, this is also true for SNPs associated with infectious disease, metabolic, and hematological traits.
Comparing across Delta, Fst, LLC, and iHS Measures
There was considerable variability across p-value distributions for different delta, Fst, LLC, and iHS measures. In particular, GWAS SNPs generally seem to produce smaller p-values for measures involving Eurasian and East Asian populations (Figure 2, Figure S2, and Figure S3). This holds across all 6 p-value sets (one set for the individual SNP, unsigned group, and signed group analyses for both the full set of 1,336 GWAS SNPs and the subset of 592 II GWAS SNPs) although there are some exceptions. Most notably, the proportion of GWAS SNPs/study groups with p-values ≤0.05 for Fst among American populations (FAmerica) and for the correlation of allele frequencies with latitude (LAmericaLat), distance from the equator (LAmericaLatDE), and longitude (LAmericaLong) in America is quite high for some sets of p-values. As pigmentation SNPs often have low p-values for Eurasian and East Asian delta, Fst, LLC, and iHS measures, we re-evaluated all p-value sets after removing pigmentation SNPs and study groups from consideration. The proportion of SNPs/study groups with p-values ≤0.05 was somewhat diminished for certain Eurasian measures, especially delta values comparing Eurasian and East Asian populations. However, non-pigmentation SNPs and study groups still tended to produce smaller p-values for Eurasian and East Asian delta, Fst, LLC, and iHS measures relative to other measures.

Sample Ethnicity
Although GWAS once focused almost exclusively on individuals of European ancestry, studies are now being conducted on cases and controls from other human populations. We reviewed all 477 GWAS studies and found that 375 used only European subjects (see Methods), 24 used only East Asian subjects, 2 used only Oceanic subjects, one used only African subjects, and one used only Native American subjects. The remaining studies used either subjects from multiple continents or used human populations that were the product of recent admixture (for example, Hispanic-American individuals). We compiled a list of all GWAS SNPs and study groups from studies using only European subjects (we will call these “European GWAS SNPs/study groups”) and a list of all GWAS SNPs and study groups from studies using only East Asian subjects (we will call these “East Asian GWAS SNPs/study groups”). We used these to determine whether there were any measures with a large number of East Asian GWAS SNPs/study groups with p-values in the top 5% of the empirical distribution (see Methods and Figure S4 for complete results). We found that this was true for East Asian GWAS study groups for American LLC measures in the group analyses. We also compared the p-values of European and East Asian GWAS SNPs/study groups for each for delta, Fst, LLC, and iHS measure using an unpaired Wilcoxon test (see Methods and Figure S5). East Asian GWAS SNPs/study groups produced lower p-values (significant at the 0.05 level) for all three American LLC measures. East Asian GWAS SNPs and study groups also tended to produce lower p-values than European GWAS SNPs/study groups for FAmerica as well as for the delta measure comparing allele frequencies between the Biaka and Mbuti Pygmies (DPygmy). European GWAS SNPs and study groups produced lower p-values than East Asian GWAS SNPs/study groups for the two measures of allele frequency correlation with latitude across all 53 CEPH-HGDP populations (LWorldLat and LWorldLatDE).
Finally, we examined individual studies that used European and East Asian samples to determine the relationship between the SNPs associated with a particular trait in studies using individuals from different continents. Are the SNPs associated with Trait X in a European study the same as those identified in an East Asian study? Among the GWAS that used East Asian subjects, we identified four that focused on height [23]–[26], four that focused on Type 2 Diabetes (T2D) [27]–[30], and two that focused on Systemic Lupus Erythematosus (SLE), commonly called Lupus [31], [32]. We listed all SNPs associated with height in any study on the NHGRI website [5] (regardless of the ethnicity of the study subjects). We then identified genomic regions containing a “hit” in more than one GWAS (see Methods). There were 26 such regions, two of which were associated with height only in GWAS that used exclusively East Asian samples. We then calculated minor allele frequencies for the SNPs contained within these regions and found that although the MAFs of these SNPs were fairly high in East Asia (16%–27%), they all fell to less than 5% in Europe, except in one case. We made a similar observation for T2D and SLE. In both of these cases, we found only one region that was associated with T2D and SLE, respectively, in GWAS using only East Asian samples. For T2D, this region, on the short arm of chromosome 11, contained SNPs with a MAF range of 3.8% to 5.1% in Europe. The SLE region, on the long arm of chromosome 11, also contained SNPs whose MAFs were smaller in Europe than in East Asia, although in this case the European MAFs were all about 11%. Conversely, we find that genomic regions associated with height, T2D, and SLE by GWAS using only European subjects often contain SNPs with relatively high MAFs in East Asia (see Figure S6).
Chromosome X
Of the 2,284 SNPs reported by the NHGRI website to be trait associated, 26 were located on the X chromosome. 21 of these, associated with traits like height, prostate cancer, LDL cholesterol, and Type 1 Diabetes (T1D), were also found in the CEPH-HGDP dataset. We calculated our delta, Fst, LLC, and iHS measures for these SNPs and used the 16,297 X-linked SNPs from Li et al. [12] to construct an empirical distribution for each measure (see Methods and Figure S7 for details pertaining to MAFs and LD scores for X-linked SNPs). The Bonferroni-corrected p-value cut-off for significance at the 0.05 level was 2.38×10⁻³ (since there were 21 X-linked SNPs). Table 5 lists all X-linked SNPs that were significant for at least one of our measures. Two out of the 21 X-linked GWAS SNPs were associated with HIV/AIDS Progression by Fellay et al. [33]. As these two SNPs are separated by 45MB on the long arm of the X chromosome they are unlikely to be in linkage disequilibrium with one another. However, both SNPs, rs17324272 and rs12012519, were significant for the measure assessing allele frequency correlation with longitude in Eurasia and East Asia (LEurasiaEALong). rs17324272 was also significant for LEALong and for iHS in East Asia (iEA). Overall, these two SNPs have p-values less than 0.05 for many delta measures comparing allele frequencies between the continents of Eurasia and East Asia as well as many measures of allele frequency correlation with longitude in Eurasia and East Asia. An X-linked height SNP, rs1474563 [34], was also significantly correlated with latitude in Europe (LEuropeLat). Paralleling our autosomal results, this SNP was also the X-linked GWAS SNP with the largest allele frequency difference between the two Pygmy groups; previously, we noted that a height SNP produced the largest value for DPygmy out of all 1,336 autosomal GWAS SNPs in the CEPH-HGDP dataset. Of all the trait-associated X-linked SNPs, rs1474563 also had the largest allele frequency difference between the Eurasian continents and East Asia and the highest Fst scores among the African Hunter-Gatherers, African Agriculturists, Europeans, and Eurasians.

Discussion
The possible import of polygenic adaptation in humans, where selection acts on a trait by affecting allele frequencies at many associated polymorphisms, has been widely touted in recent literature [35], [36]. Empirical studies have found only a few examples of variants that have undergone “hard sweeps”, where a favored allele arises by mutation and increases to high frequency in a population [35], [36]. Instead, it is now thought that adaptation to new phenotypic optima may proceed through small allele frequency changes at many polymorphic loci [35]–[37]. It is important to note, however, that selection on traits need not be limited to positive selection. Selection acts on traits not only to achieve new phenotypic optima, but also to maintain those optima once they have been reached, perhaps through balancing or negative selection [38], [39]. Here we used 45 different measures of allele frequency variation and haplotype length to scan for selection on traits examined by GWAS. We identified a total of 13 study groups that were significant for at least one measure in at least one phase of the analysis. Although other explanations are certainly possible (see Text S3), we believe that there is solid evidence that these study groups represent instances of a polygenic response to selective pressure on an associated trait. We give an overview of the traits we found to be particularly notable below.
Pigmentation
The NHGRI Catalog [5] includes studies on a total of 14 pigmentation traits; we identified 6 of these as having associated SNPs or study groups that were significant for at least one delta, Fst, LLC, or iHS measure. We listed all SNPs identified as being associated with at least one of the 14 pigmentation phenotypes and found that the majority of these SNPs fell into one of 7 genomic clusters, each of which is associated with a known pigmentation gene – SLC45A2, IRF4, TYR, SLC24A4, HERC2, MC1R, and ASIP. (As the focus of our work is specifically on GWAS and the SNPs they have identified, only pigmentation genes associated with GWAS hits are included in our discussion here.) Numerous previous studies have found evidence for selection at loci associated with pigmentation [15], [40]–[50]. The majority of this evidence has been found in European populations, but there have also been reports of selection at pigmentation loci in East Asian and African populations [41], [45], [47]–[50]. In our work, we noted that pigmentation SNPs and study groups produced low p-values (p-values ≤0.05) for three types of measures: delta values comparing different Eurasian populations, Eurasian Fst measures (FEurope and FEurasia), and LLC measures assessing allele frequency correlation with latitude in Eurasia. There were almost no cases where a pigmentation SNP or study group had a p-value less than or equal to 0.05 for a measure not involving Eurasians. Variation in pigmentation phenotypes is certainly not limited to Eurasians nor is there any reason to believe that selection on loci associated with pigmentation would be limited to Eurasia. However, our results indicate that SNPs associated with pigmentation in GWAS display unusual allele frequency patterns almost exclusively in Europe, the Middle East, and Central Asia. This suggests to us that there may be SNPs, perhaps in or near genes other than SLC45A2, IRF4, TYR, SLC24A4, HERC2, MC1R, and ASIP, which are associated with pigmentation in non-Eurasian populations, but which have yet to be identified by GWAS. GWAS for pigmentation traits carried out using non-European subjects are needed to explore this possibility further.
Blood Pressure
Allele frequencies for functional variants in 5 genes associated with blood pressure – AGT, GNB3, ADRB2, SCNN1α, and SCNN1γ – have previously been shown to be correlated with latitude; specifically, alleles conferring higher blood pressure seem to decrease in frequency with distance from the equator [51], [52]. This pattern may be due to selection favoring lower blood pressures in cooler climates following the out of Africa migration [51], [52]. Although none of the blood pressure SNPs included in our study are close enough to any of these five genes to be in linkage disequilibrium with them, we observed that two blood pressure study groups were significant for measures assessing allele frequency correlation with latitude – a hypertension study group [17] containing SNPs whose allele frequencies correlated with distance from the equator in Africa (LAfricaLatDE) in both the unsigned and signed analyses, and a diastolic blood pressure study group [17] that contained SNPs whose allele frequencies correlated with latitude in Eurasia (LEurasiaLat) in the unsigned analysis. We reviewed the results of the unsigned analysis and found that 4 out of 5 total blood pressure study groups had p-values less than 0.05 for LEurasiaLat and 3 out of 5 had p-values less than 0.05 for LWorldLat. We then reviewed all II blood pressure SNPs individually and found that 7 out of 8 of them had p-values less than 0.1 for LEurasiaLat. However, in Eurasia the frequency of the allele associated with higher blood pressure is not always negatively associated with latitude. One of the blood pressure SNPs whose risk allele for higher blood pressure is positively correlated with latitude in Eurasia is rs3184504, a non-synonymous SNP in SH2B3. The rs3184504 T allele, which is associated with increased blood pressure, was recently shown to cause increased cytokine production [53] and is believed to have experienced positive selection in Europe in response to an infectious disease [22], [53]. Of the 8 risk alleles for II blood pressure SNPs, this is the only allele that is strongly positively correlated with latitude across all 53 HGDP populations. Most of the remaining risk alleles are negatively correlated with latitude when all 53 HGDP populations are considered, much like the risk alleles in AGT, GNB3, ADRB2, SCNN1α, and SCNN1γ [51]. rs3184504 was also the only II blood pressure SNP where there was strong selection in Eurasia in favor of the risk allele as measured by iHS. Overall, we observed that allele frequencies at blood pressure SNPs are often highly correlated with latitude, especially in Eurasia, although the risk allele for higher blood pressure is not always negatively associated with latitude. This may be due to the pleiotropic effects of blood pressure SNPs on other traits, as could be the case with rs3184504.
Variants Associated with Infectious Disease Resistance and Autoimmune Disease
Polymorphisms with effects on the immune system are thought to be under selection in many organisms including primates [54]. In human-specific genome-wide scans for selection, more than 300 immunological genes have been “hits” and when only those genes involved in recent sweeps are considered, immunity genes are over-represented relative to genes with other functions [55]. Many focused studies of individual or groups of immunological genes have also found patterns of genetic variation consistent with the effects of selection [56]–[75]. Included among these studies are many investigations of loci associated malaria resistance [60]–[65]. Some of these studies focus on genes like G6PD [61], HBB [64], and DARC [62], [63], which are associated with protection from malaria but may not be typically thought of as immunological genes. In much the same way, genes generally associated with immune function and those associated with autoimmune and infectious diseases by GWAS are not necessarily the same thing. 384 immunity-related genes have either been hits of genome-wide selection scans or have been identified as under selection since the human-chimpanzee split [55]. Of the 258 autoimmune and infectious disease SNPs that we considered here, only 16 were in any of these genes and only a further 88 were within 1 MB of any of them. Despite this, we identified one infectious disease trait and one autoimmune disease trait whose associated variants consistently produced elevated measure scores. We also observed that infectious and autoimmune disease SNPs had generally elevated scores for many different measures (Figure S1). This suggests either that selection on autoimmune and infectious disease traits may commonly influence genomic loci not typically associated with immunity or that there may be selection acting on immunity-related loci that has not been detected by previously applied methods.
Although HIV has caused significant mortality in humans for less than 50 years, alleles at some variants associated with resistance to HIV infection and delayed disease progression, most famously the CCR5-Δ32 deletion, are thought to have experienced selection in the past due to their protective role against other infectious diseases [66], [67], [76]. We found a study group containing SNPs associated with HIV/AIDS progression [18] that was significant for iHS in Europe in both unsigned and both signed analyses. This is not particularly surprising as both SNPs in this study group are located close to the HLA region on chromosome 6, which is thought to be strongly affected by selection in many populations including Europeans [57]–[59]. More notable perhaps are our results for two X-linked SNPs associated with HIV/AIDS progression by Fellay et al. [33]. Although separated by more than 40MB on the long arm of the X chromosome, the allele frequencies of both variants were found to be significantly correlated with longitude in Eurasia and East Asia (LEurasiaEALong), while rs17324272 was also found to be significant for LEALong and for iHS in East Asia (Figure 3). Another X-linked variant, rs5968255, which is located nearly 4MB from rs17324272, was not included in our original analyses, but was found to be associated with HIV viral load in another study by the same authors [77]; we calculated its p-value for LEurasiaEALong to be 6.136×10⁻⁵, far below the significance cutoff for our X chromosome analysis. All three X-linked SNPs had low p-values for many of the measures assessing correlation of allele frequencies with longitude in Eurasia and East Asia, for iHS in East Asia, and for delta measures comparing Eurasian, American, and Oceanic populations with East Asian populations. The study group containing the autosomal SNPs identified by Fellay et al. [33] was found to have low p-values for many of the same measures in the unsigned group analysis. These measures include iHS in East Asia, for which the Fellay et al. [33] study group had the lowest p-value out of all 270 groups, 8.65×10⁻⁴, even though only one out of the 19 SNPs in this study group is located in the HLA region (Figure 3). This evidence suggests that variants associated with HIV viral load and progression may be collectively under selection across the Eurasian continent, particularly in East Asian populations.

As with the variants associated with characteristics of HIV infection, SNPs associated with autoimmune diseases may have experienced selection due to their interactions with infectious pathogens. The hygiene hypothesis postulates that the same alleles that bolster the immune system in the presence of infection may lead to autoimmune disease in its absence [78]. This hypothesis is supported by the findings that risk alleles at autoimmune disease variants are sometimes protective against infectious disease [79] and that the frequencies of some of these risk alleles are positively correlated with pathogen diversity [78]. We found evidence among our results to support the idea that some risk alleles for autoimmune disease have experienced positive selection in the past. In particular, many of the SNPs associated with psoriasis in four different GWAS studies produced high iHS scores for all continents except Oceania and America; the longer haplotypes centered at these loci were almost always associated with the psoriasis risk allele (Figure 4). As a result of this, at least one (and often both) of the two psoriasis study groups [80], [81] included in the signed group analysis of all 1,336 GWAS SNPs had a p-value ≤0.05 for iBantu, iME, iEurope, iCA, and iEA. While psoriasis has been associated with loci in the HLA region, neither of these two study groups included an HLA SNP. iHS scores for a psoriasis-associated HLA SNP from a third study [19] indicated that selection on this locus also tends to favor the psoriasis risk allele in Africa, Eurasia, and East Asia (Figure 4). In addition, we observed that one psoriasis study group [19] was significant for Fst among African Agriculturists in both unsigned group analyses; this indicates that the force which led to the elevated iHS scores for psoriasis SNPs in the Bantu may have caused large differences in allele frequencies at the same SNPs between the Bantu, Mandenka, and Yoruba.

Of the 16 autoimmune diseases that have been examined by GWAS, psoriasis produced the highest iHS values for the highest number of continental regions. At least one psoriasis study group had a p-value ≤0.05 for iBantu, iME, iEurope, iCA, and iEA in the signed group analysis of all 1,336 GWAS SNPs. In each case, the longer haplotypes around the SNPs in these study groups were associated with the risk allele. We reviewed the signed group analysis of all 1,336 GWAS SNPs for other autoimmune disease study groups and found ten other instances where such a study group had a p-value ≤0.05 for an iHS score. In all 10 cases, the group iHS value indicated that longer haplotypes were associated with the risk allele for the disease. We also reviewed the iHS scores produced by individual SNPs associated with autoimmune disease. For each continent, we found that a considerable proportion of these SNPs produce high iHS scores (Figure 5A). In the majority of these cases, the risk allele is associated with a longer haplotype than the protective allele (Figure 5B). Overall, our findings suggest there could be a general trend which extends across continents for selection at autoimmune disease GWAS SNPs in favor of risk alleles.

Sample Ethnicity
In addition to identifying traits that were consistently associated with low p-values, we also noticed that GWAS SNPs/study groups tend to have higher empirical p-values for measures involving Africa, Oceania, and the Americas. This trend is particularly notable for iHS score (Figure 2 and Figure S3). For all analyses, with or without pigmentation SNPs, a smaller percent of GWAS SNPs and study groups have p-values ≤0.05 for iBantu than for any other iHS score. More GWAS SNPs and study groups have p-values ≤0.05 for iOceania and iAmerica than for iBantu, but these percentages are still consistently less than observed for iME, iEurope, iCA, and iEA. Assuming that direct or indirect association with a trait does indeed increase the probability that a SNP will be influenced by selection, we would expect that more than 5% of GWAS SNPs/study groups would fall into the top 5% of the empirical distribution for an iHS score. LD patterns vary between human populations, so that a SNP linked to a causative variant in Europe may not be linked to that causative variant elsewhere, especially in Africa where LD patterns vary widely within the continent as well as differing from those of non-African populations. The majority of GWAS SNPs were identified as being trait-associated in European subjects; in African and to a lesser extent in Oceanic and American populations, GWAS SNPs may be unlinked to causative variants, which might lower the probability that they would be affected by selection. If this is the true explanation for our observations, then SNPs identified by GWAS using Eurasian subjects and by those using non-Eurasian subjects may not be the same. Given the limited number of GWAS studies with non-European subjects, we were only able to test this hypothesis directly by comparing European and East Asian GWAS studies. We found that at least for height, T2D, and SLE, GWAS studies done in Europe and in East Asia tend to identify the same genomic regions. However, as roughly similar numbers of GWAS SNPs/study groups have p-values ≤0.05 for iEurope and iEA, this is not surprising. Further GWAS studies in non-European populations are needed to ascertain if trait-SNP associations are generally universal or if they instead vary considerably from one human population to the next.
The Influence of Selection and the Genetic Architecture of GWAS Traits on the Results
Despite our broad-based approach, we found only a few examples of what may be a polygenic response to a single selective pressure. We did use stringent significance criteria which might mean that additional examples can be found among the study groups that did not quite meet our threshold of significance. It may also be that there is something about “GWAS” traits and their underlying genetics that served to undermine our approach.
First, it is likely that the common SNP variants that we have studied here do not themselves contribute to phenotypic variation. Rather, it is usually assumed that these genotyped variants are in high LD with common causative variants [3]. If this were generally the case, we would expect our approach to still be sound, although as the LD decreases between the two common variants the population structure of the causal variant might not be fully transmitted to the genotyped variant. However, there has been much speculation lately about the importance of rare variants in human phenotypic variation [2], [3], [82]. Goldstein and colleges [2], [3] have demonstrated that causative rare variants tend to be associated with one allele of nearby common variants, creating the appearance that these common alleles themselves are associated with a trait. The authors call these “synthetic associations”. Specifically, they think that common variants may be linked to small clusters of rare causal variants [2], [3]. If this is the case, it seems unlikely that the population structure of a cluster of rare variants could be fully characterized by a single linked common variant. That is, it is quite possible for any or all the rare variants in such a cluster to have a high Fst score or clinal pattern which is not reflected in the common variant. iHS might be an exception to this. Rare copy number variants may also play an important role in human phenotypic variation [83]; we would expect them to affect our analysis in much the same way that rare SNPs would.
Second, even if common variants alone, whether they are the genotyped variants themselves or in LD with genotyped variants, are responsible for variation in GWAS traits, our approach may be undermined by other features of the genetic architecture of these traits. Specifically, epistasis may be widespread among polymorphic sites in the human genome and can be difficult to detect, particularly as the number of putatively interacting loci considered increases. Epistasis has been frequently found to exist between loci in model organisms like flies and mice [84], [85]. Additionally, its effects can be larger than and in the opposite direction as the individual effects of the interacting loci [84]. It may also be quite possible that many, even most, GWAS SNPs are associated with more than one trait. Like epistasis, pleiotropy has been found to be common for variants influencing complex traits in model organisms [84], [85] and we found multiple instances of it in the dataset that we studied here. The presence of epistasis and pleiotropy can mean that the response of a variant to selection is dependent on the genetic background and the existence and strength of selection on other traits, complexities we did not account for in our analysis.
Lastly, the type of selection acting on GWAS traits may not be well detected by our methods. Some of these traits may simply be limited in their fitness effects, with little or no selection acting on them. Alternatively, GWAS traits may be influenced primarily by balancing or negative selection. If this selection is fairly uniform across environments, our measures would likely not detect it (see Text S2). Also, if negative or balancing selection is particularly widespread in the human genome, any variant experiencing this selection would likely not have reached our stringent significance cutoff given the large number of other variants that would have attained similar measure values. Recent work has proposed negative selection as one explanation for what appear to be common non-neutral patterns of variation in the human genome, such as the elevation of Fst values in genes and the reduction of diversity at sites linked to coding and regulatory regions [35], [86]–[88].
Overall, our analyses may have been limited by two factors that are not yet well understood: the type and strength of the selection acting on GWAS SNPs and the underlying genetic architecture of GWAS traits. Theory predicts that these two factors are, in fact, interrelated as the nature of the selection on a trait can shape the allele frequency spectrum of causative variants [38], [39]. Conversely, it has been proposed that an understanding of allele frequencies of causative variants may be the best way to empirically discern the nature of the selection acting on a trait [38], [39]. Are there any clues in our results as to the nature of selection on GWAS SNPs or to the architecture of GWAS traits? More than 5% of all GWAS SNPs commonly produced p-values of 0.05 or less for measures involving Eurasian populations. We feel that this indicates a general pattern of (possibly weak) selection at GWAS SNPs and/or linked variants in Eurasia. Included among the measures that were generally elevated for GWAS SNPs were delta and Fst scores. This suggests a role for positive selection in shaping patterns of variation surrounding GWAS SNPs, as it is probably the selective force most likely to cause notable allele frequency differences between populations. Our observation that iHS scores were generally elevated for GWAS SNPs is consistent with the effects of positive selection as well. However, SNPs under negative selection may also produce elevated iHS scores. Furthermore, a GWAS trait under negative selection would tend to have rare causative variants [38], [39]. This would lead to the sequestration of some causative variants in a limited number of populations and would explain why p-values for GWAS SNPs are higher for measures involving African, American, and Oceanic population when most GWAS are conducted using European subjects. Thus, our results suggest that both negative and positive selection may influence variation at GWAS SNPs. Their relative contributions, however, remain unclear. How do the significant traits (pigmentation, blood pressure, autoimmune disease, and infectious disease resistance) differ from the other traits we studied? Are they examples of positive selection driving polygenic adaptation? If so, are they the only examples among the traits we studied? Or are the genetic architectures of these traits somehow simpler than other traits, perhaps because they are less polygenic (as has been proposed previously for pigmentation [35])? The definitive answers to these questions ultimately lie in the identification of the causative variants underlying GWAS traits.
In summary, we have examined 1,336 trait-associated SNPs in the 53 CEPH-HGDP populations looking for individual SNPs and groups of SNPs with unusual allele frequency patterns and elevated iHS scores. We identified 13 different traits with an associated SNP or study group that produced a significantly elevated score for at least one delta, Fst, LLC, or iHS measure, a small percentage of the total number of traits analyzed. We believe that the limited number of positive results could be due to our stringent significance criteria or to features of the genetic architecture of the traits themselves. Specifically, the roles of rare variants, epistasis, and pleiotropy in human complex traits are, although areas of active inquiry, still generally not well understood. Our measures may also not be optimal for detecting all types of selection acting on GWAS traits. It has been speculated that variants underlying complex traits will be influenced primarily by negative or balancing selection, which may not produce extreme values for our measures, particularly if these forces are relatively uniform across populations or are acting on many regions in the genome.
The SNPs and study groups that were significant were almost all clustered within four trait classes – pigmentation, blood pressure, infectious disease, and autoimmune disease. Our results suggest that the traits encompassed by these trait classes are likely examples of phenotypes that have undergone evolution by polygenic adaptation. The pattern of elevated measures was unique for each of these four trait classes, which would seem to indicate that a different selective force is driving allele frequency changes at SNPs within each class. However, we cannot rule out the possibility that some of the SNPs in these trait classes are associated with multiple traits and thereby experience multiple selective pressures. It also remains unclear whether the type and the strength of the selection acting on a phenotype or the underlying genetic architecture of a trait was the important factor in distinguishing significant traits from those that were not significant in our analysis.
We also found that both SNPs and study groups tend to have lower p-values for Eurasia and East Asian measures. We theorize that this may be due to global variation in linkage disequilibrium patterns, causing SNPs associated with a trait in one population to be unassociated with that trait in another population. If this is the correct interpretation of our results, it has important implications for the future of GWAS as it suggests that the SNPs identified by two GWAS using samples from two different continents may be quite different. As almost no GWAS studies have been done using samples from Africa, Oceania, or the Americas, the three continents where we observed a deficit of low p-values, it is impossible at present to test this hypothesis directly. We believe that extending GWAS analyses to include individuals from these regions is an important next step in this area of research. Such studies will elucidate whether SNP-trait associations are generally universal and if not, have the potential to associate new loci with traits previously studied in other human populations.
Methods
Independently Identified (II) SNPs
We listed all SNPs identified by NHGRI's online catalog of genome-wide association studies [5] in the order of their chromosomal positions (this included GWAS SNPs not included in the CEPH-HGDP dataset). A SNP was designated as II if there was another SNP located within 1MB that was associated with the same trait (or with a similar trait within the same trait class) in at least one other GWAS. For instance, we counted a Crohn's disease SNP as II if there was an ulcerative colitis SNP within 1MB, and a hypertension SNP as II if there was a systolic blood pressure SNP within 1MB. SNPs that were associated with the same trait or with a similar trait by more than one study were also considered II. Through this process, we hoped to identify GWAS SNPs that were likely to have genuine trait associations by excluding SNPs in genomic regions identified by only one study. This method is, however, biased against SNPs associated with traits that have been investigated by a limited number of GWAS. For this reason, we conducted our analyses using both the full set of 1,336 GWAS SNPs and the subset of 592 II GWAS SNPs.
Calculation of European MAF
The minor allele frequency (MAF) in Europe was calculated for each SNP in the Li et al. [12] dataset. We then divided these SNPs into 11 groups based on MAF, including one group which contained all SNPs with an MAF of 0 in Europe.
Calculation of “LD Score”
For each of our 640,698 autosomal SNPs and 16,297 X-linked SNPs, we obtained the value of R2 between it and any hapmap SNP within 200KB in CEU individuals from the HapMap website [89]. We then calculated for each SNP the percentage of those R2 values exceeding 0.8. We used the value of this percentage, which we will refer to as our “LD score”, to divide both our autosomal and X-linked SNPs into 9 different LD score bins of approximately the same size. One of these bins (referred to as “NA” in Figure 1) contains all SNPs that are fixed in Europe.
Standardized Scores and Empirical Distributions for the Individual and Unsigned Group Analyses
We divided the 640,698 SNPs from the Li et al. [12] dataset into 99 bins (9 groups based on LD score and 11 groups based on MAF). For each SNP and each measure, we calculated a standardized score equal to the difference between the SNP's value for that measure and the bin average for that measure (as each GWAS SNP is assigned to a bin based on its MAF and LD score) divided by the standard deviation of the measure values in that bin. The SNP was then assigned an empirical p-value for that measure by comparing its standardized score to the standardized score of all other 640,698 autosomal SNPs for that measure. This is the p-value used in the individual SNP analysis. We used this same procedure to carry out our analysis of the X chromosome using our 16,297 X-linked SNPs. For the unsigned group analysis, we created an empirical distribution for each group size n and each measure by randomly drawing n values from the list of standardized scores for that measure 1,000,000 times and then taking the average standardized score for the n values. The p-value for each study group and each measure was assigned by comparing the average standardized score for the study group to the corresponding list of 1,000,000 averages.
Standardized Scores and Empirical Distributions for the Signed Group Analyses
For our signed group analyses, we determined the risk allele for as many of the CEPH-HGDP GWAS SNPs as possible. We then calculated values for these SNPs for the 38 delta, LLC, and iHS measures with respect to the risk allele as follows. Delta values were positive if the risk allele frequency was higher in the second population than in the first. Latitude/Longitude correlation values were positive if there was a positive correlation between latitude or longitude and the frequency of the risk allele. iHS values were positive if selection on the SNP favored the risk allele. Some GWAS traits are physiological rather than pathological, with alleles at associated SNPs favoring one side of the physiological spectrum. For such traits, we picked one end of this physiological spectrum to represent the “disease” end and denoted alleles favoring this end as risk alleles. We used this assignment for all studies of that trait. For instance, there are many GWAS studies that examine height. We deemed all alleles favoring taller stature to be risk alleles and used this system for all height GWAS.
To calculate p-values for this part of the analysis, we recalculated the standardized score for each SNP and each measure. In the individual and unsigned group analysis, we used only the absolute values of the delta, Fst, LLC, and iHS measures in our calculation of standardized scores and in our construction of the empirical distributions. That is, each SNP had only one corresponding value and one standardized score for each measure. In this phase of the analysis, for each SNP and each measure, we included both the value of the measure and its additive inverse in our calculations of standardized scores. For each measure and each study group size n, we created the empirical distributions in the same way as for the unsigned group analysis, except that we drew from a list of 1,281,396 standardized scores (since each of the 640,698 SNPs in our dataset “contributed” two standardized scores instead of one).
Overrepresentation of a Trait Class in the Top 5% Tail of the Empirical Distribution
For each phase of our analysis of autosomal CEPH-HGDP GWAS SNPs, we divided all GWAS SNPs or study groups into 18 trait classes (see Table S1). We then determined whether any of these 18 trait classes were over-represented in the top 5% of the empirical distribution, given the number of SNPs or study groups in the trait class. To explain how we did this, we will use a specific example. In the individual SNP analysis for all 1,336 GWAS SNPs, the autoimmune disease trait class contained 216 SNPs. For DPygmy, there are 1,336 total p-values, one corresponding to each CEPH-HGDP GWAS SNP. We randomly drew 216 p-values from our list of 1,336 p-values 10,000 times, each time counting the number of p-values that were ≤0.05. From this list of 10,000 values, we determined that only 5% of the time did a random draw of 216 values contain 13 or more values that were ≤0.05. If there had been more than 13 autoimmune disease SNPs that had a p-value ≤0.05 for DPygmy, we would have said that autoimmune disease SNPs were over-represented in the 5% tail of the empirical distribution of DPygmy p-values (there were only 11 in this case). We repeated this procedure for all trait classes and all delta, Fst, LLC, and iHS measures for the individual SNP analysis with the full set of 1,336 GWAS SNPs. We then conducted the same procedure for the individual SNP analysis of just II SNPs and the four group analyses, with study groups substituted for individual SNPs. The full results of these calculations are shown in Figure S1. In the “Sample Ethnicity” section, we used the same method to determine if East Asian GWAS SNPs or study groups were overrepresented in the top 5% of the empirical distribution for any of our measures.
Literature Review for Sample Ethnicity
We used NHGRI's GWAS catalog to find the primary sources for the GWAS results listed on the website [5]. We reviewed these sources to determine the ethnicity of the samples used in each GWAS. We included samples that were used for replication analyses as well as those that were used for initial or discovery analyses. Individuals from the United States, Canada, or Australia that were described as “white”, “Caucasian”, or of European ancestry were considered European. African Americans from the United States were considered to be an admixed population. The one study that we reported as having been done on African samples used individuals native to the African continent.
Wilcoxon Test Comparing Asian and European GWAS SNPs and Study Groups
For each delta, Fst, LLC, and iHS measure in the individual SNP analysis of all GWAS SNPs, we made a list of all the p-values associated with East Asian GWAS SNPs and a list of all of the p-values associated with European GWAS SNPs. We used a one-tailed, unpaired Wilcoxon test to determine if the European p-values were less than the East Asian p-values or if the East Asian p-values were less than the European p-values. We then repeated this procedure for the II individual SNP analysis and all four group analyses. All of the comparisons we discuss in the results section had a p-value of 0.05 or less. The results of all tests are shown in Figure S5.
Identifying GWAS Regions for Height, T2D, and SLE
We listed all SNPs associated with height (including those not in the Li et al. [12] dataset) in order of their genomic positions. Any two SNPs that were less than 1MB apart were grouped together into one region. For this analysis, we considered only regions containing more than one SNP (regions defined by one SNP that was identified in more than one GWAS qualify as containing more than one SNP). For height, there were 26 such regions. We repeated this procedure for T2D and SLE.
Supporting Information
Zdroje
1. SaleMM
MychaleckyjJC
ChenW-M
2009 Planning and Executing a Genome Wide Association Study (GWAS).
Park-SargeQ-K
CurryTE
Molecular Endocrinology: Methods and Protocols New York Humana Press 403 418
2. DicksonSP
WangK
KrantzI
HakonarsonH
GoldsteinD
2010 Rare Variants Create Synthetic Genome-Wide Associations. PLoS Biology 8 e1000294
3. WangK
DicksonSP
StolleCA
KrantzID
GoldsteinDB
2010 Interpretation of Association Signals and Identification of Causal Variants from Genome-wide Association Studies. American Journal of Human Genetics 86 730 742
4. HindorffLA
SethupathyP
JunkinsHA
RamosEM
MehtaJP
2009 Potential etiologic and functional implications of genome-wide association loci for human diseases and traits. Proceedings of the National Academy of Science USA 106 9362 9367
5. HindorffLA
JunkinsHA
MehtaJP
ManolioTA
2010 A Catalog of Published Genome-Wide Association Studies. Available at: www.genome.gov/gwastudies. Accessed May 13, 2010.
6. AltshulerD
DalyMJ
LanderES
2008 Genetic Mapping in Human Disease. Science 322 881 888
7. PickrellJK
CoopG
NovembreJ
KudaravalliS
LiJZ
2009 Signals of recent positive selection in a worldwide sample of human populations. Genome Research 19 826 837
8. MylesS
DavisonD
BarrettJ
StonekingM
TimpsonN
2008 Worldwide population differentiation at disease-associated SNPs. BMC Medical Genomics 1 22
9. LohmuellerKE
MauneyMM
ReichD
BravermanJM
2006 Variants associated with common disease are not unusually differentiated in frequency across populations. American Journal of Human Genetics 78 130 136
10. AdeyemoA
RotimiC
2010 Genetic Variants Associated with Complex Human DiseasesShow Wide Variation across Multiple Populations. Public Health Genomics 13 72 79
11. MatteiJ
ParnellLD
LaiC-Q
Garcia-BailoB
AdiconisX
2009 Disparities in allele frequencies and population differentiation for 101 disease-associated single nucleotide polymorphisms between Puerto-Ricans and non-Hispanic whites. BMC Genetics 10 45
12. LiJZ
AbsherDM
TangH
SouthwickAM
CastoAM
2008 Worldwide human relationships inferred from genome-wide patterns of variation. Science 2008, 319 1100 1104
13. RosenbergNA
PritchardJK
WeberJL
CannHM
KiddKK
2002 Genetic structure of human populations. Science 298 2381 2385
14. CastoAM
LiJZ
AbsherD
MyersR
RamachandranS
2010 Characterization of X-linked SNP genotypic variation in globally-distributed human populations. Genome Biology 11 R10
15. VoightBF
KudaravalliS
WenX
PritchardJK
2006 A map of recent positive selection in the human genome. PLOS Biology 4 446 458
16. MeyreD
DelplanqueJ
ChèvreJC
LecoeurC
LobbensS
2009 Genome-wide association study for early-onset and morbid adult obesity identifies three new risk loci in European populations. Nature Genetics 41 157 159
17. LevyD
EhretGB
RiceK
VerwoertGC
LaunetLJ
2009 Genome-wide association study of blood pressure and hypertension. Nature Genetics 41 677 687
18. LimouS
Le ClercS
CoulongesC
CarpentierW
DinaC
2009 Genomewide association study of an AIDS-nonprogression cohort emphasizes the role played by HLA genes. Journal of Infectious Disease 199 419 426
19. LiuY
HelmsC
LiaoW
ZabaLC
DuanS
2008 A genome-wide association study of psoriasis and psoriatic arthritis identifies new disease loci. PLoS Genetics 4 e1000041
20. LandiMT
ChatterjeeN
YuK
GoldinLR
GoldsteinAM
2009 A genome-wide association study of lung cancer identifies a region of chromosome 5p15 associated with risk for adenocarcinoma. American Journal of Human Genetics 85 679 691
21. YangJJ
ChengC
YangW
PeiD
CaoX
2009 Genome-wide interrogation of germline genetic variation associated with treatment response in childhood acute lymphoblastic leukemia. Journal of the American Medical Association 301 393 403
22. Newton-ChehC
JohnsonT
GatevaV
TobinMD
BochudM
2009 Genome-wide association study identifies eight loci associated with blood pressure. Nature Genetics 41 666 676
23. OkadaY
KamataniY
TakahashiA
MatsudaK
HosonoN
2010 A genome-wide association study in 19,633 Japanese subjects identified LHX3-QSOX2 and IGF1 as adult height loci. Human Molecular Genetics 19 2203 2312
24. KimJJ
LeeHI
ParkT
KimK
LeeJE
2010 Identification of 15 loci influencing height in a Korean population. American Journal of Human Genetics 55 27 31
25. ChoYS
GoMJ
KimYJ
HeoJY
OhJH
2009 A large-scale genome-wide association study of Asian populations uncovers genetic factors influencing eight quantitative traits. Nature Genetics 41 527 534
26. LeiSF
YangTL
TanLJ
ChenXD
GuoY
2009 Genome-wide association scan for stature in Chinese: evidence for ethnic specific loci. Human Genetics 125 1 9
27. TsaiFJ
YangCF
ChenCC
ChuangLM
LuCH
2010 A genome-wide association study identifies susceptibility variants for type 2 diabetes in Han Chinese. PLoS Genetics 6 e1000847
28. TakeuchiF
SerizawaM
YamamotoK
FujisawaT
NakashimaE
2009 Confirmation of multiple risk Loci and genetic impacts by a genome-wide association study of type 2 diabetes in a Japanese population. Diabetes 58 1690 1699
29. UnokiH
TakahashiA
KawaguchiT
HaraK
HorikoshiM
2008 SNPs in KCNQ1 are associated with susceptibility to type 2 diabetes in East Asian and European populations. Nature Genetics 40 1098 1102
30. YasudaK
MiyakeK
HorikawaY
HaraK
OsawaH
2008 Variants in KCNQ1 are associated with susceptibility to type 2 diabetes mellitus. Nature Genetics 40 1092 1097
31. YangW
ShenN
YeDQ
LiuQ
ZhangY
2010 Genome-wide association study in Asian populations identifies variants in ETS1 and WDFY4 association with systemic lupus erythematosus. PLoS Genetics 12 e1000841
32. HanJW
ZhengHF
CuiY
SunLD
YeDQ
2009 Genome-wide association study in a Chinese Han population identifies nine new susceptibility loci for systemic lupus erythematosus. Nature Genetics 41 1234 1237
33. FellayJ
GeD
ShiannaKV
ColomboS
LedergerberB
2009 Common genetic variation and the control of HIV-1 in humans. PLoS Genetics 5 e1000791
34. GudbjartssonDF
WaltersGB
ThorleifssonG
StefanssonH
HalldorssonBV
2008 Many sequence variants affecting diversity of adult human height. Nature Genetics 40 609 615
35. PritchardJK
PickrellJK
CoopG
2010 The Genetics of Human Adaptation: Hard Sweeps, Soft Sweeps, and Polygenic Adaptation. Current Biology 20 R208 R215
36. PritchardJK
Di RienzoA
2010 Adaptation – not by sweeps alone. Nature Reviews Genetics 11 665 667
37. HancockAM
WitonskyDB
EhlerE
Alkorta-AranburuG
BeallC
2010 Human adaptations to diet, subsistence, and ecoregion are due to subtle shifts in allele frequency. Proceedings of the National Academy of Science 107 Supplement 2 8924 8930
38. BartonNH
KeightleyPD
2002 Understanding quantitative genetic variation. Nature Reviews Genetics 3 11 21
39. Mitchell-OldsT
WillisJH
GoldsteinDB
2007 Which evolutionary processes influence natural genetic variation for phenotypic traits? Nature Reviews Genetics 8 845 856
40. StrumRA
2009 Molecular genetics of human pigmentation diversity. Human Molecular Genetics 18 R9 R17
41. WilliamsonSH
HubiszMJ
ClarkAG
PayseurBA
BustamanteCD
2007 Localizing recent adaptive evolution in the human genome. PLoS Genetics 3 e90
42. SabetiPC
VarillyP
FryB
LohuellerJ
HostetterE
2007 Genome-wide detection and characterization of positive selection in human populations. Nature 449 913 918
43. JohanssonA
GyllenstenU
2008 Identification of local selective sweeps in human populations since the exodus from Africa. Hereditas 145 126 137
44. LamasonRL
MohideenMPK
MestJR
WongAC
NortonHL
2005 SLC24A5, a Putative Cation Exchanger, Affects Pigmentation in Zebrafish and Humans. Science 310 1782 1786
45. NortonHL
KittlesRA
ParraE
McKeigueP
MaoX
2007 Genetic Evidence for the Convergent Evolution of Light Skin in Europeans and East Asians. Molecular Biology and Evolution 24 710 722
46. SoejimaM
TachidaH
IshidaT
SanoA
KodaY
2006 Evidence for Recent Positive Selection at the Human AIM1 Locus in a European Population. Molecular Biology and Evolution 23 179 188
47. McEvoyB
BelezaS
ShriverMD
2006 The genetic architecture of normal variation in human pigmentation: an evolutionary perspective and model. Human Molecular Genetics 15 R176 R181
48. IzagirreN
GarciaI
JunqueraC
de la RuaC
AlonsoS
2006 A Scan for Signatures of Positive Selection in Candidate Loci for Skin Pigmentation in Humans. Molecular Biology and Evolution 23 1697 1706
49. LaoO
de GruijterJM
van DuijnK
NavarroA
KayserM
2007 Signatures of positive selection in genes associated with human skin pigmentation as revealed from analyses of single nucleotide polymorphisms. Annals of Human Genetics 71 354 369
50. MylesS
SomelM
TangK
KelsoJ
StonekingM
2007 Identifying genes underlying skin pigmentation differences among human populations. Human Genetics 120 613 621
51. YoungJH
ChangYC
KimJD
ChretienJ
KlagMJ
2005 Differential Susceptibility to Hypertension is due to Selection during the Out-of-Africa Expansion. PLoS Genetics 1 e82
52. YoungJH
2007 Evolution of Blood Pressure Regulation in Humans. Current Hypertension Reports 9 13 18
53. ZhernakovaA
ElbersCC
FerwerdaB
RomanosJ
TrynkaG
2010 Evolutionary and Functional Analysis of Celiac Risk Loci Reveals SH2B3 as a Protective Factor against Bacterial Infection. American Journal of Human Genetics 86 970 977
54. KosiolC
VinařT
da FonsecaRR
HubiszMJ
BustamanteCD
2008 Patterns of positive selection in six mammalian genomes. PLoS Genetics 4 e1000144
55. BarreiroLB
Quintana-MurciL
2010 From evolutionary genetics to human immunology: how selection shapes host defence genes. Nature Reviews Genetics 11 17 30
56. HughesAL
NeiM
1988 Pattern of nucleotide substitution at major histocompatibility complex class I loci reveals overdominant selection. Nature 335 167 170
57. TakahataN
SattaY
KleinJ
1992 Polymorphism and balancing selection at major histocompatibility complex loci. Genetics 130 925 938
58. PrugnolleF
ManicaA
CharpentierM
GuéganJF
GuernierV
2005 Pathogen-driven selection and worldwide HLA Class I diversity. Current Biology 15 1022 1027
59. SolbergOD
MackSJ
LancasterAK
SingleRM
TsaiY
2008 Balancing selection and heterogeneity across the classical human leukocyte antigen loci: a meta-analytic review of 497 population studies. Human Immunology 69 443 464
60. KwiatkowskiDP
2005 How malaria has affected the human genome and what human genetics can teach us about malaria. American Journal of Human Genetics 77 171 192
61. TishkoffSA
VarkonyiR
CahinhinanN
AbbesS
ArgyropoulosG
2001 Haplotype diversity and linkage disequilibrium at human G6PD: recent origin of alleles that confer malarial resistance. Science 293 455 462
62. HamblinMT
Di RienzoA
2000 Detection of the signature of natural selection in humans: evidence from the Duffy blood group locus. American Journal of Human Genetics 66 1669 1679
63. HamblinMT
ThompsonEE
Di RienzoA
2002 Complex signatures of natural selection at the Duffy blood group locus. American Journal of Human Genetics 70 369 383
64. OhashiJ
NakaI
PatarapotikulJ
HananantachaiH
BrittenhamG
2004 Extended linkage disequilibrium surrounding the hemoglobin E variant due to malarial selection. American Journal of Human Genetics 74 1198 1208
65. WilderJA
HewettEK
GansnerME
2009 Molecular evolution of GYPC: evidence for recent structural innovation and positive selection in humans. Molecular Biology and Evolution 26 2679 2687
66. SabetiPC
WalshE
SchaffnerSF
VarillyP
FryB
2005 The case for selection at CCR5-Δ32. PLoS Biology 3 e378
67. BamshadMJ
MummidiS
GonzalezE
AhujaSS
DunnDM
2002 A strong signature of balancing selection in the 5′ cis-regulatory region of CCR5. Proceedings of the National Academy of Sciences 99 10539 10544
68. BarreiroLB
Ben-AliM
QuachH
LavalG
PatinE
2009 Evolutionary dynamics of human Toll-like receptors and their different contributions to host defense. PLoS Genetics 5 e1000562
69. BernigT
TaylorJG
FosterCB
StaatsB
YeagerM
2004 Sequence analysis of the mannose-binding lectin (MBL2) gene reveals a high degree of heterozygosity with evidence of selection. Genes and Immunity 5 461 476
70. MukherjeeS
Sarkar-RoyN
WagenerDK
MajumderPP
2009 Signatures of natural selection are not uniform across genes of innate immune system, but purifying selection is the dominant signature. Proceedings of the National Academy of Sciences 106 7073 7078
71. HirayasuK
OhashiJ
TanakaH
KashiwaseK
OgawaA
2008 Evidence for natural selection on leukocyte immunoglobulin-like receptors for HLA class I in Northeast Asians. American Journal of Human Genetics 82 1075 1083
72. SeixasS
SurianoG
CarvalhoF
SerucaR
RochaJ
2007 Sequence diversity at the proximal 14q32.1 SERPIN subcluster: evidence for natural selection favoring the pseudogenization of SERPINA2. Molecular Biology and Evolution 24 587 598
73. XueY
DalyA
YngvadottirB
LiuM
CoopG
2006 Spread of an inactive form of caspase-12 in humans is due to recent positive selection. American Journal of Human Genetics 78 659 670
74. VilchesC
ParhamP
2002 KIR: diverse, rapidly evolving receptors of innate and adaptive immunity. Annual Reviews in Immunology 20 217 251
75. NormanPJ
Abi-RachedL
GendzekhadzeK
KorbelD
GleimerM
2007 Unusual selection on the KIR3DL/S1 natural killer cell receptor in Africans. Nature Genetics 39 1092 1099
76. GalvaniAP
SlatkinM
2003 Evaluating plague and smallpox as historical selective pressures for the CCR5-Delta 32 HIV-resistance allele. Proceedings of the National Academy of Science 100 15276 15279
77. SiddiquiRA
SauermannU
AltmüllerJ
FritzerE
NothnagelM
2009 X chromosomal variation is associated with slow progression to AIDS in HIV-1-infected women. American Journal of Human Genetics 85 228 239
78. FumagalliM
PozzoliU
CagilaniR
ComiGP
RivaS
2009 Parasites represent a major selective force for interleukin genes and shape the genetic predisposition to autoimmune conditions. Journal of Experimental Medicine 206 1395 1408
79. RajagopalanS
LongEO
2005 Understanding how combinations of HLA and KIR genes influence disease. Journal of Experimental Medicine 201 1025 1029
80. NairRP
DuffinKC
HelmsC
DingJ
StuartPE
2009 Genome-wide scan reveals association of psoriasis with IL-23 and NF-kappB pathways. Nature Genetics 41 199 204
81. ZhangXJ
HuangW
YangS
SunLD
ZhangFY
2009 Psoriasis genome-wide association study identified susceptibility variants within LCE gene cluster at 1q21. Nature Genetics 2009, 41 205 210
82. ManolioTA
CollinsFS
CoxNJ
GoldsteinDB
HindorffLA
2009 Finding the missing heritability of complex diseases. Nature 461 747 753
83. CraddockN
HurlesME
CardinN
PearsonRD
PlagnolV
2010 Genome-wide association study of CNVs in 16,000 cases of eight common diseases and 3,000 shared controls. Nature 464 713 720
84. MackayTFC
StoneEA
AyrolesJF
2009 The genetics of quantitative traits: challenges and prospects. Nature Reviews Genetics 10 565 577
85. FlintJ
MackayTFC
2009 Genetic architecture of quantitative traits in mice, flies, and humans. Genome Research 19 723 733
86. BarreiroLB
LavalG
QuachH
PatinE
Quintana-MurciL
2008 Natural selection has driven population differentiation in modern humans. Nature Genetics 40 340 345
87. CaiJJ
MacphersonJM
SellaG
PetrovDA
2009 Pervasive hitchhiking at coding and regulatory sites in humans. PLoS Genetics 5 e1000336
88. McVickerG
GordonD
DavisC
GreenP
2009 Widespread genomic signatures of natural selection in hominid evolution. PLoS Genetics 5 e1000471
89. The International HapMap Consortium 2003 The International HapMap Project. Nature 426 789 796
Štítky
Genetika Reprodukční medicínaČlánek vyšel v časopise
PLOS Genetics
2011 Číslo 1
Nejčtenější v tomto čísle
- H3K9me-Independent Gene Silencing in Fission Yeast Heterochromatin by Clr5 and Histone Deacetylases
- Evolutionary Conserved Regulation of HIF-1β by NF-κB
- Rnf12—A Jack of All Trades in X Inactivation?
- Joint Genetic Analysis of Gene Expression Data with Inferred Cellular Phenotypes