
Quaking Regulates Expression through Its 3′ UTR in Oligodendrocyte Precursor Cells
In mice, Quaking (Qk) is required for myelin formation; in humans, it has been associated with psychiatric disease. QK regulates the stability, subcellular localization, and alternative splicing of several myelin-related transcripts, yet little is known about how QK governs these activities. Here, we show that QK enhances Hnrnpa1 mRNA stability by binding a conserved 3′ UTR sequence with high affinity and specificity. A single nucleotide mutation in the binding site eliminates QK-dependent regulation, as does reduction of QK by RNAi. Analysis of exon expression across the transcriptome reveals that QK and hnRNP A1 regulate an overlapping subset of transcripts. Thus, a simple interpretation is that QK regulates a large set of oligodendrocyte precursor genes indirectly by increasing the intracellular concentration of hnRNP A1. Together, the data show that hnRNP A1 is an important QK target that contributes to its control of myelin gene expression.
Published in the journal:
. PLoS Genet 7(1): e32767. doi:10.1371/journal.pgen.1001269
Category:
Research Article
doi:
https://doi.org/10.1371/journal.pgen.1001269
Summary
In mice, Quaking (Qk) is required for myelin formation; in humans, it has been associated with psychiatric disease. QK regulates the stability, subcellular localization, and alternative splicing of several myelin-related transcripts, yet little is known about how QK governs these activities. Here, we show that QK enhances Hnrnpa1 mRNA stability by binding a conserved 3′ UTR sequence with high affinity and specificity. A single nucleotide mutation in the binding site eliminates QK-dependent regulation, as does reduction of QK by RNAi. Analysis of exon expression across the transcriptome reveals that QK and hnRNP A1 regulate an overlapping subset of transcripts. Thus, a simple interpretation is that QK regulates a large set of oligodendrocyte precursor genes indirectly by increasing the intracellular concentration of hnRNP A1. Together, the data show that hnRNP A1 is an important QK target that contributes to its control of myelin gene expression.
Introduction
Myelin is a lipid-rich structure that facilitates the propagation of electrical impulses along neuronal axons and protects them from degeneration [1]–[3]. In the central nervous system (CNS), myelin is produced by oligodendrocytes, glial cells that ensheathe nearby axons with specialized cytoplasmic processes. Defects in the formation and maintenance of myelin cause several devastating diseases in humans, including multiple sclerosis, leukodystrophy, and Pelizaeus-Merzbacher disease.
In the mouse, myelin formation requires QK, a STAR domain RNA-binding protein that regulates gene expression after transcription [4]. The quaking viable (Qkqk) mutation, which causes a pronounced tremor, was discovered over forty years ago [5]. The phenotype is caused by the failure to form compact myelin in the CNS and derives from a large deletion lying upstream of the Quaking (Qk) locus [6]. The Qkqk mutation eliminates oligodendrocyte expression of two cytoplasmic QK splice isoforms, QK-6 and QK-7, and reduces expression of a third nuclear isoform, QK-5, primarily in the more severely affected rostral areas [7]. In Qkqk mice, expression of QK-6 under the control of the oligodendrocyte-specific proteolipid protein gene (Plp1) promoter rescues the myelin defect, demonstrating that QK-6 alone suffices to restore QK function [8]. Other alleles of Qk are embryonic lethal, except for the Qke5 allele identified by Justice and coworkers that also causes severe demyelination [9].
QK is a multifunctional protein proposed to control myelin formation through three different mechanisms. First, QK stabilizes the myelin basic protein (Mbp), microtubule associated protein 1B (Map1b), and p27Kip1 mRNAs in the brain or in cultured oligodendrocytes [10]–[12]. Second, QK controls the subcellular distribution of Mbp mRNA, such that an increase in the ratio of nuclear to cytoplasmic QK isoforms drives nuclear retention of Mbp mRNA and reduces Mbp translation [13]. Finally, QK regulates alternative splicing of Mbp, Plp1, and myelin associated glycoprotein (Mag) mRNAs [14]. Qkqk mutant brains display altered isoform ratios of Mbp, Plp1, and Mag transcripts, and splicing of a Mag mini-gene is altered in the presence of exogenous QK-5 in cultured COS-7 cells [14]. How QK controls such diverse processes is unclear.
Quaking has recently been implicated in several human psychiatric diseases. Human Quaking (QKI) has been proposed to be a candidate gene for schizophrenia (SCZ). Genetic linkage analysis has identified a 0.5 Mb haplotype in the region of QKI that segregates with SCZ in a large Swedish pedigree [15]. Moreover, SCZ brains have a number of similarities with the brains of Qkqk mice, including downregulation of QKI and a number of other myelin-related genes, including MBP, MAG, and PLP11 [16]–[18]. Additionally, like Qkqk brains, SCZ brains contain a number of mRNAs that are present at abnormal splice isoform ratios [19]–[22]. Some of these, including Mag, are also mis-spliced in the Qkqk mouse, suggesting that splicing alterations in the Qkqk mouse and in SCZ brains could share a common mechanism [16]. Other clinical phenotypes in which disruptions in QK function are thought to contribute to disease include major depressive disorder and 6q terminal deletion syndrome [23], [24].
Despite the importance of QK for myelination and its implications for human health, relatively few direct targets have been identified. Thermodynamic binding analysis and SELEX have shown that the sequence element ACUAAY, alternatively termed the Quaking Star Binding Element (QSBE) or Quaking Response Element (QRE), is required for a high affinity interaction between purified QK protein and its target RNA [25], [26]. Additionally, a recent cross-link immunoprecipitation study using chemically modified nucleotides detected binding to the sequence ACUAAY and an additional sequence variant AUUAAY [27]. It remains unclear how binding affinity in vitro correlates to binding site occupancy and regulation in vivo. The relative simplicity of the binding determinant, which is predicted to occur approximately once per kb of random RNA sequence, suggests that the binding element may not be sufficient to specify mRNA targets [28]. A single QSBE is present within the 3′UTR of Mbp mRNA in a region required for post-transcriptional regulation of Mbp expression [25], [26]. However, a region of Mag pre-mRNA that has been shown experimentally to drive QK-dependent splicing events does not contain a QSBE or the variant AUUAAY [14]. Here, we set out to determine whether the QK binding element mediates QK-dependent regulation in Mbp and other regulatory targets. We show that QK regulation of Mbp expression requires the QSBE. Additionally, we identify a novel target, Hnrnpa1 mRNA, and show that QK regulates Hnrnpa1 expression in a similar fashion to Mbp. Finally, we show that hnRNP A1 contributes to QK control of myelin gene expression in genome wide analyses.
Results
The QSBE is a functional regulatory element within the Mbp 3′ UTR
It has previously been shown that QK interacts with a region of the Mbp 3′ UTR and that the core element required for the interaction is the sequence ACUAAY [25], [26]. SELEX experiments suggest that a nearby YAAY may also contribute to target selection [26]. We asked whether the QSBE is required for post-transcriptional regulation of mRNA by QK.
To test whether the QSBE is a required element within the Mbp 3′ UTR, we established a quantitative two-color fluorescence reporter assay in CG-4 oligodendrocyte precursor cells, an immortalized cell line (Figure 1A, Figure S1A, S1B, S1C) [29]. CG-4 cells can be maintained in culture as progenitors or induced to differentiate into mature oligodendrocytes, can be transfected, and express QK and a relevant QK target population. Additionally, their use avoids the potential complications of the Qkqk mouse, in which the genetic lesion lies upstream of the Qk locus and deletes parts of two additional genes [6], [30]. A complete Qk knockout is embryonic lethal [31].

We compared expression of a GFP reporter bearing the Mbp 3′ UTR to a reporter bearing a mutant Mbp 3′ UTR harboring a U to G point mutation that blocks binding of QK to the RNA (Figure 1B) [25]. All other aspects of the constructs were identical. We observed three-fold less reporter mRNA in cells transfected with the mutant construct compared to the wild type (relative expression 0.36±0.07, p = 0.02) (Figure 1C). In contrast, GFP reporter fluorescence increased by a small amount as a result of the mutation (relative expression 1.38±0.20, p = 0.04) (Figure 1C). Dividing the protein expression by the mRNA expression gives a representation of the efficiency of mRNA translation [32]. The QSBE mutant yields four-fold more reporter protein per unit RNA compared to the wild-type reporter (relative value 3.83±0.93, p = 0.03) (Figure 1C). In total, we observed two opposing effects of the QSBE in the Mbp 3′ UTR: a positive effect on mRNA level and a negative effect on the efficiency of translation. These results demonstrate that the QSBE is a functional cis-regulatory element within the Mbp 3′ UTR and are consistent with published findings that QK positively controls Mbp mRNA stability and negatively controls its translation through nuclear retention of its mRNA [10], [13].
QK interacts with a QSBE within the 3′ UTR of the Hnrnpa1 mRNA
In addition to promoting mRNA stability, QK regulates alternative splicing. However, the sequence that has been experimentally shown to drive QK dependent splicing, the Mag splicing control element, does not contain the QSBE sequence or the variant AUUAAY [14]. Moreover, recombinant QK does not interact with the Mag splicing control sequence or the splicing control sequence of another QK target, Plp1, by electromobility shift assays [33], [34] (Figure S2). The site of QK binding could lie distal to the minimal QK-responsive splicing elements that have been described. Alternatively, accessory proteins found in the nucleus might modify QK binding specificity, bringing it to other targets. A third and simpler possibility is that the effect of QK on alternative splicing could be a secondary consequence of deregulation of another factor.
To test the final hypothesis, we first determined the ability of QK to associate with five splicing factor mRNAs (Hnrnpa1, Tra2b, Sfrs5, Prpf4b, and Slu7) that contain a QSBE in their 3′ UTRs by RNA-immunoprecipitation from mouse brain lysate. We were unable to detect an interaction between QK and Sfrs5, Tra2b, Prpf4b, and Slu7 mRNAs using an anti-QK antibody that recognizes all three QK isoforms (Figure S3). In contrast, we observe association of QK with Hnrnpa1 mRNA, which contains a single QSBE sequence within a conserved region of its 3′ UTR (Figure 2A), in both uncrosslinked and formaldehyde crosslinked brain lysates (Figure 2B, 2C). In uncrosslinked brain lysates, QK antibodies immunopreciptate 20% of the input Hnrnpa1 mRNA, and 3% of control Sf3b1 mRNA, which encodes a core spliceosomal component. The formaldehyde crosslinking experiment controls for the possibility of QK repartioning during extract preparation, while the uncrosslinked experiment confirms that the crosslinking agent is not capturing a transient association.

To determine whether QK binds the QSBE within the Hnrnpa1 3′ UTR with high affinity and specificity, we used gel mobility shift and fluorescence polarization (FP) assays to measure the association of recombinant, purified QK RNA-binding domain with a 30 nucleotide synthetic RNA derived from the Hnrnpa1 3′ UTR and containing the QSBE (Figure 2A). The Kd,app for binding was 36±2 nM; a U to G mutation within the QSBE reduced binding by >50-fold (Figure 2D, 2E). The previously identified Mbp QSBE bound with an apparent Kd of 44±2 nM, and the interaction was competed with a 12-nucleotide Hnrnpa1 RNA containing the core ACUAAY motif (Figure 2E).
QK controls Hnrnpa1 mRNA abundance and translational efficiency
We used the GFP reporter assay to test whether the QSBE from Hnrnpa1 functions in cultured CG-4 cells (Figure 3A). The U to G point mutation within the Hnrnpa1 3′ UTR that eliminated QK binding in vitro (Figure 2D) reduced reporter mRNA level by approximately five-fold (relative expression 0.21±0.04, p = 0.001), consistent with a role for QK in promoting mRNA stability (Figure 3B). As with the Mbp reporter, the binding site mutation had a small increase on the amount of fluorescent protein produced (1.36±0.2, p = 0.001) (Figure 3C). The same increase was also observed using an independent dual luciferase reporter assay in which the Hnrnpa1 3′ UTR containing the wild-type or the U-to-G point mutant QSBE was inserted into the Renilla reniformis luciferase 3′ UTR (1.9±0.5, p = 0.02) (Figure 3D). Renilla expression also increased in a CG-4 cell line that stably expresses a Qk shRNAmiR (1.53±0.05, p = 0.04)(Figure 3D). We were unable to test the effect of Qk shRNAmiR in the GFP reporter assay because the shRNAmiR construct also expresses GFP.

To obtain a measure of translational efficiency, we divided the normalized reporter fluorescence by the normalized amount of reporter mRNA [35]. Translational efficiency of the QSBE mutant Hnrnpa1 3′ UTR was increased (6.58±1.66, p = 0.014) compared to the construct without the mutation (Figure 3E), indicating that the QSBE mutation increases the efficiency of translation of the reporter transcript. We were not able to determine reporter mRNA concentration using the luciferase reporter assay because of persistent contaminating reporter DNA. Together the data establish that QK binds the Hnrnpa1 3′ UTR through the QSBE and that this binding enhances Hnrnpa1 mRNA stability but reduces its translation. The results parallel the data collected using the Mbp reporter.
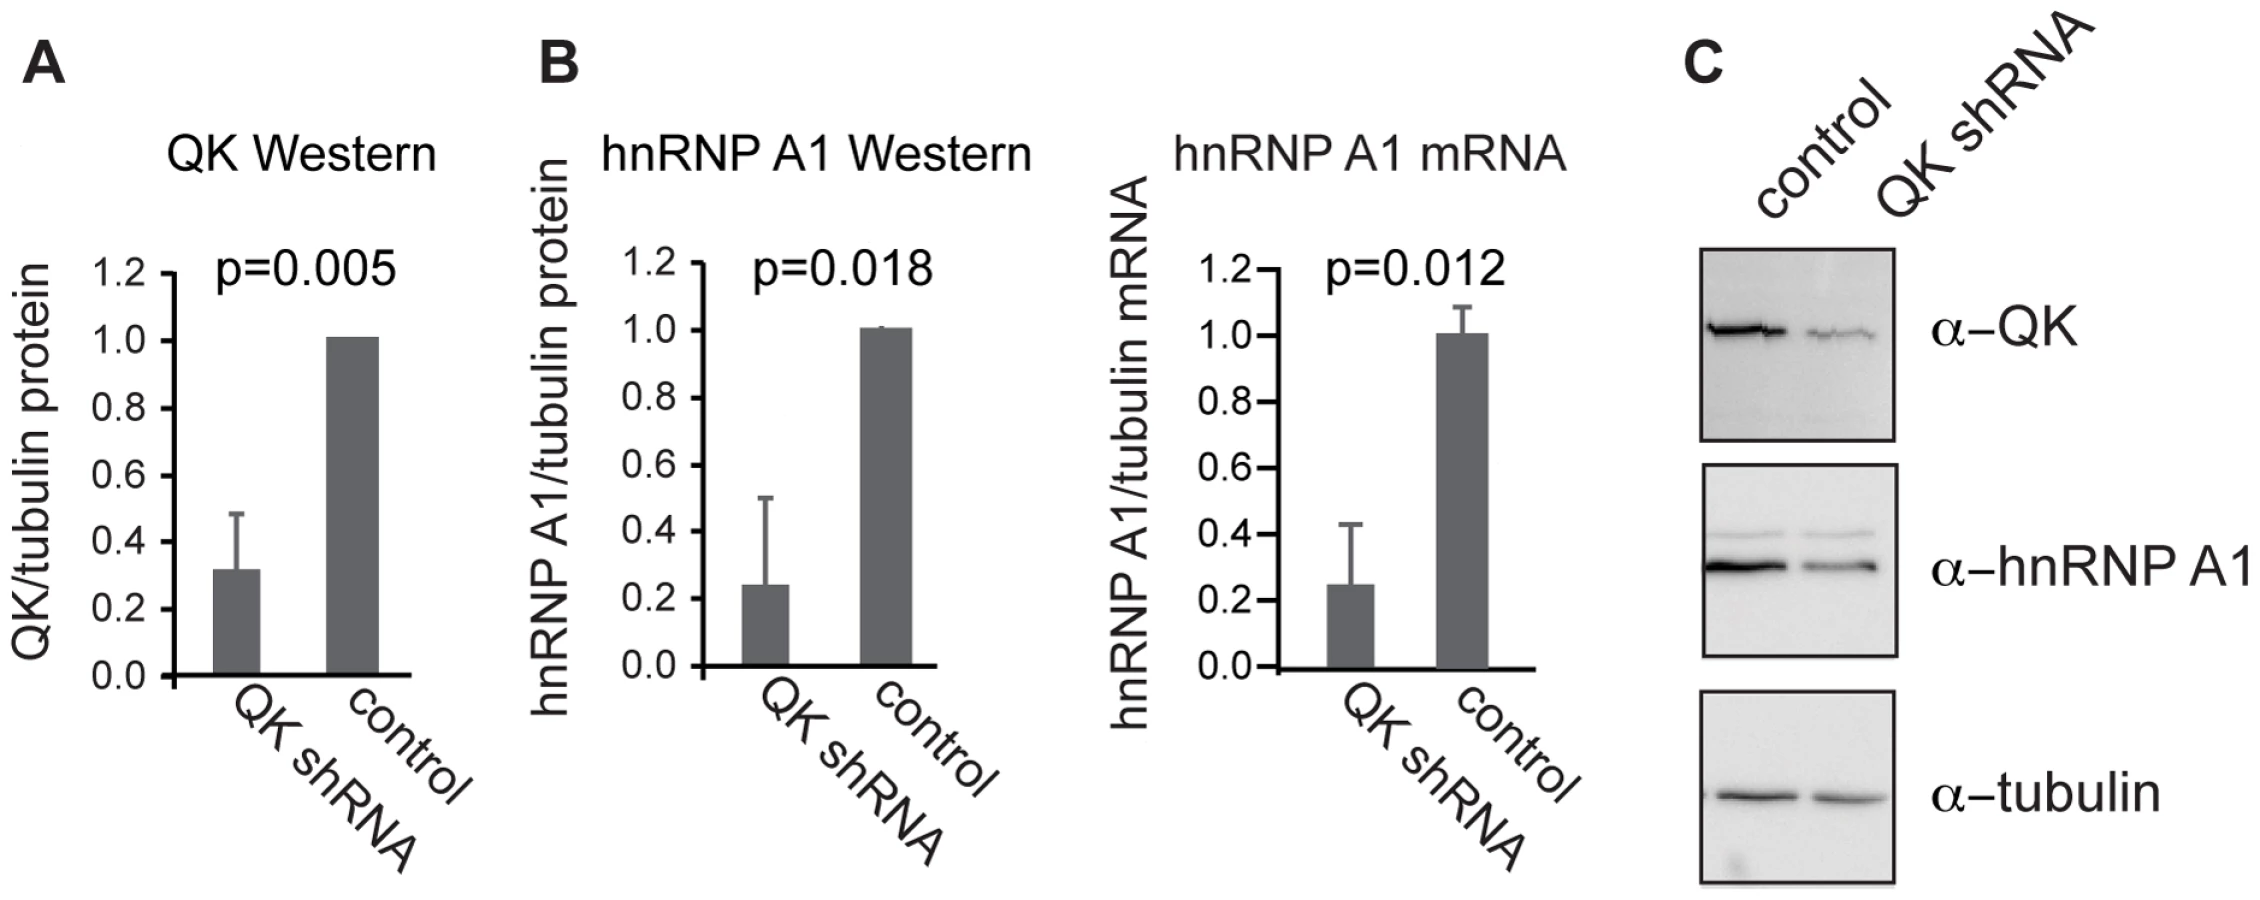
The reporter constructs isolate 3′-UTR dependent regulation of Hnrnpa1. However, Hnrnpa1 expression is also regulated in 3′-UTR-independent ways. For example, hnRNP A1 is known to regulate its own alternative splicing [36]. Moreover, hnRNP A1 protein stability or indirect regulation of hnRNP A1 transcription would not factor into reporter expression measurements. It is therefore important to determine the overall effect of QK on the amount of endogenous hnRNP A1. We measured Hnrnpa1 mRNA and protein levels in the Qk shRNAmiR knockdown CG-4 cell line compared to a non-targeting shRNAmiR line (Figure 4A) by qRT-PCR and Western blot. The Qk knockdown line exhibited a four-fold decrease in endogenous Hnrnpa1 mRNA (0.25±0.18, p = 0.012), which matches the effect of mutating the QSBE in the Hnrnpa1 3′-UTR reporter. We also observe a four-fold reduction in hnRNP A1 protein (0.24±0.25, P = 0.018) in the Qk shRNAmiR line (Figure 4B, 4C), which contrasts with our 3′-UTR reporter data. Thus, we conclude that QK has a net positive effect on hnRNP A1 expression in CG-4 cells, and that QK-dependent regulation of Hnrnpa1 mRNA stability is more important to endogenous hnRNP A1 expression than control of translation efficiency, at least in CG-4 oligodendrocyte precursors.
hnRNP A1 regulates Mag exon 12 alternative splicing
Because hnRNP A1 represses alternative splicing, misregulation of hnRNP A1 is predicted to alter splicing patterns in the Qkqk mouse brain. Wu et al. [14] identified splicing changes in the brains of Qkqk mice for three myelin-related transcripts: Mbp, Plp1, and Mag. We therefore selected these mRNAs for further analysis.
For Mag, we analyzed the ratio of S-Mag, which includes the alternatively spliced exon 12, to L-Mag, in which the exon is skipped. Inclusion of this exon is increased in Qkqk mice despite the overall reduction of QK in each [14], [16]. Control CG-4 cells transfected with the GFP plasmid and selected in G418 contained an S-Mag to L-Mag isoform ratio of 2.4±0.2 (Figure 5A). Reduction of QK with Qk siRNA caused an increase in the amount of S-Mag compared to L-Mag, resulting in an isoform ratio of 4.7±1.2 (p = 0.04, Figure 5A, 5C). The increase is similar to that previously observed by others in the Qkqk mouse brain, confirming that QK controls Mag splicing in CG-4 cells as it does in brains. CG-4 cells transfected with Hnrnpa1 siRNA displayed an increased isoform ratio of 5.0±1.7 (p = 0.01) (Figure 5A, 5C). The direction of the change is consistent with a role for hnRNP A1 in splicing repression and with our observation that QK has a net positive effect on hnRNP A1 expression in CG-4 cells. Transfection with control, Hnrnpc, or Sfrs5 siRNAs did not significantly alter the isoform ratio (Figure 5A, Figure S4). The data indicate that hnRNP A1 regulates Mag exon 12 splicing and suggest that QK control of Mag splicing may be indirect.

We also examined alternative splicing of Plp1 and Mbp. RT-PCR analysis of Mbp alternative splicing did not reliably confirm the QK-dependence in CG-4 cells (data not shown). To further examine Plp1 splicing in QK knockdown and in hnRNP A1 knockdown CG-4 cells, RT-PCR primers were designed to determine the relative ratio of Plp1, which contains a longer exon 3 variant due to alternative 5′ splice site selection, to Dm20, a transcript containing the shorter exon 3 variant. While QK siRNA reduced the amount of Plp1 compared to Dm20, mirroring the change observed in Qkqk mouse brains, there was no detectable change upon transfection with Hnrnpa1 siRNA (Figure 5B, 5C). The data suggest that for Plp1, QK controls alternative splicing not through hnRNP A1 but, instead, through some other mechanism.
Microarray assay design
Because QK positively regulates hnRNP A1 in CG-4 cells, we anticipated that the isoform ratio of many transcripts in addition to Mag and Plp1 would be altered upon QK knockdown. To test this hypothesis, we used Affymetrix 1.0 ST exon microarrays to assess global changes in gene expression in response to QK depletion (Figure 6A). To reduce the likelihood of detecting off-target effects or changes in gene expression brought about by the clonal selection procedure, we also analyzed cells that were prepared by transient transfection with Qk siRNA (Ambion) along with a GFP-expressing plasmid that allows selection with a different drug than that used for stable cell line production. After two days of selection, the Qk siRNA reduces Qk expression by approximately 80%, while the control siRNA does not (Figure 6B). In parallel, we also analyzed changes caused by depleting hnRNP A1 by transient transfection of a corresponding siRNA. Depletion of hnRNP A1 was confirmed by Western blotting (Figure 6C). Three independent biological replicates were analyzed for each group. In addition to the Qk shRNA, Qk siRNA, and Hnrnpa1 siRNA groups, we also assayed gene expression in control cells treated with non-silencing shRNA, non-silencing siRNA, and untreated CG-4 cells.

Identification of transcripts controlled by QK in oligodendrocyte precursors
We first wished to identify the set of transcripts regulated by QK at the level of transcript abundance. At a False Discovery Rate (FDR) of 0.1 (step-up, p-value 0.0012), 224 transcripts were identified with a p-value at or below the cut-off (Figure 7A, Table S1). These transcripts are predicted to include 22 false positives and 202 true positives. For this set of transcripts, the mean expression of the three replicates was calculated and the log2 fold change compared to untreated CG-4 cells was determined.

Hierarchical clustering (Pearson's dissimilarity, centroid method) revealed that gene expression in the Qk siRNA and Qk shRNA samples was highly correlated (Pearson's correlation coefficient 0.88; Figure 7A), confirming our statistical selection of transcripts. Gene expression changes in the control samples were less correlated, indicating that we have identified changes in gene expression due to the reduction of QK and not to other elements of the experimental protocol. To confirm the array results, we used quantitative RT-PCR to assess gene expression changes in the Qk shRNAmiR stable cell line. Of fourteen transcripts tested, thirteen had a difference in expression by quantitative RT-PCR (Figure 7B). The transcript that had the greatest change in QK knockdown cells was the previously identified QK target Mbp (Figure 7B).
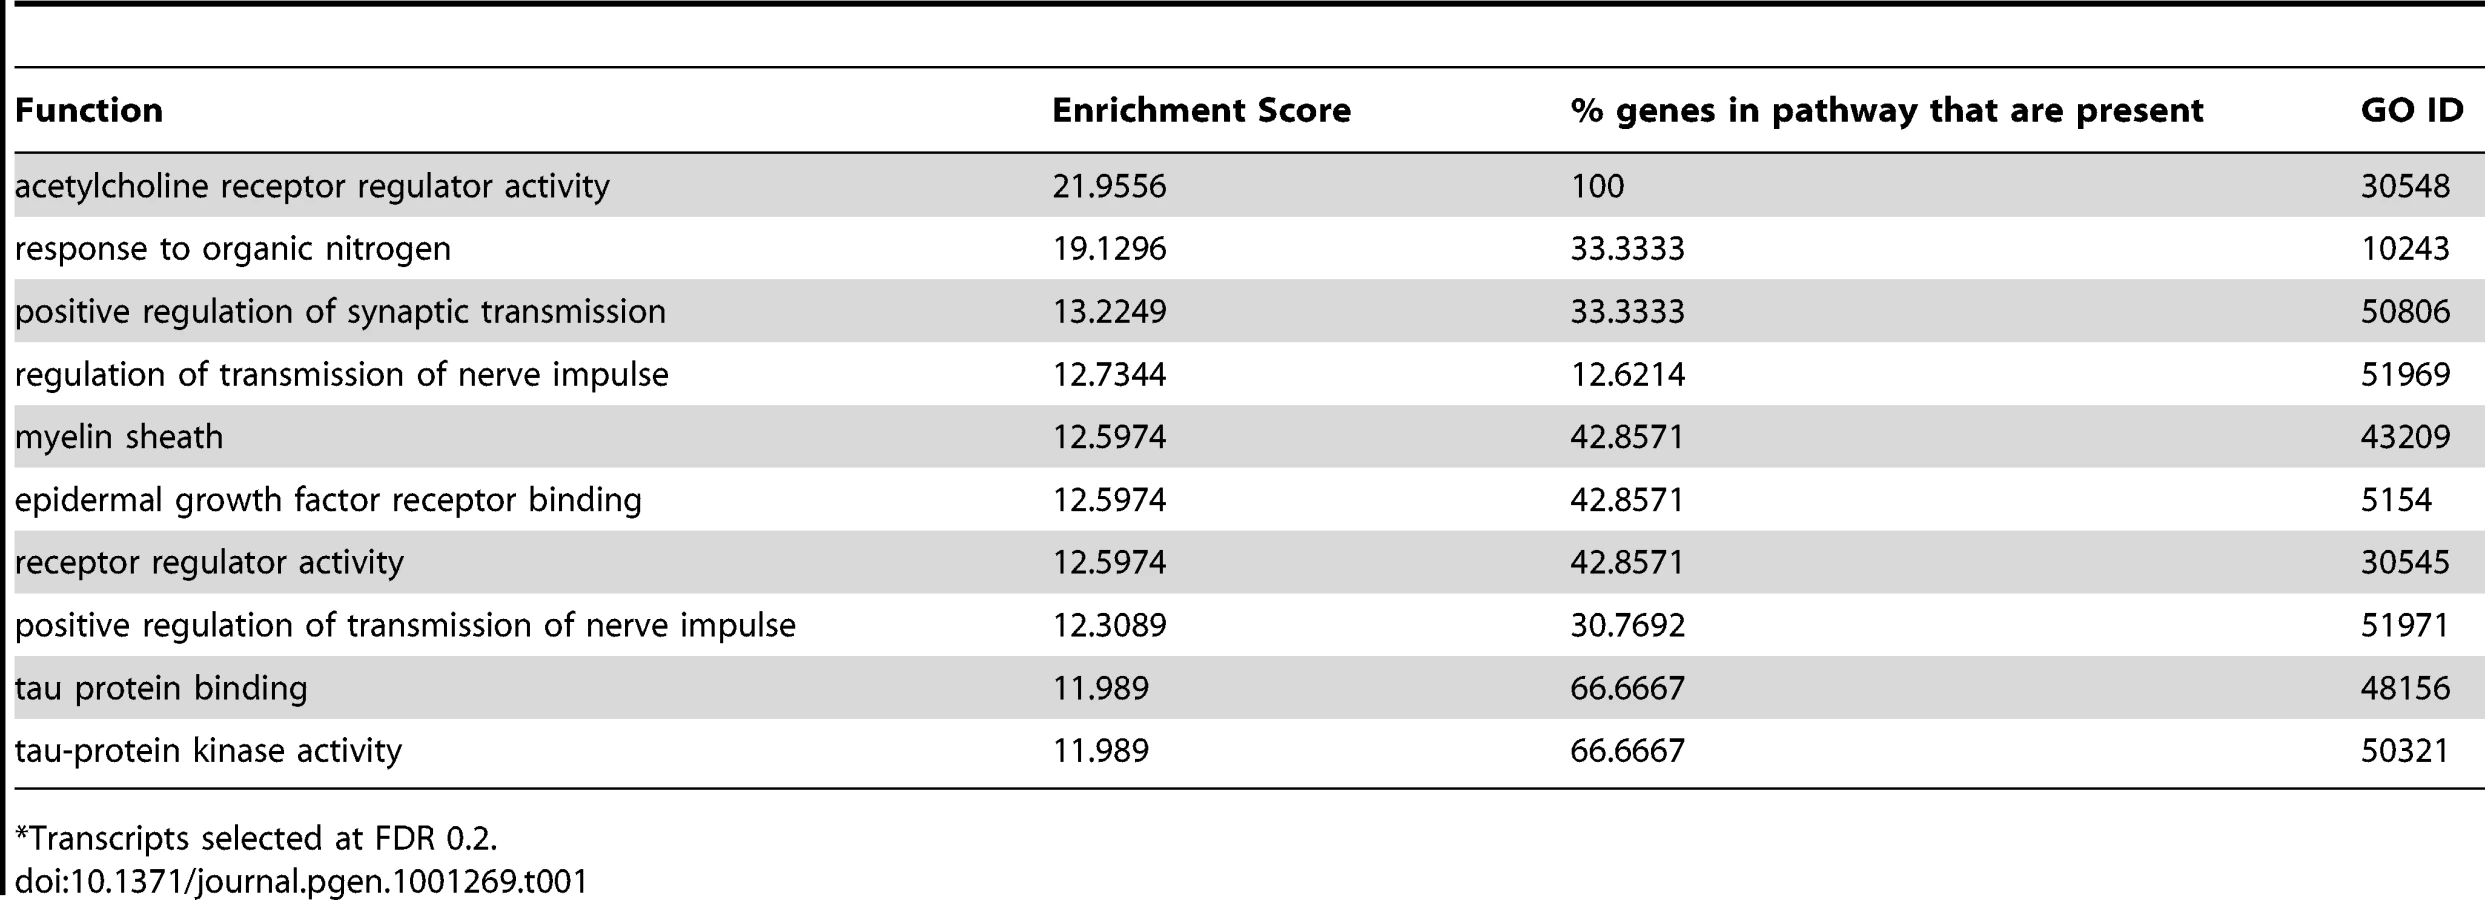
Gene ontology analysis revealed that myelin components were significantly enriched, as predicted from the role of QK in myelination (Table 1). Furthermore, the top ten decreasing transcripts include two myelin components, Mbp and Plp1 (Figure 7B). Other enriched categories include epidermal growth factor and acetylcholine receptor activities and tau protein function, suggesting a widespread disruption of processes that promote myelination. Epidermal growth factor receptor activity has been shown to promote myelination in the mouse, while acetylcholine receptor activity promotes oligodendrocyte survival [37], [38]. The tau pathway has been linked to oligodendrocyte process formation [39].
A subset of QK targets are co-regulated by hnRNP A1
We next wished to compare the effects of reducing hnRNP A1 with the effects of reducing QK genome-wide. We identified probesets with a significant change in expression upon QK knockdown using an FDR set at 0.1 (step up, p-value 0.00012). Hierarchical clustering (Pearson's dissimilarity, centroid method) demonstrated that the probeset expression changes in Hnrnpa1 siRNA treated cells clustered closely to those in Qk siRNA treated cells (correlation coefficient 0.81) (Figure 7C). Qk shRNA and Qk siRNA also clustered closely, as one would predict (correlation coefficient 0.91) (Figure 7C). The correlation between expression changes in the Hnrnpa1 siRNA and Qk knockdown groups was independent of the False Discovery Rate (Figure S5). The data indicate that there is similarity in the probeset level changes in gene expression between the Qk knockdown and Hnrnpa1 knockdown samples genome-wide.
We repeated our analysis at the whole transcript level, selecting transcripts regulated by QK (FDR 0.1) and performing the same analysis as for probesets. Again, there is a strong correlation at the whole transcript level between expression changes in the Hnrnpa1 siRNA and the Qk siRNA samples (Pearson's correlation coefficient 0.83) (Figure S6). This correlation is of a similar magnitude to the correlation we observe between Qk shRNA and Qk siRNA (Pearson's correlation coefficient 0.88). These data suggest that QK and hnRNP A1 exert similar pressures on gene expression and alternative splicing on a genome-wide scale in oligodendrocyte precursors.
hnRNP A1 motifs are enriched in QK-responsive exons
hnRNP A1 is a sequence-specific RNA binding protein that regulates the isoform ratio of transcripts that contain a binding site in or near exons that are alternatively spliced [40]–[42]. It binds to several sequence variants, including the SELEX-derived UAGGG(A/U) as well as UAGGU and related sequences [43], [44]. Our observation that QK regulates Hnrnpa1 expression predicts that hnRNP A1 binding sites will be present in the vicinity of QK-responsive exons.
In order to obtain a set of exons predicted to be alternatively spliced upon Hnrnpa1 or Qk knockdown, we re-analyzed our microarray data using AltAnalyzer [45] and the full Affymetrix probeset annotation. The analysis identified both upregulated and downregulated exons in both data sets. For Qk knockdown CG-4 cells, 78 exons were downregulated and 219 were upregulated, and for Hnrnpa1 knockdown cells, 93 exons were downregulated 70 were upregulated.
To identify enriched motifs, we determined the frequency of all 5mers contained in the sequences of regulated exons relative to their frequency in all annotated rat exons (Table S2). To assess statistical significance, we also determined the 5mer frequency from ten sets of an equivalent number of randomly selected exons. Significantly changed 5mers were identified based upon criteria of a greater than 1.5 fold enrichment and a p-value of less than 0.05 when compared to the randomly selected exon set (Table S2). We found a significant enrichment over random of 42 5mers in QK upregulated exons, including the hnRNP A1 motif TAGGT (fold enrichment FE = 1.54, p = 5×10⁻³) and the QSBE motif ACUAA (FE = 1.54, p = 8×10⁻⁷, Figure 8A). The A1 motif is similar to an exonic splicing silencer motif identified by Burge and co-workers [46]. There are 149 significant enriched 5mers in QK downregulated exons. These include the hnRNP A1 motif TAGGT (FE = 1.94, p = 3×10⁻³), but not the QSBE ACUAA motif. While this motif is enriched relative to all exons, the average of the randomly selected exons also yields a significantly changed p-value. As expected, hnRNP A1 motifs were also enriched in the hnRNP A1 knockdown cells (Figure 8A: upregulated exons; TAGGT, FE = 2.32, p = 4×10⁻⁶; downregulated exons: TAGGT, FE = 2.2, p = 4×10⁻⁴; TAGGG, FE = 2.5, p = 1.7×10⁻⁵). The enrichment of the hnRNP A1 motif in QK-responsive exons suggests that many but not all QK-dependent alternative splicing events are mediated indirectly by hnRNP A1. The enrichment of the QK motif is consistent with a direct role for QK in the regulation of some alternative splicing events.

Discussion
The RNA binding protein QK controls myelination by governing the stability, subcellular localization, and alternative splicing of a specific set of myelin-related mRNAs. Relatively few direct QK targets have been characterized, and the mechanism by which QK regulates such diverse processes is unclear. Here, we show that the QSBE sequence—the primary determinant for high affinity QK binding—is required for regulation of Mbp mRNA. Moreover, we show that QK directly regulates the transcript encoding the splicing factor Hnrnpa1 through a conserved QSBE in its 3′ UTR. The strong correlation between the changes in transcript and probeset abundance upon Qk or Hnrnpa1 knockdown is consistent with a vertical regulatory relationship and suggests that hnRNP A1 is a primary effector of QK function.
The reporter data reveal that QK has two opposing effects on Mbp and Hnrnpa1 expression, positively regulating mRNA abundance while negatively regulating translational efficiency. The mode of regulation is consistent with a model where QK stores its targets in a translationally quiescent but stable complex. Such a regulatory scheme would enable a transient burst of translation in response to a signal that releases QK from its targets, such as phosphorylation. Consistent with this hypothesis, Feng and co-workers have shown that QK activity is regulated by tyrosine phosphorylation and that the level of phosphorylation is modulated during myelination [47].
The microarray analysis described herein delineates the set of transcripts controlled by QK in the CG-4 oligodendrocyte precursor cell line. The most dramatically changed transcript is the previously characterized QK target Mbp [10], [13]. We have also observed striking changes in the expression of several other important myelin genes, suggesting that QK has broad control of transcripts important for myelination. For example, Cnp1 has been implicated in maintaining the integrity of myelinated axons [1]. Fyn stimulates Mbp transcription, suggesting control of Mbp expression by QK is both direct and indirect [48]. Finally, UDP glycosyltransferase 8 (Ugt8) produces myelin sphingolipids, suggesting that QK controls synthesis of the lipid components of myelin as well.
Several labs have demonstrated that hnRNP A1 is a post-transcriptional regulator of gene expression. hnRNP A1 represses alternative splicing when associated with silencing elements near spice sites [40]–[42]. Additional functions have also been proposed. hnRNP A1 also binds to telomeric DNA, where it is thought to promote telomere elongation [49]. Furthermore, hnRNP A1 is implicated in the Drosha-mediated processing of a primary microRNA [50], [51]. It will be interesting to determine whether the effects of QK on gene expression in oligodendrocyte precursors are mediated by hnRNP A1 through any of these mechanisms.
The data also have implications for the mechanism by which hnRNP A1 regulates Mag alternative splicing. An hnRNP A1 motif is present in Mag intron 12 immediately downstream of the 5′-splice site (Figure 8B), suggesting a model in which binding of hnRNP A1 to this motif blocks 5′-splice site recognition, promoting skipping of exon 12. Consistent with this model, our data and the work of others show that reduction of QK or hnRNP A1 increases MAG exon 12 inclusion [14]. Moreover, a point mutation in this hnRNP A1 binding motif has been shown to cause constitutive exon 12 inclusion [14], although we note that this mutation also strengthens the 5′-splice site consensus, which confounds a simple interpretation of this result.
The microarray analysis suggests that some of the effects of QK on splicing may be indirect. In line with these observations, screening the 3′ UTRs of the QK responsive transcripts using the sequence analysis tool Patscan [52] reveals that under a third contain the sequence element required for QK binding (Table S3). Together, these observations suggest numerous indirect changes in gene expression caused by QK depletion. Consistent with this hypothesis, we observe enrichment of 5mer motifs that do not correspond to QK or hnRNP A1 binding motifs in QK-responsive exons (Table S2). These may represent binding sites for other RNA regulators.
Understanding how QK controls its network of transcripts will require a detailed analysis of directly bound QK targets in oligodendrocyte lineage cells. Use of the cross-linked immunoprecipitation technique [53]–[56] should greatly facilitate such an analysis. A recent study used a variant of the technique, in which chemically modified nucleotides were incorporated into mRNAs in HEK293 cells overexpressing QK to enhance crosslinking [27]. Despite the fact that the mRNAs expressed in HEK293 are likely to be substantially different from those expressed in oligodendrocyte lineage cells, 20% of the transcripts identified in our microarray analysis are present the list of crosslinked transcripts, more than the 11–13% overlap when the list of transcripts crosslinked to Pumilio 2 or TNRC6 are analyzed as controls.
Numerous studies have implicated QKI and other myelin genes in SCZ. Thirty-eight genes that have been implicated in SCZ [57] are affected by Qk knockdown, including CNP, MBP, PLP1, and OMG (Table S4). Additionally, SCZ brains have similar splicing defects to those observed in association with Qk knockdown, including changes in MAG, NCAM, and ERBB4 [16], [21], [58]. Thus, the changes in gene expression observed by microarray analysis may provide a link between QKI function and disease.
Gene dosage effects have been implicated in many other human diseases. For example, Pelizaeus-Merzbacher disease is associated with PLP1 duplication [59]. Intriguingly, copy number variation has been linked to schizophrenia, Charcot-Marie-Tooth disease, and autism, suggesting that small variations in the dosage of important myelin related genes can have significant clinical outcome [60]–[62].
In summary, we have identified a new direct QK target, the Hnrnpa1 transcript, in oligodendrocyte lineage cells. Additionally, we have identified the set of transcripts directly or indirectly controlled by QK and have shown that hnRNP A1 co-regulates part of this set. The results suggest that the importance of QK for myelin formation lies not only in the identity of major direct targets, but also in the network of secondary targets under QK control. They also demonstrate that QK is a prime regulatory factor controlling gene expression in oligodendrocyte precursors and that hnRNP A1 is a large contributor to its effects on alternative splicing.
Materials and Methods
Ethics statement
Brain tissue was harvested from mice in accordance with protocols approved by the University of Massachusetts Medical School Institutional Animal Care and Use Committee. The animal care program complies with Federal and State laws and the PHS policy on Humane Care and Use of Laboratory Animals. The experiments were designed in order to minimize the number of animals used.
Cell culture and transfections
The CG-4 rat oligodendrocyte precursor and B104 cell lines were a gift from Lynne Hudson and were cultured according to Louis et al. [29]. CG-4 cells were maintained as undifferentiated progenitors in the presence of 30% B104 conditioned medium for the duration of the assays except as noted otherwise. Cells were transfected with Lipofectamine 2000 (Invitrogen) according to instructions from the manufacturer. Where indicated, 24 hours after transfection, transfected CG-4 cells were selected by incubation with 1500 ng/µl G418 (Geneticin, Invitrogen) for 48 to 72 hours.
To generate stable cell lines, cells were transfected as above with the indicated shRNAmiR constructs (Open Biosystems). After 24 hours, cells were trypsinized and plated sparsely on 150 mm plates in the presence of 2 ng/µl puromycin. Cells were allowed to proliferate for approximately two weeks, until colonies had formed. Colonies were picked and transferred into 24 well plates to proliferate.
Plasmids and siRNAs
The Hnrnpa1 3′ UTR (RefSeq NM_0104447) was cloned into the phrGFPII-I plasmid (Strategene) after PCR amplification from an Hnrnpa1 full length I.M.A.G.E. clone (Invitrogen). The T to G mutation in the QSBE was introduced by QuikChange site directed mutagenesis (Stratagene). Sequences of all constructs were confirmed by sequencing. tdTomato was provided by Roger Tsien and colleagues [63]. To generate a construct for expressing tdTomato in mammalian cells, the tdTomato coding sequence was excised from the original plasmid and cloned into the pcDNA 3.1+ expression vector (Invitrogen). The vector psiCheck 2 was a gift from Phil Zamore. The Hnrnpa1 wild type and mutant UTRs were cloned from the GFP expression vectors into psiCheck2.
Qk siRNA1, Hnrnpa1 siRNA, and the non-targeting control siRNA were commercially designed (Ambion). The Qk pGIPZ shRNAmiR (Open Biosystems) was obtained from the University of Massachusetts RNAi core facility.
Reporter assays
For the fluorescent reporters, CG-4 cells were seeded onto the surface of a 24 well plate and, after 24 hours, transfected with 0.6 µg of the plasmid encoding GFP with or without a UTR of interest and 0.1 µg of the tdTomato control plasmid using Lipofectamine 2000 (Invitrogen). Complexes were formed in medium without antibiotic or other supplements. Transfections were done in DMEM containing N1 supplements, biotin, insulin, L-glutamine, but without antibiotic or B104 conditioned medium. After 24–48 hours of incubation at 37°C, the plate was read using a Victor3 plate reader (Perkin Elmer). GFP was excited using a 485 nm filter and detected through a 519/20 filter. tdTomato was excited using a 531/25 nm filter and detected through a 580/10 filter. All filters were purchased from Chroma. Each well was read 25 times, in a 5 by 5 grid with 0.1 mm spacing between the spots. The well average was computed from these 25 spots. GFP fluorescence was divided by tdTomato fluorescence to control for transfection efficiency and cell density. Three or four independently transfected wells were averaged for each experiment and the standard deviation was calculated.
For the luciferase reporters, cells were transfected as above with the plasmid psiCheck2 (Promega) or a cloned psiCheck2 variant with the hnRNP A1 wild type or T to G mutant 3′ UTR cloned behind Renilla. 24–48 hours after transfection, cells were lysed in 150 µl of lysis buffer per well and dual luciferase assays were conducted using the Dual Luciferase Assay System (Promega) according to the manufacturer's instructions.
RNA binding assays
For the gel shift assays, recombinant QK was purified as previously described [25]. RNA gel shifts and fluorescence polarization assays were performed according to [64], with the exception that electrophoresis was carried out in a non-denaturing 5% polyacrylamide slab gel in 1xTBE buffer. RNA co-IPs from uncrosslinked lysates were conducted according to Tenenbaum et al. [65], using brains from C57BL/6 mice. Formaldehyde crosslinking of mouse brain tissue and immunoprecipitation from crosslinked lysate was conducted as described in [66]. After cross-link reversal, RNA was extracted with Trizol reagent according to the manufacturer's instructions, the purified RNA was treated with DNase (Ambion Turbo DNAfree), and co-precipitated RNA was amplified by one step RT-PCR (Invitrogen) with transcript specific primers. Antibodies to QK (Bethyl labs) and 6xHisG (Invitrogen) were commercially obtained. PCR primers were fluorescently labeled at the 5′ end unless otherwise noted. After separating the PCR product from free primers by agarose gel electrophoresis, gels were imaged on a Fuji FLA-5000 using a blue laser.
Quantitative PCR
RNA was extracted from cultured cells with Trizol Reagent (Invitrogen) and treated with Turbo DNAfree (Ambion) or RQ1 DNase (Promega) according to the provided instructions. The yield was determined by spectrophotometry. Real time RT-PCR was performed using a one-step RT-PCR kit (Qiagen or Bio-Rad) according to the manufacturer's instructions and cycled on an Opticon thermal cycler (Bio-Rad). All assays were performed in triplicate. For each target the presence of a single product after cycling was confirmed by agarose gel electrophoresis. Data were analyzed by comparison to a 5-point standard curve constructed at the time of cycling or according to the method of Rutledge [67]. GAPDH or tubulin and tdTomato were used for normalization as indicated in the figure legends.
Splicing assays
CG-4 cells were transfected as for the dual color fluorescence reporter assay, using 20 nM siRNA and 0.3 µg GFP-selection plasmid per well. After 24 hours, the medium was replaced with 30% B104 conditioned medium containing 1500 ng/µl Geneticin (Invitrogen). Cells were incubated in the selection medium for 48 hours, then washed two times with PBS. RNA was isolated with Trizol (Invitrogen). PCR was conducted with 5′ fluorescein labeled primers and the products were isolated on a non-denaturing 5% polyacrylamide gel. Gels were imaged on a Fuji FLA-5000 imager using a blue laser. Band intensity in each lane was quantified using ImageGauge profile analysis.
Microarrays
CG-4 cells were grown and transfected as described above. RNA was extracted in Trizol (Invitrogen). RNA was further purified and genomic DNA was eliminated using the RNEasy Plus mini kit (Qiagen). Knockdown of Qk or Hnrnpa1 was verified by quantitative RT-PCR. Rat Exon 1.0 ST microarrays were obtained from Affymetrix. Three independent biological replicates were assayed per group. Sample labeling and array hybridization were conducted by the University of Massachusetts Genomics Core Facility according to Affymetrix procedures. Data were analyzed with Partek GS, using the Affymetrix extended probeset annotation with a GC background correction RMA algorithm. Differentially expressed mRNAs and probesets were identified using a two-sample t-test, with an FDR of 0.1 unless otherwise noted. For analysis of the Hnrnpa1 knockdown groups, probesets and transcripts that significantly changed in response to QK depletion were selected, then the changes in expression in response to hnRNP A1 depletion were clustered alongside the other control and experimental groups.
Statistical analyses
All assays were performed in triplicate unless otherwise indicated. Error bars represent the standard deviation of the experimental replicates. P-values were calculated from a two-sample t-test assuming unequal variance. Errors were propagated from the individual standard deviations according to the formula ΔZ = Z(SQRT(((ΔA/A)∧2)+((ΔB/B)∧2))) where Z = A/B.
5mer enrichment analysis
The sequences of regulated exons were obtained from Affymetrix. Exons from all rat genes were obtained from the UCSC genome browser. The frequency of 5mers in each exon was determined using Perl scripts. Random sets of exons were selected using Perl scripts. The average and standard deviation of 5mer frequency were calculated for the random sets of exons to obtain a p-value for fold enrichment significance.
Supporting Information
Zdroje
1. Lappe-SiefkeC
GoebbelsS
GravelM
NickschE
LeeJ
2003 Disruption of Cnp1 uncouples oligodendroglial functions in axonal support and myelination. Nat Genet 33 366 374
2. GriffithsI
KlugmannM
AndersonT
YoolD
ThomsonC
1998 Axonal swellings and degeneration in mice lacking the major proteolipid of myelin. Science 280 1610 1613
3. LiC
TropakMB
GerlaiR
ClapoffS
Abramow-NewerlyW
1994 Myelination in the absence of myelin-associated glycoprotein. Nature 369 747 750
4. VernetC
ArtztK
1997 STAR, a gene family involved in signal transduction and activation of RNA. Trends Genet 13 479 484
5. SidmanRL
DickieMM
AppelSH
1964 Mutant Mice (Quaking and Jimpy) with Deficient Myelination in the Central Nervous System. Science 144 309 311
6. EbersoleT
RhoO
ArtztK
1992 The proximal end of mouse chromosome 17: new molecular markers identify a deletion associated with quakingviable. Genetics 131 183 190
7. HardyRJ
LoushinCL
FriedrichVLJr
ChenQ
EbersoleTA
1996 Neural cell type-specific expression of QKI proteins is altered in quakingviable mutant mice. J Neurosci 16 7941 7949
8. ZhaoL
TianD
XiaM
MacklinWB
FengY
2006 Rescuing qkV dysmyelination by a single isoform of the selective RNA-binding protein QKI. J Neurosci 26 11278 11286
9. NoveroskeJK
HardyR
DapperJD
VogelH
JusticeMJ
2005 A new ENU-induced allele of mouse quaking causes severe CNS dysmyelination. Mamm Genome 16 672 682
10. LiZ
ZhangY
LiD
FengY
2000 Destabilization and mislocalization of myelin basic protein mRNAs in quaking dysmyelination lacking the QKI RNA-binding proteins. J Neurosci 20 4944 4953
11. ZhaoL
KuL
ChenY
XiaM
LoPrestiP
2006 QKI binds MAP1B mRNA and enhances MAP1B expression during oligodendrocyte development. Mol Biol Cell 17 4179 4186
12. LarocqueD
GalarneauA
LiuHN
ScottM
AlmazanG
2005 Protection of p27(Kip1) mRNA by quaking RNA binding proteins promotes oligodendrocyte differentiation. Nat Neurosci 8 27 33
13. LarocqueD
PilotteJ
ChenT
CloutierF
MassieB
2002 Nuclear retention of MBP mRNAs in the quaking viable mice. Neuron 36 815 829
14. WuJI
ReedRB
GrabowskiPJ
ArtztK
2002 Function of quaking in myelination: regulation of alternative splicing. Proc Natl Acad Sci U S A 99 4233 4238
15. AbergK
SaetreP
LindholmE
EkholmB
PetterssonU
2006 Human QKI, a new candidate gene for schizophrenia involved in myelination. Am J Med Genet B Neuropsychiatr Genet 141 84 90
16. AbergK
SaetreP
JareborgN
JazinE
2006 Human QKI, a potential regulator of mRNA expression of human oligodendrocyte-related genes involved in schizophrenia. Proc Natl Acad Sci U S A 103 7482 7487
17. McCullumsmithRE
GuptaD
BeneytoM
KregerE
HaroutunianV
2007 Expression of transcripts for myelination-related genes in the anterior cingulate cortex in schizophrenia. Schizophr Res 90 15 27
18. HaroutunianV
KatselP
DrachevaS
DavisKL
2006 The human homolog of the QKI gene affected in the severe dysmyelination “quaking” mouse phenotype: downregulated in multiple brain regions in schizophrenia. Am J Psychiatry 163 1834 1837
19. DrachevaS
ElhakemSL
MarcusSM
SieverLJ
McGurkSR
2003 RNA editing and alternative splicing of human serotonin 2C receptor in schizophrenia. J Neurochem 87 1402 1412
20. DrachevaS
DavisKL
ChinB
WooDA
SchmeidlerJ
2006 Myelin-associated mRNA and protein expression deficits in the anterior cingulate cortex and hippocampus in elderly schizophrenia patients. Neurobiol Dis 21 531 540
21. LawAJ
KleinmanJE
WeinbergerDR
WeickertCS
2007 Disease-associated intronic variants in the ErbB4 gene are related to altered ErbB4 splice-variant expression in the brain in schizophrenia. Hum Mol Genet 16 129 141
22. SchmaussC
1996 Enhanced cleavage of an atypical intron of dopamine D3-receptor pre-mRNA in chronic schizophrenia. J Neurosci 16 7902 7909
23. KlempanTA
ErnstC
DelevaV
LabonteB
TureckiG
2009 Characterization of QKI gene expression, genetics, and epigenetics in suicide victims with major depressive disorder. Biol Psychiatry 66 824 831
24. BackxL
FrynsJP
MarcelisC
DevriendtK
VermeeschJ
2010 Haploinsufficiency of the gene Quaking (QKI) is associated with the 6q terminal deletion syndrome. Am J Med Genet A 152A 319 326
25. RyderSP
WilliamsonJR
2004 Specificity of the STAR/GSG domain protein Qk1: implications for the regulation of myelination. Rna 10 1449 1458
26. GalarneauA
RichardS
2005 Target RNA motif and target mRNAs of the Quaking STAR protein. Nat Struct Mol Biol 12 691 698
27. HafnerM
LandthalerM
BurgerL
KhorshidM
HausserJ
2010 Transcriptome-wide identification of RNA-binding protein and microRNA target sites by PAR-CLIP. Cell 141 129 141
28. ZearfossNR
FarleyBM
RyderSP
2008 Post-transcriptional regulation of myelin formation. Biochim Biophys Acta 1779 486 494
29. LouisJC
MagalE
MuirD
ManthorpeM
VaronS
1992 CG-4, a new bipotential glial cell line from rat brain, is capable of differentiating in vitro into either mature oligodendrocytes or type-2 astrocytes. J Neurosci Res 31 193 204
30. EbersoleTA
ChenQ
JusticeMJ
ArtztK
1996 The quaking gene product necessary in embryogenesis and myelination combines features of RNA binding and signal transduction proteins. Nat Genet 12 260 265
31. LiZ
TakakuraN
OikeY
ImanakaT
ArakiK
2003 Defective smooth muscle development in qkI-deficient mice. Dev Growth Differ 45 449 462
32. VasudevanS
SteitzJA
2007 AU-rich-element-mediated upregulation of translation by FXR1 and Argonaute 2. Cell 128 1105 1118
33. WangE
DimovaN
CambiF
2007 PLP/DM20 ratio is regulated by hnRNPH and F and a novel G-rich enhancer in oligodendrocytes. Nucleic Acids Res 35 4164 4178
34. WangE
HuangZ
HobsonGM
DimovaN
SperleK
2006 PLP1 alternative splicing in differentiating oligodendrocytes: characterization of an exonic splicing enhancer. J Cell Biochem 97 999 1016
35. MiliS
SteitzJA
2004 Evidence for reassociation of RNA-binding proteins after cell lysis: implications for the interpretation of immunoprecipitation analyses. Rna 10 1692 1694
36. HutchisonS
LeBelC
BlanchetteM
ChabotB
2002 Distinct sets of adjacent heterogeneous nuclear ribonucleoprotein (hnRNP) A1/A2 binding sites control 5′ splice site selection in the hnRNP A1 mRNA precursor. J Biol Chem 277 29745 29752
37. AguirreA
DupreeJL
ManginJM
GalloV
2007 A functional role for EGFR signaling in myelination and remyelination. Nat Neurosci 10 990 1002
38. CuiQL
FogleE
AlmazanG
2006 Muscarinic acetylcholine receptors mediate oligodendrocyte progenitor survival through Src-like tyrosine kinases and PI3K/Akt pathways. Neurochem Int 48 383 393
39. GordonD
KiddGJ
SmithR
2008 Antisense suppression of tau in cultured rat oligodendrocytes inhibits process formation. J Neurosci Res 86 2591 2601
40. MayedaA
KrainerAR
1992 Regulation of alternative pre-mRNA splicing by hnRNP A1 and splicing factor SF2. Cell 68 365 375
41. CaceresJF
StammS
HelfmanDM
KrainerAR
1994 Regulation of alternative splicing in vivo by overexpression of antagonistic splicing factors. Science 265 1706 1709
42. YangX
BaniMR
LuSJ
RowanS
Ben-DavidY
1994 The A1 and A1B proteins of heterogeneous nuclear ribonucleoparticles modulate 5′ splice site selection in vivo. Proc Natl Acad Sci U S A 91 6924 6928
43. BurdCG
DreyfussG
1994 RNA binding specificity of hnRNP A1: significance of hnRNP A1 high-affinity binding sites in pre-mRNA splicing. Embo J 13 1197 1204
44. HanK
YeoG
AnP
BurgeCB
GrabowskiPJ
2005 A combinatorial code for splicing silencing: UAGG and GGGG motifs. PLoS Biol 3 e158 doi:10.1371/journal.pbio.0030158
45. EmigD
SalomonisN
BaumbachJ
LengauerT
ConklinBR
2010 AltAnalyze and DomainGraph: analyzing and visualizing exon expression data. Nucleic Acids Res 38 Suppl W755 762
46. WangZ
RolishME
YeoG
TungV
MawsonM
2004 Systematic identification and analysis of exonic splicing silencers. Cell 119 831 845
47. ZhangY
LuZ
KuL
ChenY
WangH
2003 Tyrosine phosphorylation of QKI mediates developmental signals to regulate mRNA metabolism. Embo J 22 1801 1810
48. UmemoriH
KadowakiY
HirosawaK
YoshidaY
HironakaK
1999 Stimulation of myelin basic protein gene transcription by Fyn tyrosine kinase for myelination. J Neurosci 19 1393 1397
49. ZhangQS
MancheL
XuRM
KrainerAR
2006 hnRNP A1 associates with telomere ends and stimulates telomerase activity. Rna 12 1116 1128
50. GuilS
CaceresJF
2007 The multifunctional RNA-binding protein hnRNP A1 is required for processing fo miR-18a. Nature Structural and Molecular Biology 14 591 596
51. MichlewskiG
GuilS
SempleCA
CaceresJF
2008 Posttranscriptional regulation of miRNAs harboring conserved terminal loops. Mol Cell 32 383 393
52. DsouzaM
LarsenN
OverbeekR
1997 Searching for patterns in genomic data. Trends Genet 13 497 498
53. UleJ
JensenKB
RuggiuM
MeleA
UleA
2003 CLIP identifies Nova-regulated RNA networks in the brain. Science 302 1212 1215
54. UleJ
JensenK
MeleA
DarnellRB
2005 CLIP: a method for identifying protein-RNA interaction sites in living cells. Methods 37 376 386
55. LicatalosiDD
MeleA
FakJJ
UleJ
KayikciM
2008 HITS-CLIP yields genome-wide insights into brain alternative RNA processing. Nature 456 464 469
56. JensenKB
DarnellRB
2008 CLIP: crosslinking and immunoprecipitation of in vivo RNA targets of RNA-binding proteins. Methods Mol Biol 488 85 98
57. AllenNC
BagadeS
McQueenMB
IoannidisJP
KavvouraFK
2008 Systematic meta-analyses and field synopsis of genetic association studies in schizophrenia: the SzGene database. Nat Genet 40 827 834
58. AtzME
RollinsB
VawterMP
2007 NCAM1 association study of bipolar disorder and schizophrenia: polymorphisms and alternatively spliced isoforms lead to similarities and differences. Psychiatr Genet 17 55 67
59. InoueK
OsakaH
SugiyamaN
KawanishiC
OnishiH
1996 A duplicated PLP gene causing Pelizaeus-Merzbacher disease detected by comparative multiplex PCR. Am J Hum Genet 59 32 39
60. StefanssonH
RujescuD
CichonS
PietilainenOP
IngasonA
2008 Large recurrent microdeletions associated with schizophrenia. Nature 455 232 236
61. McCarthySE
MakarovV
KirovG
AddingtonAM
McClellanJ
2009 Microduplications of 16p11.2 are associated with schizophrenia. Nat Genet 41 1223 1227
62. ZhangF
SeemanP
LiuP
WetermanMA
Gonzaga-JaureguiC
2010 Mechanisms for nonrecurrent genomic rearrangements associated with CMT1A or HNPP: rare CNVs as a cause for missing heritability. Am J Hum Genet 86 892 903
63. ShanerNC
CampbellRE
SteinbachPA
GiepmansBN
PalmerAE
2004 Improved monomeric red, orange and yellow fluorescent proteins derived from Discosoma sp. red fluorescent protein. Nat Biotechnol 22 1567 1572
64. PaganoJM
FarleyBM
McCoigLM
RyderSP
2007 Molecular basis of RNA recognition by the embryonic polarity determinant MEX-5. J Biol Chem 282 8883 8894
65. TenenbaumSA
LagerPJ
CarsonCC
KeeneJD
2002 Ribonomics: identifying mRNA subsets in mRNP complexes using antibodies to RNA-binding proteins and genomic arrays. Methods 26 191 198
66. Chen-PlotkinAS
Sadri-VakiliG
YohrlingGJ
BravemanMW
BennCL
2006 Decreased association of the transcription factor Sp1 with genes downregulated in Huntington's disease. Neurobiol Dis 22 233 241
67. RutledgeRG
2004 Sigmoidal curve-fitting redefines quantitative real-time PCR with the prospective of developing automated high-throughput applications. Nucleic Acids Res 32 e178
Štítky
Genetika Reprodukční medicínaČlánek vyšel v časopise
PLOS Genetics
2011 Číslo 1
Nejčtenější v tomto čísle
- H3K9me-Independent Gene Silencing in Fission Yeast Heterochromatin by Clr5 and Histone Deacetylases
- Evolutionary Conserved Regulation of HIF-1β by NF-κB
- Rnf12—A Jack of All Trades in X Inactivation?
- Joint Genetic Analysis of Gene Expression Data with Inferred Cellular Phenotypes