
Proteins Encoded in Genomic Regions Associated with Immune-Mediated Disease Physically Interact and Suggest Underlying Biology
Genome-wide association studies (GWAS) have defined over 150 genomic regions unequivocally containing variation predisposing to immune-mediated disease. Inferring disease biology from these observations, however, hinges on our ability to discover the molecular processes being perturbed by these risk variants. It has previously been observed that different genes harboring causal mutations for the same Mendelian disease often physically interact. We sought to evaluate the degree to which this is true of genes within strongly associated loci in complex disease. Using sets of loci defined in rheumatoid arthritis (RA) and Crohn's disease (CD) GWAS, we build protein–protein interaction (PPI) networks for genes within associated loci and find abundant physical interactions between protein products of associated genes. We apply multiple permutation approaches to show that these networks are more densely connected than chance expectation. To confirm biological relevance, we show that the components of the networks tend to be expressed in similar tissues relevant to the phenotypes in question, suggesting the network indicates common underlying processes perturbed by risk loci. Furthermore, we show that the RA and CD networks have predictive power by demonstrating that proteins in these networks, not encoded in the confirmed list of disease associated loci, are significantly enriched for association to the phenotypes in question in extended GWAS analysis. Finally, we test our method in 3 non-immune traits to assess its applicability to complex traits in general. We find that genes in loci associated to height and lipid levels assemble into significantly connected networks but did not detect excess connectivity among Type 2 Diabetes (T2D) loci beyond chance. Taken together, our results constitute evidence that, for many of the complex diseases studied here, common genetic associations implicate regions encoding proteins that physically interact in a preferential manner, in line with observations in Mendelian disease.
Published in the journal:
. PLoS Genet 7(1): e32767. doi:10.1371/journal.pgen.1001273
Category:
Research Article
doi:
https://doi.org/10.1371/journal.pgen.1001273
Summary
Genome-wide association studies (GWAS) have defined over 150 genomic regions unequivocally containing variation predisposing to immune-mediated disease. Inferring disease biology from these observations, however, hinges on our ability to discover the molecular processes being perturbed by these risk variants. It has previously been observed that different genes harboring causal mutations for the same Mendelian disease often physically interact. We sought to evaluate the degree to which this is true of genes within strongly associated loci in complex disease. Using sets of loci defined in rheumatoid arthritis (RA) and Crohn's disease (CD) GWAS, we build protein–protein interaction (PPI) networks for genes within associated loci and find abundant physical interactions between protein products of associated genes. We apply multiple permutation approaches to show that these networks are more densely connected than chance expectation. To confirm biological relevance, we show that the components of the networks tend to be expressed in similar tissues relevant to the phenotypes in question, suggesting the network indicates common underlying processes perturbed by risk loci. Furthermore, we show that the RA and CD networks have predictive power by demonstrating that proteins in these networks, not encoded in the confirmed list of disease associated loci, are significantly enriched for association to the phenotypes in question in extended GWAS analysis. Finally, we test our method in 3 non-immune traits to assess its applicability to complex traits in general. We find that genes in loci associated to height and lipid levels assemble into significantly connected networks but did not detect excess connectivity among Type 2 Diabetes (T2D) loci beyond chance. Taken together, our results constitute evidence that, for many of the complex diseases studied here, common genetic associations implicate regions encoding proteins that physically interact in a preferential manner, in line with observations in Mendelian disease.
Introduction
Common genetic variants in over 150 genomic loci have now been unequivocally associated to immune-mediated diseases by genome-wide association studies (GWAS) [1]–[18]. It is presumed that these associations represent perturbations to a common but limited set of underlying molecular processes that modulate risk to disease. The next challenge – and the great promise of human genetics – is the identification of these disease-causing pathways so they may be targeted for diagnostics and therapeutic intervention.
In identifying such processes, there are difficulties in both (i) identifying the specific genes at (and how they are molecularly impacted by) each association and (ii) inferring disease-causing mechanisms from the set of identified genes. Linkage disequilibrium blocks containing disease-associated SNPs can be hundreds of kilobases in size, and some contain tens of genes to consider. Genes are often informally implicated in pathogenesis by their proximity to the most associated marker, their biological plausibility, or simply their being the only protein-coding gene in the region. In reality, however, it is only a very small subset of confirmed GWAS associations for which specific functional variants have been proven experimentally.
More systematic approaches have been applied to connect genes to a common process with the use of independent data, such as Gene Set Enrichment Analysis (GSEA) and Gene Relationships Across Implicated Loci (GRAIL) [1], [19]–[21]. Both approaches identify connections between genes based on descriptive categories that outline the theorized underlying pathogenesis. However, these concepts are often general, so that specific hypotheses and molecular pathways can be difficult to define and are somewhat limited to established knowledge bases.
Observations of interactions between the products of protein-coding genes offer the most direct route to identifying pathogenic processes. It has been shown in a number of Mendelian diseases that genes causal of a particular phenotype tend to physically interact [22]–[26]. This has been confirmed in the model organism C. elegans, where RNAi knock-down of germline genes correlated highly with their products interacting in yeast-two hybrid experiments [26]. A classic example of a human Mendelian disease that recapitulates this model is Fanconi Anemia (FA), an autosomal recessive disorder linked to at least 13 loci, at least 8 of which function in a DNA repair complex [22]. Protein-protein interaction (PPI) data has also been used to formulate hypotheses about co-expressed genes as well as cancer genes [27], [28]. We note that previous attempts to use PPI data to prioritize candidate genes in Mendelian disorders have been successful as was the case with the published tool Prioritizer [29]. We therefore set out to test such an approach in complex disease.
Investigators have rapidly populated databases of such protein-protein interactions over the past decade. The reported interactions in PPI databases stem from both small, directed investigations and high-throughput experiments, primarily yeast two-hybrid screens and affinity purification followed by mass spectrometry [30]. These data are inherently noisy: beyond technical false positives and negatives, experiments in vitro may report interactions that do not occur in vivo simply because the proteins involved never overlap spatially or temporally. To mitigate the noisiness of PPI databases, we extract networks from “InWeb”, assembled in 2007 by Lage et al [24], [31]. InWeb is a database of 169,810 high-confidence pair-wise interactions involving 12,793 proteins (human proteins and their orthologs). Lage et al. define high-confidence interactions as those seen in multiple independent experiments and reported more often in lower-throughput experiments [24]. To further restrict the data to biologically plausible interactions, we overlay mRNA expression information to confirm co-expression of binding partners; this correlates with co-localization, similar phenotype and participation in a protein complex [31], [32].
Assessing the significance of networks built from PPI data is challenging for two reasons: first, overall connectivity is a function of the binding degree (number of connections in the database for a given protein) of proteins within the network. Thus, the apparent density of a network could simply be due to the lack of specificity with which its constituents bind in vitro. Second, certain processes are more extensively studied, so more connections between proteins involved in them may be reported (see Figure S1; immune proteins are reported in more publications and have a higher mean binding degree). This confounds our effort to assess connectivity of associated loci if there is a bias in the data. From a genetic standpoint, a common randomization method would involve sampling SNPs from the genome matched for the appropriate parameters (such as gene density and protein binding degree). This method becomes highly limited if the disease loci contain genes that are better studied than the randomly sampled SNPs.
Therefore, we apply a permutation method that is robust to non-specific binding and differences in publication density. We perform a within-degree node-label permutation that is carried out as follows: a random network is built that has nearly the exact same structure as the original InWeb network, only the node labels (i.e. the protein names) are randomly re-assigned to nodes of equal binding degree; this method assumes a null distribution of connectivity that is entirely a function of the binding degree of individual proteins. Random networks will have the same size, number of edges and per-protein binding degree as InWeb; we build 50,000 different random networks. With this method, we are able to test the non-randomness of our network conditional on the exact binding degree distribution of our disease proteins.
Others have used PPI data in complex disease to understand epistatic loci or to build a network of interacting proteins from associated loci [33]–[35]. The novelty of our method lies not in the idea that PPI data can be used to help understand genetic loci associated to disease, but rather in that we have developed a broadly-applicable method to statistically evaluate the degree to which non-random PPI networks emerge from loci associated to complex disease and to leverage from this insight about causal proteins in large loci [33], [34]. We show this to be the case in a number of diseases.
Here, we use this methodology to evaluate whether genes in loci associated to five complex traits are significantly connected via protein-protein interactions. We report an algorithm to build and assess PPI networks using the InWeb database and find robust, statistically significant networks underlying associations to RA, CD, height and lipid levels, which we suggest as representative of the underlying pathogenic molecular processes. We then perform several detailed analyses on the RA and CD networks to confirm that they contain true biological insight into disease. We use independent mRNA expression data to show that the prioritized associated proteins we propose as interacting are co-expressed in relevant immune tissues, supporting a plausible biological setting for our findings as well as the validity of the reported protein-protein interactions. Lastly, by analyzing more recent GWAS meta-analysis results, we show that these networks contain components that show significant evidence of further genetic associations: proteins interacting with multiple associated network members and encoded elsewhere in the genome themselves carry an excess of association to disease in the latest meta-analyses of each of these diseases. Our method, available for download, generates an experimentally tractable hypothesis of the molecular underpinnings of pathogenesis.
Results
Network Construction and Evaluation Pipeline
We construct and evaluate networks of disease loci as outlined in Figure 1. We first define associated proteins as gene products encoded in genomic loci harboring variants associated to disease (Figure 1A, 1B; see Materials and Methods for locus definition). We construct networks of protein-protein interactions representing proteins as nodes connected by an edge if there is in vitro evidence of interaction (InWeb high-confidence interaction set). We build direct networks, in which any two associated proteins can be connected by exactly one edge, and indirect networks, where associated proteins can be connected via common interactor proteins (not encoded in associated loci) with which the associated proteins each share an edge. We restrict direct and indirect interactions to only those between proteins encoded in distinct associated loci.

We then calculate several metrics to evaluate network properties. These metrics can be divided into two categories: an edge metric and node metrics. The edge metric is the direct network connectivity parameter defined as the number of edges in the direct network. We interpret direct network connectivity as the frequency with which different loci harbor proteins that directly bind each other, regardless of how they assemble; direct network connectivity is therefore our most straightforward metric. Node metrics include the following: associated protein direct connectivity and associated protein indirect connectivity which refer to the number of distinct loci an associated protein can be connected to directly and indirectly, respectively, and common interactor connectivity which refers to the average number of proteins in distinct loci bound by common interactors in indirect networks. We interpret all three node metrics as descriptive of the type of network that was constructed: a stream of connections (such as the network A-B-C-D-E) will likely have low and insignificant node metrics despite a significant edge metric, whereas a more tightly clustered network might be enriched for both edge and node metrics. We assess the statistical significance of the various connectivity parameters using a within-degree node-label permutation strategy that controls for variation in the degree to which certain proteins are studied or behave in vitro (Figure 1C; see Text S1 for details on the permutation strategy, evaluation of its ability to distinguish signal from noise and a benchmark analysis of Fanconi Anemia). As we are interested in the processes underlying disease, we also define the gene encoding the top-scoring protein in each locus as most likely to be causal for association (Figure 1D; see Text S1 for prioritization strategy). We then use tissue expression data to test whether our nominated candidate genes are enriched in the same tissue(s) and therefore participate in a network that is biologically feasible (Figure 1E; Text S1). With this approach, we aim to construct plausible models of biological networks underlying pathogenesis.
Our approach controls for biases in the data: using the high-confidence interactions from InWeb addresses laboratory artifacts, and node-label permutation accounts for ascertainment biases due to differing levels of knowledge on biological processes for those proteins present in InWeb (Figure S1). We show empirically that priority scores given to proteins have no correlation with the degree to which they are represented in the database (Figure S2). A fundamental limitation of any functional data is that genes for which data are missing will not be considered. This applies to similar methods, including expression data that can be limited to genes represented on specific arrays or ontology analyses that are restricted to well characterized genes. Here, proteins that are entirely absent from the filtered InWeb data are not considered in our analysis (see Discussion). It is important to note that these genes, listed in Table S1, cannot be ruled out as potentially affected by causal variation since we have no power to make such a conclusion. We note, however, that the loci we have considered here (for the 5 complex traits) have the majority of their genes present in the high-confidence InWeb database (Table S1, median inclusion of 81.5%).
We also tested two additional permutation strategies on RA and CD – one based on random sampling of SNPs from the genome matched for proximal gene content and protein binding degree and the other based on edge permutation – that generally provided equivalent results (Figures S3 and S4); however SNP permutation may not be robust in the presence of extremes of gene density or protein binding degree at some loci, and edge permutation does not preserve the network structure of InWeb (Text S1). This analysis pipeline, which we call Disease Association Protein-Protein Link Evaluator (DAPPLE), is available for download at http://www.broadinstitute.org/~rossin/DAPPLE.
Gene Products Encoded in Associated Loci Interact
We first tested the method on the Mendelian disease Fanconi Anemia (FA) as a proof of principle. We input 9 of the FA genes and found 23 connections among them; compared to 50,000 random networks, the FA network is enriched for connectivity (direct network connectivity p<<2×10⁻⁵, Figure S5, Text S1). This result is consistent with current understanding of how the FA genes code for proteins that are part of the same DNA repair complex [36].
We then set out to test our method on two autoimmune diseases that are both complex traits. Recent GWA studies in autoimmune and inflammatory diseases have been particularly successful at determining loci encoding risk to disease, with over 100 loci described to date [2]–[7], [1]. We investigated rheumatoid arthritis (RA) and Crohn's disease (CD) and built networks from proteins encoded in 25 and 27 gene-containing associated loci, respectively [2], [8]. As described above, we built direct and indirect networks for each set of loci, evaluated the significance of the 4 network metrics to assess the probability that such networks could arise by chance, and we nominated candidate genes by assessing network participation. We followed up our results by assessing tissue co-expression as a test for the biological feasibility.
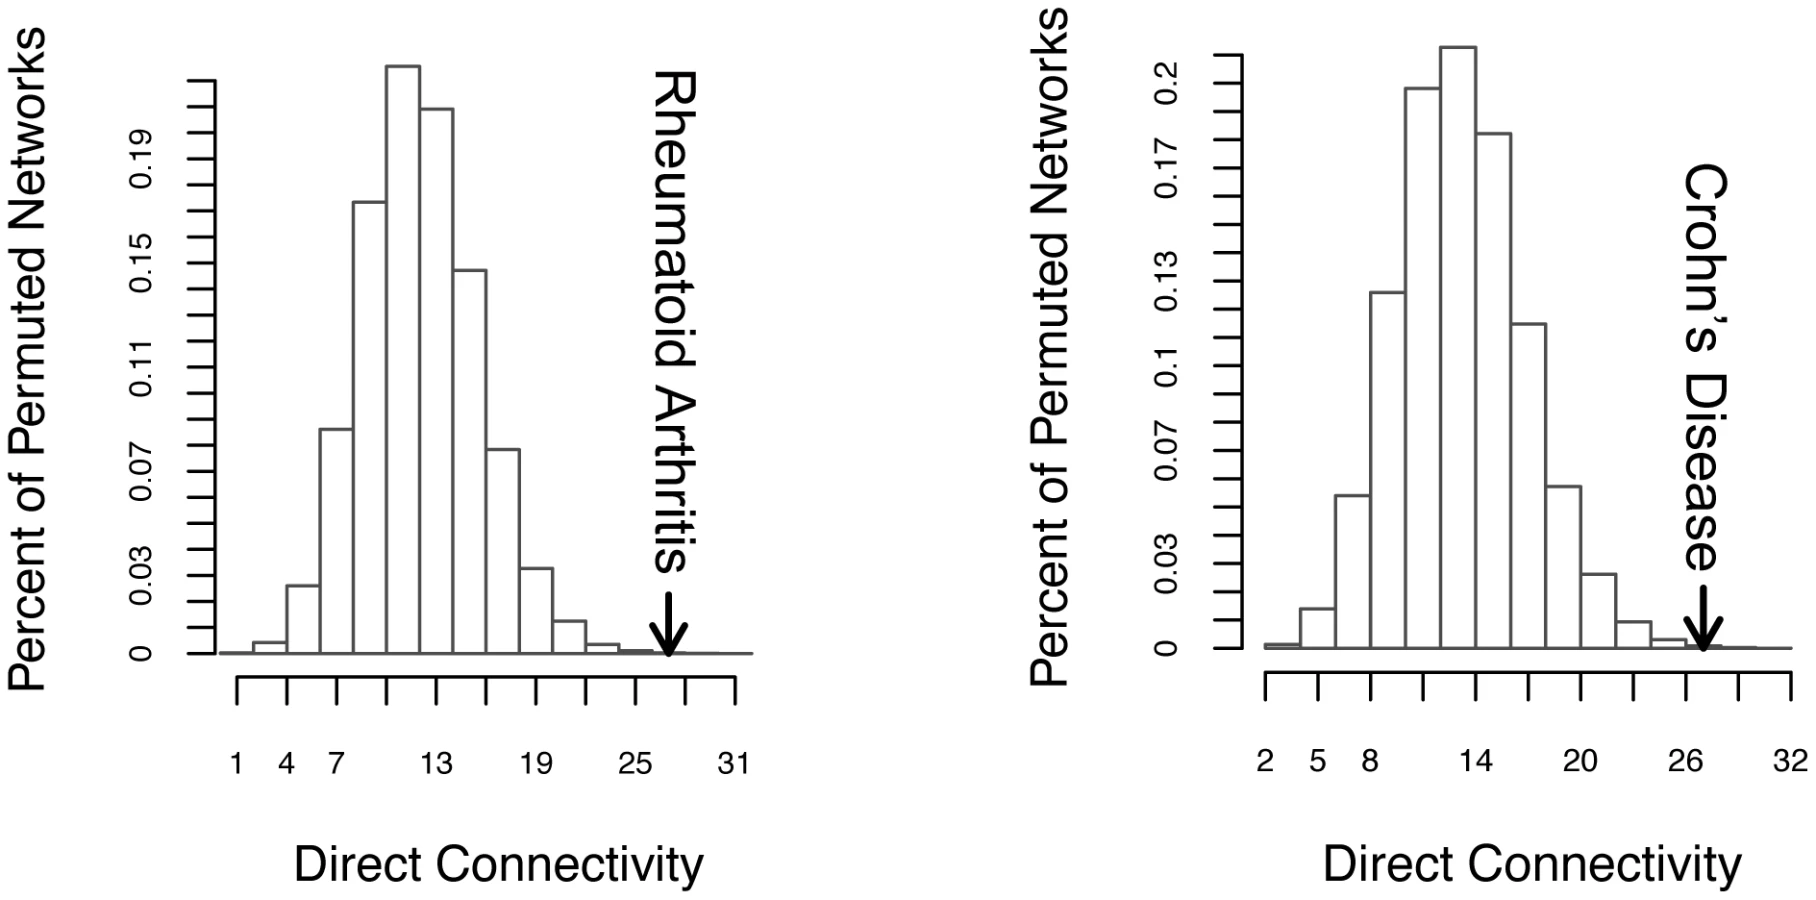
We were able to connect 20/27 loci for RA and 12/25 loci for CD in direct networks, strongly suggesting functional connections between proteins encoded in the associated regions. When compared to 50,000 random networks, we found that the direct network connectivity (the number of direct network edges) was statistically significant (27 for each disease; PRA = 3×10⁻⁴, PCD = 1.11×10⁻³; Figure 2) as was the associated protein direct connectivity (Figure S6A and S6B, PRA = 0.02, PCD = 0.00305). Thus disease-associated loci encode directly interacting proteins beyond chance expectation, suggesting that risk variants may act on suites of proteins involved in the same process.
We were then able to connect all but one gene-containing associated loci in each disease by expanding our networks to include common interactors (26/27 in RA; 24/25 in CD). The associated protein indirect connectivity was significantly enriched in both diseases (Figure S6A and S6B p = 1×10⁻⁵ in RA, p = 4.1×10⁻⁴ for CD), as was the common interactor connectivity (Figure S6A and S6B, p = 7×10⁻⁵ for RA and p = 1.1×10⁻⁴ for CD).
In aggregate, these results suggest that the observations of connectivity in Mendelian diseases are recapitulated in both RA and CD and that common risk variants predisposing to these diseases may impact sets of interacting proteins.
Given the significant connectivity of common interactors in the indirect networks for RA and CD, we speculated that common interactors might themselves be affected by previously undescribed risk variation. To test this, we consulted association data for each disease in the available data from meta-analyses, which for RA was in a newly completed meta-analysis and for CD was the same study that yielded the 30 loci [2], [37]. We assigned each recombination hotspot-bounded linkage-disequilibrium (LD) block in the genome an association score that represents the maximum score in that block corrected for the number independent SNPs therein. Genes were assigned association scores based on the blocks they overlap; this score distribution can then be compared to the scores of all gene-containing blocks in the genome (for both diseases, we removed the MHC from this analysis due to LD properties). Using this method, we found that common interactors expressed in the same tissues as associated proteins in our networks (see below) were encoded in regions with evidence of association significantly in excess to what is expected in gene-containing regions. In RA, the distribution of common interactor scores was skewed toward higher association (one-tailed rank sum p = 1.7×10⁻⁵) and in CD, we saw similar enrichment (p = 6.5×10⁻⁴). See Text S1 for details of analysis. This observed skew suggests that the common interactors themselves may harbor risk variants; we therefore considered the regions they overlap as candidates for replication (see “Crohn's Network Predicts New Loci” section).
Extending Analysis to Height, Lipids, and Type 2 Diabetes
To test whether the observed significant connectivity seen in RA and CD was present in non-immune complex traits, we tested our method on three traits: human height, blood lipid concentration (both LDL and HDL) and Type 2 Diabetes (T2D). We used 37 replicated gene-containing loci associated with human height, 18 with blood lipid levels and 36 with T2D [9]–[17]. The loci associated to height and lipids each contain proteins that assemble into significantly connected direct networks (Figure S6C and S6D, direct network connectivity p = 1×10⁻⁴ and p = 1.9×10⁻⁴ for each disease, respectively; see Text S1 for significance of other 3 parameters). In the height network, 19/42 loci participated in the direct network and 34/42 participate in the indirect networks, but only the direct network connectivity and the common interactor connectivity were significantly greater than chance. In the lipids network, 11/19 participated in the direct network and 16/19 in the indirect; all node metrics except the common interactor connectivity were significantly enriched. 9/37 T2D loci participated in the direct network and 34/37 in the indirect network; however, 3/4 metrics were not greater than chance expectation and only one was slightly enriched (Figure S6E, network connectivity p = 0.44960; see Text S1 for significance of other 3 parameters).
We therefore conclude that the PPI connectivity seen in two autoimmune diseases can be generalized to other complex trait loci (height - and lipid-associated regions), though we could not confirm the significance of the T2D network.
Our results suggest that functionally connected proteins reside in regions of the genome associated to disease risk. Permutation analysis revealed that these connections are in excess compared to what is expected given the binding profiles of associated proteins. For RA and CD, other proteins interacting with the associated proteins also show evidence of association beyond chance expectation. Cumulatively, these findings suggest that risk to the complex disease/traits studied here is spread over functional groups of proteins, directly analogous to observations in Mendelian traits.
Prioritizing Proteins in Associated Loci Reveals Likely Pathogenic Tissues
An obstacle to interpreting GWA results stems from the difficulty in identifying the genes within associated regions influenced by risk variants. Candidate genes are often selected based on proximity to most associated markers and miscellaneous forms of previous knowledge. We therefore asked whether our observations could lead us to a principled, data-driven approach to selecting candidate genes by assessing their role in our networks. As shown in Figure 1 and described in detail in the Text S1, we used an iterative optimization method to assign priority scores to associated genes based on the network participation of their encoded proteins. We nominate genes that achieve the best score within their locus as the candidates for influencing disease risk. We describe the results in detail here for RA and CD; see Table S2 for scores assigned to RA, CD, blood lipid level and height genes.
We were able to nominate candidate genes in 12/21 RA loci encoding multiple genes (Table S2; Text S1). Examples of candidate genes in RA were IL2RA, CD40, CD28, PTPN22, CTLA4 and TRAF1. We accomplished the same task in CD, nominating candidate genes in 10/18 multi-genic loci. Candidates included JAK2, STAT3, IL23R/IL12RB2, PTPN2, MST1R and AIRE. For both diseases, genes in single-gene loci are also scored, though they are automatically considered the candidate gene (but not necessarily part of the underlying mechanism). It is important to note that we do not expect high-scoring proteins in every locus; we only expect high scores for those proteins that may participate in the common process(es) detected via enrichment in connections. RA and CD, like most complex diseases, most likely have many underlying processes, not all of which are captured here.
The core networks involving only these candidate genes represent our mechanistic predictions of pathways underlying pathogenesis in RA and CD. From a statistical standpoint the final networks built from candidate proteins account for the excess connectivity that we initially observed: the significance remains if we restrict multi-genic loci to just these genes (Figure S7A–S7D, direct network connectivity p<2×10⁻⁵ for RA and CD), while networks built from the remaining non-prioritized genes are less significant (Figure S8, direct network connectivity p = 0.0368 and p = 0.993, for RA and CD respectively). The remaining significance in RA is most likely a sign of additional important proteins that did not make the cutoff. From a biological standpoint, our candidates agree with experimental findings in the few cases where such evidence exists [38]–[45]. We therefore show that the connectivity between associated loci in RA and CD is primarily driven by a small subset of associated proteins encoded in those regions; this observation suggests that the interacting proteins – and the biological pathways they represent – may be the targets of risk variation.
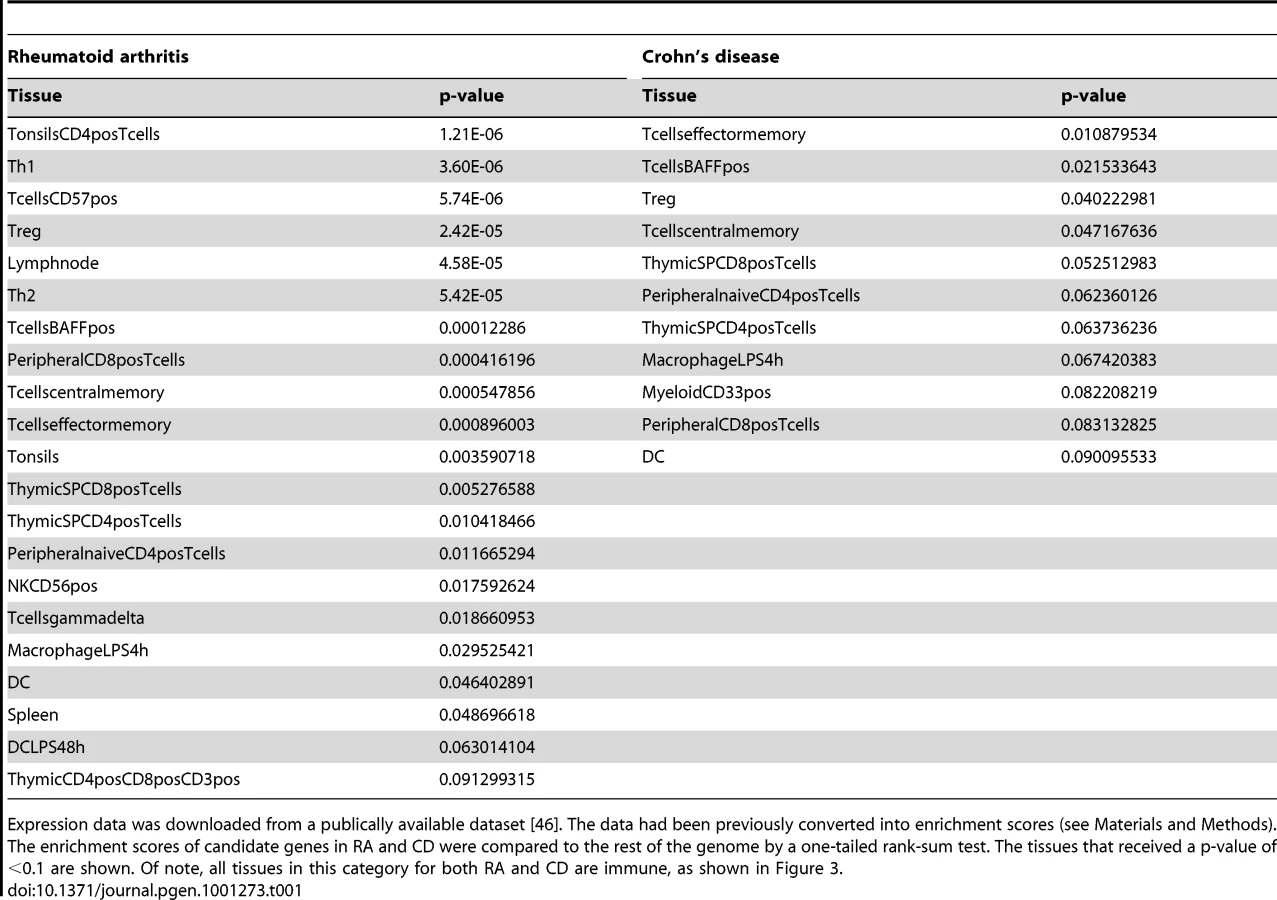
To test the biological plausibility of our nominated core networks, we asked whether the candidate genes are co-enriched in subsets of particularly relevant tissues in a reference microarray dataset consisting of 14,184 transcripts measured in 55 immune, 8 gastro-intestinal, 27 neurological and 36 miscellaneous other tissues (126 total) [46]. These publicly available data are curated: expression intensities were converted to enrichment scores to reflect the enrichment of a gene in a tissue given its expression in all tissues. For each tissue, we compared the expression enrichment of RA and CD candidate genes to the rest of the genes in the genome using a one-tailed rank-sum test, resulting in a p-value for each tissue. A significant difference for a given tissue indicated that the genes in question were enriched for expression in that tissue compared to all genes in the genome. We also performed the same analysis for the remaining non-prioritized genes in associated regions to test whether the network prioritization method identified genes that were enriched in tissues distinct from non-prioritized genes. For discussion purposes, we defined “top” tissues as tissues achieving p<0.1 (Figure 3 depicts the entire distribution of p-values). This analysis led to 3 main conclusions. First, we found that for each disease, enrichment only occurred in immunologically relevant tissues (Figure 3; strikingly, immune tissues are nearly all ranked higher than other tissues). Second, we found that this was not the case to such an extent for non-prioritized genes (Figure 3, black points). Third, we found that the non-prioritized genes had fewer tissues where we could detect enrichment (Figure 3, RA and CD candidate gene tissue scores are more significant than tissue scores of non-prioritized genes). We formally tested this by comparing the p-value distributions for candidate genes and non-prioritized genes using a one-tailed rank-sum test (p = 2.85×10⁻⁷ for RA; p = 2.55×10⁻⁴ for CD). Of the 11 top tissues for CD candidate genes, 7 are subgroups of T-cell lymphocytes; the analogous list for RA (21 tissues) contains a mix of immune tissues, again dominated by T-cell subgroups (Table 1). The top tissue compartment for both diseases is defined as CD4+ T-cells.

Crohn's Network Predicts New Loci
We hypothesized that a subset of proteins connected to the core CD network (Figure 4B, the network built from prioritized genes in CD loci) might be near true causal variation. Having observed significant enrichment for association in the common interactors, we then chose a more conservative approach to propose candidate genes. We selected all proteins that connect directly to the core CD network only (21 genes) and filtered them on expression in the relevant tissues (Table 1). While this manuscript was being prepared, a larger meta-analysis was completed and recently published that reports 39 new loci associated to CD (295 overlapping genes) [47]. Of the 293 genes proposed by our method (small circles, Figure 4B), 10 were in newly associated regions (small red circles). This represents a statistically significant enrichment compared to chance expectation based on random draws from all 21,718 genes (p = 0.001) as well as random draws from genes expressed in at least one of the CD-relevant tissues (p = 0.01).

We performed a similar analysis in RA since the recent meta-analysis discovered 6 new loci (18 new genes) [37]. Of the 610 genes proposed, 1 was among the 18 new genes (Figure 4A, small red circle). This does not represent a statistically significant enrichment.
Candidate Gene Networks Suggest Underlying Biology
The networks (Figure 4) suggest pathogenic mechanisms in agreement with current thinking on disease etiology and propose novel roles for candidate proteins in these pathways. The RA network (Figure 4A) appears to represent signaling cascades involved in the inhibition or stimulation of the NF-kB complex, a factor that activates transcription of genes encoding cytokines, antibodies, co-stimulatory molecules and surface receptors [43]. STAT4 encodes a transcription factor that is activated upon engagement of cytokines, such as IL12 and interferon type I, with their receptors [43]. We show that not only does STAT4 show enrichment for connectivity, it is connected indirectly to a number of associated genes encoding surface receptor subunits that also achieve high network scores, such as IL12RB, IL2RA and PTPRC. TNFAIP3 (known as A20 in mice) is a cytoplasmic zinc finger protein that inhibits NF-kB activity, and knockout mice develop widespread and ultimately lethal inflammation, making it a plausible player in RA pathogenesis [48]. Also in the NF-kB pathway is associated protein CD40, which scores highly in our networks and binds TRAF6 and TRAF1 directly. CD40 is normally found on B cells but has also been shown to act as a co-stimulatory molecule on T cells to augment CD28 response and activate NF-kB [49].
PTPN22, a gene with strong genetic support for harboring risk variants (including the strongly associated R620W coding polymorphism), has been shown to act as a negative regulator of TCR but has not yet been definitively linked to a pathogenic mechanism [43], [50]. Here, we place it in context of other highly associated proteins and suggest that it is part of a common mechanism.
Finally, the RA network places a number of other proteins that have not yet been formally studied in the context of the proposed network underlying RA; these include CD2 and CD48, as well as FCG2RA and PRKCQ, genes suspected of being causal but not formally placed in a mechanism with other associations.
In CD the core of the candidate network (IL12B/IL23R/JAK2/STAT3; Figure 4B) corresponds to the interleukin-23 (IL23) signaling pathway. IL12B encodes p40, a component of the heterodimeric IL23. The IL23R gene encodes one half of the also heterodimeric IL23 receptor. This receptor is a cell surface complex found on a variety of immune cells; on activation, it induces Janus Kinase 2 (Jak2) autophosphorylation, which in turn leads to the translocation of STAT3 to the nucleus to activate transcription of various pro-inflammatory cytokines [40]. IL23 signaling is necessary for the activation and maintenance of a subset of CD4+ T cells acting as ‘inflammatory effectors’; these interleukin-17 responsive T-cells (Th17) have been implicated in autoimmune inflammation in CD and experimental models of other autoimmune diseases [40]. We note that IL23 belongs to the interleukin 12 family of cytokines and both ligand and receptor share subunits with the canonical IL12-mediated signaling pathway, which induces activation of regulatory T cells (Treg).
Our CD network suggests that other proteins participate in this pathway, including the tyrosine phosphatases encoded by PTPN2, a gene also associated to other autoimmune diseases [51]. Other proteins that are indirectly connected to this pathway include IRF1, which we score highly and that has separately been reported to activate transcription of IL12RB1 [52]. Furthermore, the common interactors that we prioritize for replication of association given their involvement in the CD network – including JAK1, STAT4, TYK2 and IL2RA – fall into the IL12 and IL23 signaling pathway (TYK2 and IL2RA were of the genes recently found to be in regions of association).
The CD network also generates new hypotheses about potentially important genes. We prioritize AIRE, an associated protein involved in T-cell development, which has not been extensively studied in the context of Crohn's but could plausibly lead to autoimmunity. ZNF365, a gene that achieves a high permutation score, has been assumed to be the causal gene because it is the only gene to reside in the wingspan of its locus; however, it has not been studied as part of the core network described here (IL23R/JAK2/STAT3 pathway). Finally, CSF2, IKZF3 and GRB7 are in the same large locus (17 genes) but achieve significant permutation scores; these genes have been less well studied in the context of CD.
Discussion
We have shown that proteins encoded in regions associated to RA, CD, height and lipids interact and that the networks they form are significantly connected when compared to random networks. In CD and RA, the genes encoding prioritized proteins are preferentially expressed in immune tissues relevant to the pathogenesis of both diseases, while the rest of the genes in associated loci show less tissue preference. Furthermore, we can connect other associated proteins to these networks via common interactors, which appear to be encoded in genomic regions harboring further risk variants. Newly available data in CD allowed us to confirm that genes predicted to be near causal variation are indeed in regions now known to be associated to CD. We note that the conclusion of connectivity could not be extended to T2D, and we hypothesize that the lack of connectivity may be due to disparate underlying mechanisms that have yet to be well captured genetically. Though our aim was to build and analyze networks that emerge from replicated regions of association, we feel that a promising future direction may be to look more broadly for networks enriched in weaker signals of association. Evidence that this type of analysis may be helpful is that we pointed to a set of weaker CD association signals that were found to be true positives in a larger study.
Our results have several implications for the interpretation of genome-wide association studies: first, our ability to connect the majority of associated loci in a limited number of molecular networks suggests that these represent processes underlying pathogenesis. Second, these networks are unbiased, in the sense that they do not rely on previous classifications of gene function or pathway lists; rather, we assemble our networks from low-level functional genomics data and allow network structure, if any, to emerge. Third, our approach is general; we have demonstrated it using interactions between protein products, but any relationship between genes or other genomic features (non-coding RNAs, enhancer elements, conserved regions etc.) may be used in the same fashion. Even more powerful, approaches combining such orthogonal data types will be rewarding. The limitation to using PPI data from a curated database such as InWeb is that proteins for which no high-confidence interactions exist will be left out of the analysis. As such, our analysis is limited to proteins present in the database. Additionally, while we controlled for the biases we observed, other undetected biases still may exist.
Interestingly, there are certain cases where the method is able to distinguish between proteins that are close in the genome and functionally very similar. In RA, the rs12746613 locus has 3 genes in the PPI database – FCG2RA, FCGR3A and HSP70B. FCG2RA achieved a nominal p-value of 0.00703, whereas FCGR3A achieved p = 0.38296. Similarly, in the large rs3197999 locus in CD, the method gave MST1R a p-value of 0.0066 whereas MST1, the ligand of MST1R, achieved a p-value of 1. In these cases, the method is able to distinguish between functionally similar genes. There are times when it is unable to distinguish between functionally similar genes, however, such as the IL21/IL2 locus in RA, the STAT1/STAT4 locus in RA and the STAT3/STAT5A/STAT5B locus in CD.
We note in passing that the candidate genes we nominate are on average the closest to the most associated SNP in each locus, even though proximity within the LD region was not considered in the PPI analysis (p = 0.005, Figure S9). This supports the theory that the majority of causal variation will be close to the association signal rather than anywhere in the region of LD. We also observed overlap between genes prioritized by this method and GRAIL, a text-mining approach that uses orthogonal data (Table S2) [19]. We depict this information, as well as overlap between prioritized genes and the presence of non-synonymous SNPs, in Figure S10.
In this paper, we have studied 5 complex phenotypes, 4 of which show evidence of abundant PPI connections across loci. Our results therefore allow us to speculate that other complex diseases may behave in the same way and that genetic risk may be spread over the molecular processes that influence disease, rather than a single, catastrophic mutation as in Mendelian inheritance. In order to determine whether what we find here is expandable to complex disease in general, however, we would need to apply our method to the many more diseases and traits to which regions of the genome have been associated. Nonetheless, for the networks that emerge here, our approach identifies sets of proteins plausibly involved in pathogenesis, and the next step will be to identify what the molecular and phenotypic consequences of perturbing such processes are and how they relate to overall disease etiology.
Materials and Methods
InWeb Database
We used a probabilistic database of reported protein-protein interactions described in 2007 by Lage et al [24], [31]. This database contains 428,430 reported interactions, 169,810 of which are deemed high-confidence, non-self interactions across 12,793 proteins. High-confidence is defined by a rigorously tested signal to noise threshold as determined by comparison to well-established interactions [24]. Briefly, InWeb combines reported protein interactions from MINT, BIND, IntAct, KEGG annotated protein-protein interactions (PPrel), KEGG Enzymes involved in neighboring steps (ECrel), Reactome and others as described elsewhere in detail [53]–[61]. All human interactions were pooled and interactions in orthologous protein pairs passing a strict threshold for orthology were included. Each interaction was assigned a probabilistic score based on the neighborhood of the interaction, the scale of the experiment in which the interaction was reported and the number of different publications in which the interaction had been sited. The data we used is available at www.broadinstitute.org/~rossin/PPI/ppi.html.
Disease Loci
30 CD SNPs were derived from the first CD meta analysis of which 25 contain genes [2]. 28 RA SNPs were derived from the most recent RA review of which 27 contain genes [8]. 42 Height SNPs were derived from a number of analyses of which 38 contain genes [10], [13], [16]. 19 blood lipid level SNPs were derived from a number of analyses of which all 19 contain genes [11], [15]. Finally, 42 T2D SNPs were derived from a number of analyses of which 37 contain genes [9], [12], [14], [17].
Translating SNPs to Genes
Hotspot and linkage disequilibrium (LD) information were downloaded from www.hapmap.org for CEU hg17 and hg18 to match the version in which associations were reported [62]. We defined the wingspan of a SNP as the region containing SNPs with r2>0.5 to the associated SNP; this region is then extended to the nearest recombination hotspot. We downloaded the Ensembl human gene list from UCSC Genome Browser and collapsed isoforms into single genes [63]. We converted gene IDs from Ensemble to InWeb IDs. A gene's residence in a locus is defined by whether 110 kb upstream and 40 kb downstream (to include regulatory DNA) of the coding region of the gene's largest isoform overlaps the SNP wingspan [64].
Statistical Analysis
All analyses, including building networks and evaluating significance, were carried out in R, Perl and Python and are available at www.broadinstitute.org/~rossin/PPI/ppi.html. Details on the algorithms are available in the Text S1 file.
Supporting Information
Zdroje
1. RaychaudhuriS
ThomsonBP
RemmersEF
EyreS
HinksA
2009 Genetic variants at CD28, PRDM1 and CD2/CD58 are associated with rheumatoid arthritis risk. Nat Genet 41 1313 1318
2. BarrettJC
HansoulS
NicolaeDL
ChoJH
DuerrRH
2008 Genome-wide association defines more than 30 distinct susceptibility loci for Crohn's disease. Nat Genet 40 955 962
3. BarrettJC
ClaytonDG
ConcannonP
AkolkarB
CooperJD
2009 Genome-wide association study and meta-analysis find that over 40 loci affect risk of type 1 diabetes. Nat Genet Available at: http://www.ncbi.nlm.nih.gov.ezp-prod1.hul.harvard.edu/pubmed/19430480. Accessed 19 March 2010
4. BarrettJC
LeeJC
LeesCW
PrescottNJ
AndersonCA
2009 Genome-wide association study of ulcerative colitis identifies three new susceptibility loci, including the HNF4A region. Nat Genet 41 1330 1334
5. De JagerPL
JiaX
WangJ
de BakkerPIW
OttoboniL
2009 Meta-analysis of genome scans and replication identify CD6, IRF8 and TNFRSF1A as new multiple sclerosis susceptibility loci. Nat Genet 41 776 782
6. GatevaV
SandlingJK
HomG
TaylorKE
ChungSA
2009 A large-scale replication study identifies TNIP1, PRDM1, JAZF1, UHRF1BP1 and IL10 as risk loci for systemic lupus erythematosus. Nat Genet 41 1228 1233
7. HuntKA
ZhernakovaA
TurnerG
HeapGAR
FrankeL
2008 Newly identified genetic risk variants for celiac disease related to the immune response. Nat Genet 40 395 402
8. RaychaudhuriS
2010 Recent advances in the genetics of rheumatoid arthritis. Curr Opin Rheumatol 22 109 118
9. DupuisJ
LangenbergC
ProkopenkoI
SaxenaR
SoranzoN
2010 New genetic loci implicated in fasting glucose homeostasis and their impact on type 2 diabetes risk. Nat Genet 42 105 116
10. GudbjartssonDF
WaltersGB
ThorleifssonG
StefanssonH
HalldorssonBV
2008 Many sequence variants affecting diversity of adult human height. Nat Genet 40 609 615
11. KathiresanS
MelanderO
GuiducciC
SurtiA
BurttNP
2008 Six new loci associated with blood low-density lipoprotein cholesterol, high-density lipoprotein cholesterol or triglycerides in humans. Nat Genet 40 189 197
12. McCarthyMI
ZegginiE
2009 Genome-wide association studies in type 2 diabetes. Curr Diab Rep 9 164 171
13. LettreG
JacksonAU
GiegerC
SchumacherFR
BerndtSI
2008 Identification of ten loci associated with height highlights new biological pathways in human growth. Nat Genet 40 584 591
14. VoightBF
ScottLJ
SteinthorsdottirV
MorrisAP
DinaC
2010 Twelve type 2 diabetes susceptibility loci identified through large-scale association analysis. Nat Genet 42 579 589
15. WillerCJ
SannaS
JacksonAU
ScuteriA
BonnycastleLL
2008 Newly identified loci that influence lipid concentrations and risk of coronary artery disease. Nat Genet 40 161 169
16. WeedonMN
LangoH
LindgrenCM
WallaceC
EvansDM
2008 Genome-wide association analysis identifies 20 loci that influence adult height. Nat Genet 40 575 583
17. ZegginiE
ScottLJ
SaxenaR
VoightBF
MarchiniJL
2008 Meta-analysis of genome-wide association data and large-scale replication identifies additional susceptibility loci for type 2 diabetes. Nat Genet 40 638 645
18. ZhangX
HuangW
YangS
SunL
ZhangF
2009 Psoriasis genome-wide association study identifies susceptibility variants within LCE gene cluster at 1q21. Nat Genet 41 205 210
19. RaychaudhuriS
PlengeRM
RossinEJ
NgACY
PurcellSM
2009 Identifying relationships among genomic disease regions: predicting genes at pathogenic SNP associations and rare deletions. PLoS Genet 5 e1000534 doi:10.1371/journal.pgen.1000534
20. WangK
LiM
BucanM
2007 Pathway-Based Approaches for Analysis of Genomewide Association Studies. Am J Hum Genet 81 Available at: http://www.ncbi.nlm.nih.gov/pubmed/17966091. Accessed 3 March 2010
21. SubramanianA
TamayoP
MoothaVK
MukherjeeS
EbertBL
2005 Gene set enrichment analysis: a knowledge-based approach for interpreting genome-wide expression profiles. Proc Natl Acad Sci U S A 102 15545 15550
22. BrunnerHG
van DrielMA
2004 From syndrome families to functional genomics. Nat Rev Genet 5 545 551
23. D'AndreaAD
GrompeM
2003 The Fanconi anaemia/BRCA pathway. Nat Rev Cancer 3 23 34
24. LageK
KarlbergEO
StørlingZM
OlasonPI
PedersenAG
2007 A human phenome-interactome network of protein complexes implicated in genetic disorders. Nat Biotechnol 25 309 316
25. LimJ
HaoT
ShawC
PatelAJ
SzabóG
2006 A Protein-Protein Interaction Network for Human Inherited Ataxias and Disorders of Purkinje Cell Degeneration. Cell 125 801 814
26. WalhoutAJ
ReboulJ
ShtankoO
BertinN
VaglioP
2002 Integrating Interactome, Phenome, and Transcriptome Mapping Data for the C. elegans Germline. Current Biology 12 1952 1958
27. LiL
ZhangK
LeeJ
CordesS
DavisDP
2009 Discovering cancer genes by integrating network and functional properties. BMC Med Genomics 2 61
28. SenguptaU
UkilS
DimitrovaN
AgrawalS
2009 Expression-based network biology identifies alteration in key regulatory pathways of type 2 diabetes and associated risk/complications. PLoS ONE 4 e8100 doi:10.1371/journal.pone.0008100
29. FrankeL
van BakelH
FokkensL
de JongED
Egmont-PetersenM
2006 Reconstruction of a functional human gene network, with an application for prioritizing positional candidate genes. Am J Hum Genet 78 1011 1025
30. GentlemanR
HuberW
2007 Making the most of high-throughput protein-interaction data. Genome Biol 8 112
31. LageK
HansenNT
KarlbergEO
EklundAC
RoqueFS
2008 A large-scale analysis of tissue-specific pathology and gene expression of human disease genes and complexes. Proc Natl Acad Sci U S A 105 20870 20875
32. HuhW
FalvoJV
GerkeLC
CarrollAS
HowsonRW
2003 Global analysis of protein localization in budding yeast. Nature 425 686 691
33. ZieglerA
NepomGT
2010 Prediction and pathogenesis in type 1 diabetes. Immunity 32 468 478
34. BergholdtR
StørlingZM
LageK
KarlbergEO
OlasonPI
2007 Integrative analysis for finding genes and networks involved in diabetes and other complex diseases. Genome Biol 8 R253
35. WuG
ZhuL
DentJE
NardiniC
2010 A comprehensive molecular interaction map for rheumatoid arthritis. PLoS ONE 5 e10137 doi:10.1371/journal.pone.0010137
36. MoldovanG
D'AndreaAD
2009 How the fanconi anemia pathway guards the genome. Annu Rev Genet 43 223 249
37. StahlEA
RaychaudhuriS
RemmersEF
XieG
EyreS
2010 Genome-wide association study meta-analysis identifies seven new rheumatoid arthritis risk loci. Nat Genet Available at: http://www.ncbi.nlm.nih.gov.ezp-prod1.hul.harvard.edu/pubmed/20453842. Accessed 18 May 2010
38. FiresteinGS
2003 Evolving concepts of rheumatoid arthritis. Nature 423 356 361
39. AbrahamC
ChoJH
2009 Inflammatory Bowel Disease. N Engl J Med 361 2066 2078
40. AbrahamC
ChoJ
2009 Interleukin-23/Th17 pathways and inflammatory bowel disease. Inflamm Bowel Dis 15 1090 1100
41. BrandS
2009 Crohn's disease: Th1, Th17 or both? The change of a paradigm: new immunological and genetic insights implicate Th17 cells in the pathogenesis of Crohn's disease. Gut 58 1152 1167
42. ChoJH
2008 The genetics and immunopathogenesis of inflammatory bowel disease. Nat Rev Immunol 8 458 466
43. CriswellLA
2010 Gene discovery in rheumatoid arthritis highlights the CD40/NF-kappaB signaling pathway in disease pathogenesis. Immunol Rev 233 55 61
44. TakedaK
ClausenBE
KaishoT
TsujimuraT
TeradaN
1999 Enhanced Th1 Activity and Development of Chronic Enterocolitis in Mice Devoid of Stat3 in Macrophages and Neutrophils. Immunity 10 39 49
45. ZhangH
MasseyD
TremellingM
ParkesM
2008 Genetics of inflammatory bowel disease: clues to pathogenesis. Br Med Bull 87 17 30
46. BenitaY
CaoZ
GiallourakisC
LiC
GardetA
2010 Gene enrichment profiles reveal T cell development, differentiation and lineage specific transcription factors including ZBTB25 as a novel NF-AT repressor. Blood Available at: http://www.ncbi.nlm.nih.gov.ezp-prod1.hul.harvard.edu/pubmed/20410506. Accessed 8 May 2010
47. FrankeA
McGovernDPB
BarrettJC
WangK
Radford-SmithGL
2010 Genome-wide meta-analysis increases to 71 the number of confirmed Crohn's disease susceptibility loci. Nat Genet 42 1118 1125
48. LeeEG
BooneDL
ChaiS
LibbySL
ChienM
2000 Failure to Regulate TNF-Induced NF-kappa B and Cell Death Responses in A20-Deficient Mice. Science 289 2350 2354
49. MunroeME
BishopGA
2007 A Costimulatory Function for T Cell CD40. J Immunol 178 671 682
50. BottiniN
VangT
CuccaF
MustelinT
2006 Role of PTPN22 in type 1 diabetes and other autoimmune diseases. Semin Immunol 18 207 213
51. SmythDJ
PlagnolV
WalkerNM
CooperJD
DownesK
2008 Shared and distinct genetic variants in type 1 diabetes and celiac disease. N Engl J Med 359 2767 2777
52. KanoS
SatoK
MorishitaY
VollstedtS
KimS
2008 The contribution of transcription factor IRF1 to the interferon-gamma-interleukin 12 signaling axis and TH1 versus TH-17 differentiation of CD4+ T cells. Nat Immunol 9 34 41
53. BaderGD
BetelD
HogueCWV
2003 BIND: the Biomolecular Interaction Network Database. Nucleic Acids Res 31 248 250
54. Chatr-aryamontriA
CeolA
PalazziLM
NardelliG
SchneiderMV
2007 MINT: the Molecular INTeraction database. Nucleic Acids Res 35 D572 574
55. Keshava PrasadTS
GoelR
KandasamyK
KeerthikumarS
KumarS
2009 Human Protein Reference Database–2009 update. Nucleic Acids Res 37 D767 772
56. BreitkreutzB
StarkC
RegulyT
BoucherL
BreitkreutzA
2008 The BioGRID Interaction Database: 2008 update. Nucleic Acids Res 36 D637 640
57. XenariosI
SalwínskiL
DuanXJ
HigneyP
KimS
2002 DIP, the Database of Interacting Proteins: a research tool for studying cellular networks of protein interactions. Nucleic Acids Res 30 303 305
58. MewesHW
DietmannS
FrishmanD
GregoryR
MannhauptG
2008 MIPS: analysis and annotation of genome information in 2007. Nucleic Acids Res 36 D196 201
59. KanehisaM
GotoS
2000 KEGG: kyoto encyclopedia of genes and genomes. Nucleic Acids Res 28 27 30
60. ArandaB
AchuthanP
Alam-FaruqueY
ArmeanI
BridgeA
2010 The IntAct molecular interaction database in 2010. Nucleic Acids Res 38 D525 531
61. D'EustachioP
2011 Reactome knowledgebase of human biological pathways and processes. Methods Mol Biol 694 49 61
62. The International HapMap Consortium 2005 A haplotype map of the human genome. Nature 437 1299 1320
63. FujitaPA
RheadB
ZweigAS
HinrichsAS
KarolchikD
2010 The UCSC Genome Browser database: update 2011. Nucleic Acids Res Available at: http://www.ncbi.nlm.nih.gov.ezp-prod1.hul.harvard.edu/pubmed/20959295. Accessed 7 December 2010
64. VeyrierasJ
KudaravalliS
KimSY
DermitzakisET
GiladY
2008 High-Resolution Mapping of Expression-QTLs Yields Insight into Human Gene Regulation. PLoS Genet 4 e1000214 doi:10.1371/journal.pgen.1000214
Štítky
Genetika Reprodukční medicínaČlánek vyšel v časopise
PLOS Genetics
2011 Číslo 1
Nejčtenější v tomto čísle
- H3K9me-Independent Gene Silencing in Fission Yeast Heterochromatin by Clr5 and Histone Deacetylases
- Evolutionary Conserved Regulation of HIF-1β by NF-κB
- Rnf12—A Jack of All Trades in X Inactivation?
- Joint Genetic Analysis of Gene Expression Data with Inferred Cellular Phenotypes