
A Population Genetics-Phylogenetics Approach to Inferring Natural Selection in Coding Sequences
Through an analysis of polymorphism within and divergence between species, we can hope to learn about the distribution of selective effects of mutations in the genome, changes in the fitness landscape that occur over time, and the location of sites involved in key adaptations that distinguish modern-day species. We introduce a novel method for the analysis of variation in selection pressures within and between species, spatially along the genome and temporally between lineages. We model codon evolution explicitly using a joint population genetics-phylogenetics approach that we developed for the construction of multiallelic models with mutation, selection, and drift. Our approach has the advantage of performing direct inference on coding sequences, inferring ancestral states probabilistically, utilizing allele frequency information, and generalizing to multiple species. We use a Bayesian sliding window model for intragenic variation in selection coefficients that efficiently combines information across sites and captures spatial clustering within the genome. To demonstrate the utility of the method, we infer selective pressures acting in Drosophila melanogaster and D. simulans from polymorphism and divergence data for 100 X-linked coding regions.
Published in the journal:
. PLoS Genet 7(12): e32767. doi:10.1371/journal.pgen.1002395
Category:
Research Article
doi:
https://doi.org/10.1371/journal.pgen.1002395
Summary
Through an analysis of polymorphism within and divergence between species, we can hope to learn about the distribution of selective effects of mutations in the genome, changes in the fitness landscape that occur over time, and the location of sites involved in key adaptations that distinguish modern-day species. We introduce a novel method for the analysis of variation in selection pressures within and between species, spatially along the genome and temporally between lineages. We model codon evolution explicitly using a joint population genetics-phylogenetics approach that we developed for the construction of multiallelic models with mutation, selection, and drift. Our approach has the advantage of performing direct inference on coding sequences, inferring ancestral states probabilistically, utilizing allele frequency information, and generalizing to multiple species. We use a Bayesian sliding window model for intragenic variation in selection coefficients that efficiently combines information across sites and captures spatial clustering within the genome. To demonstrate the utility of the method, we infer selective pressures acting in Drosophila melanogaster and D. simulans from polymorphism and divergence data for 100 X-linked coding regions.
Introduction
The role of adaptation versus alternative, non-adaptive forces in shaping the diversity of life within and between species lies at the heart of many questions in biology [1]–[3]. Consequently, detecting the genetic signature of natural selection in patterns of polymorphism and divergence across multiple species has become a major goal of evolutionary biology [4], [5]. From analyses of polymorphism within and divergence between species, we hope to learn about the distribution of selection coefficients acting on mutations in the genome [e.g. 6]–[8], in particular the frequency and strength of positive selection [9]–[12], changes in the fitness landscape over time [13], and the specific sites in the genome that underlie adaptive phenotypes [14], [15].
Polymorphism and divergence offer complementary angles on the evolutionary process. The McDonald-Kreitman (MK) test [16] exploits this contrast to detect adaptation where divergence or polymorphism data alone might not allow one to do so, owing to variation in selection coefficients within a gene. If adaptive change occurs at a limited number of sites in an otherwise constrained gene, deleterious mutations might limit the relative rate of non-synonymous to synonymous substitution, DN/DS, to a value much less than 1, and thereby swamp the signal of adaptation. Yet an excess DN/DS ratio compared to the relative rate of non-synonymous to synonymous polymorphism, PN/PS, may still reveal a surplus of non-synonymous substitution compared to polymorphism, indicative of adaptive change. Therefore the MK test is a test of the null hypothesis, under the neutral theory [3], [17], that the odds ratio (DN PS)/(DS PN) equals one; a DN/DS ratio significantly greater than PN/PS is indicative of adaptive evolution between the two species.
Several model-based interpretations of the MK test have been proposed [10],[18],[19], of which the Poisson random field (PRF) approach is most widely used [18], [20], [21]. Rooted in diffusion theory, PRF does not in its native form model variation in selection coefficients within a gene except for a class of inviable mutants (but see [22]–[24]). Arguably, this sets a high threshold for detecting adaptive change, because the net effect of selection at variable sites must be adaptive change. If, as one might expect in a functional protein-coding gene, weakly deleterious mutations provide the backdrop to adaptive change through a significant contribution to polymorphism, they will inflate the PN/PS ratio, and thereby raise the threshold that the DN/DS ratio must exceed for adaptation to be detected [19], [25], [26]. Perhaps this explains in part why scans of the human or yeast genome have not found a clear excess of genes that evolve under positive directional selection compared to what is expected by chance [21], [27], [28]. The mathematical conveniences of diffusion theory, particularly the infinite sites model of mutation, make PRF simple and attractive to use. But they also make it difficult to extend to scenarios requiring multiple alleles, multiple species, sophisticated mutation models, probabilistic inference of ancestral states and variable selection pressures. Methods to detect fine-scale variation in selection pressures such as codeml [29], [30] and omegaMap [31] exist but exploit respectively divergence and polymorphism data alone.
The aim of this paper is to develop a method for directly analyzing coding sequence data within and between species in order to (i) infer the distribution of selection coefficients within species (ii) contrast that distribution between species (iii) detect variation in selection coefficients within genes. There are two main novel aspects to the method. First, we develop a combined population genetics-phylogenetics model of codon evolution that predicts patterns of polymorphism within species and divergence between species (Figure S1). Second, we use a Bayesian sliding window approach [31], [32] to model intragenic variation in selection coefficients. We demonstrate our approach with an analysis of 100 X-linked coding regions surveyed in Drosophila melanogaster and D. simulans, using D. yakuba as an outgroup [33].
The key parameter of the model is the population-scaled selection coefficient, γ = 2PNes, where P is the ploidy (P = 1.5 for the Drosophila X chromosome), Ne is the effective population size and fitness is defined relative to the ancestral allele so that s is the fitness advantage of any derived allele encoding an amino acid different to the ancestral allele. Assuming no dominance effect, homozygotes for the beneficial allele have fitness advantage 2s. Stop codons are assumed inviable. The mutation model is that of Hasegawa, Kishino and Yano [34], adapted for codons. The model parameters are the transition:transversion ratio κ and the population-scaled mutation rate θ = 2PNeμ, where μ is the mutation rate per generation. Over long timescales, the phylogenetic substitution rate for this population genetics model converges to that of Nielsen and Yang [29], the model underlying codeml [29]–[30], where their parameter for the DN/DS ratio, ω, is related to the population-scaled selection coefficient, γ, through the equation [35].
Results
We applied our method to 100 X-linked coding regions from the fruit fly Drosophila melanogaster and its close relative D. simulans, using the D. yakuba reference sequence as an outgroup. Individuals were sampled from a Zimbabwean population of D. melanogaster and a Madagascan population of D. simulans, African populations that have high diversity and low linkage disequilibrium suggestive of historically large and stable population sizes [33]. The coding regions were chosen for sequencing randomly with respect to function, from the part of the X chromosome with the highest and most uniform recombination rates (as recombination rate is known to be a major determinant of diversity levels in Drosophila). Each region corresponds to a single exon, one per gene. The number of sequences varied across loci, with a median of 23 in D. melanogaster and 24 in D. simulans. In the following, we report the results of our analysis: the estimated distribution of fitness effects, the influence of sliding window length on what we learn about selection, examples of the local signal of variation in selection pressure, and broad patterns in the correlation in selection pressures along the genome and across evolutionary lineages.
Inferring the Distribution of Fitness Effects
To infer the distribution of selection coefficients, also known as the distribution of fitness effects [4] (DFE), we estimated the frequency of codons at which non-synonymous mutations fall into one of twelve categories defined by the selection coefficient, γ. The categories encompass the range of selective effects from strongly beneficial (100, 50) through moderately beneficial (10, 5), weakly beneficial (1), neutral (0), weakly deleterious (−1), moderately deleterious (−5, −10) and strongly deleterious (−50, −100) to what is effectively inviable (−500). Classifying selection coefficients this way allowed us to estimate the relative frequencies of selection coefficients (the DFE) without making assumptions about the shape of the distribution. We estimated the DFE independently for each of the three lineages in the unrooted phylogeny. Figure 1A shows the inferred DFE for D. melanogaster and D. simulans, color-coded by selection coefficient. We do not present the results of the analysis of selection for the D. yakuba lineage because it was based on a single sequence, the reference genome [36].

The DFE gives the frequency with which new non-synonymous mutations occur. For both D. melanogaster and D. simulans, the vast majority of new non-synonymous mutations (81% and 71% respectively) have strongly deleterious fitness consequences, to the extent that they are effectively inviable (γ = −500). Thus, most sites are essentially completely constrained in the amino acid that they encode. Mutations with less severe deleterious effects are progressively less common for γ = −100, −50, −10 and −5. There is an increase in the frequency of weakly selected and neutral mutations, with for 6.1% and 3.8% of new mutations in the two lineages respectively. Moderately beneficial mutations are less common −1.5% and 3.0% of new mutations have γ = 5 or 10 in the two lineages – while strongly beneficial mutations (γ = 50, 100) are the rarest of all with a combined frequency of 0.2% and 0.3%. Interestingly, we found that, with 99% posterior probability, at least 0.7% of newly arising non-synonymous mutations in D. melanogaster (and 1.9% in D. simulans) were moderately or strongly beneficial. The DFE is strikingly similar in the two lineages, with a slight tendency towards stronger selective effects in D. simulans, excluding the inviable class.
The rate at which mutations fix, relative to their neutral expectation, is given by . Consequently, the DFE of amino acid substitutions (Figure 1B) is enriched for beneficial mutations and greatly depleted of deleterious mutations. In both D. melanogaster and D. simulans, moderately and strongly beneficial mutations dominate the substitution process (80% and 91% of substitutions in the two lineages respectively), despite their rarity among mutations. The DFE of amino acid substitutions is similar for both lineages, albeit with a somewhat greater contribution from weakly beneficial, neutral and weakly deleterious mutations in D. melanogaster.
Smith and Eyre-Walker [10] classified amino acid substitutions into neutral substitutions expected under drift (which we label D0) and an excess of beneficial mutations driven by positive selection (which we label A+), assuming that deleterious mutations cannot fix and beneficial mutations contribute negligibly to polymorphism. Since we relax those assumptions, we can break down substitutions further into a class of beneficial mutations that would have fixed merely by drift (D+) and a class of deleterious mutations that fixed in spite of selection (D–). Figure 2 shows the frequency of each type of substitution. The vast majority of substitutions −77% in D. melanogaster and 86% in D. simulans – were beneficial and driven by selection. This finding corresponds well to estimates obtained by other methods for these two lineages [33]. In total 88% and 95% of substitutions were beneficial and driven by drift or selection. Just 4.2% and 1.7% of substitutions were deleterious, as expected almost all weakly so (γ = −1).

Other parameters shared across genes are reported in Table 1. To account for variation in synonymous diversity between loci, we fitted a log-normal distribution to the population-scaled mutation rates θ with parameters μθ and σθ. The estimates of these parameters yield a mean of θ = 31.7 per kilobase and a standard deviation of 13.2. The estimated branch length, T, was considerably longer for D. melanogaster than D. simulans (3.60 versus 1.48 PNe generations). Assuming the same generation length and mutation rate per generation, this suggests the D. simulans population has been larger on average than the D. melanogaster population since they split, which is consistent with the propensity towards stronger selection in the DFE. The transition:transversion ratio κ was similar in D. melanogaster and D. simulans (2.66 and 2.38 respectively).
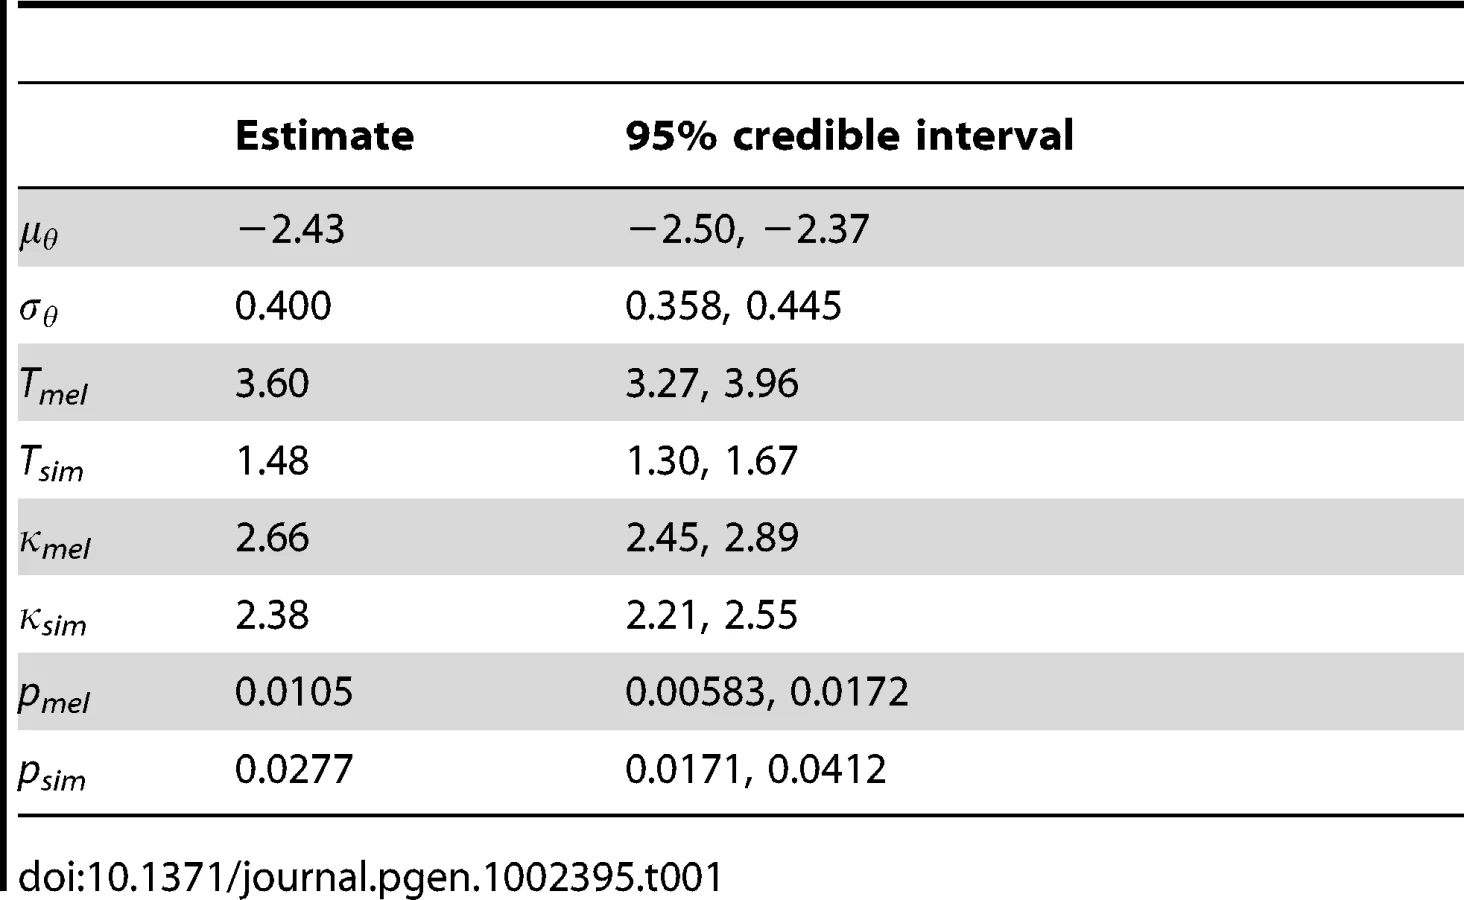
A smoothing parameter, p, for intragenic variation in selection coefficients was estimated independently for each lineage. The inverse of mean window length, p was estimated to be 0.0105 in D. melanogaster and 0.0277 in D. simulans, which corresponds to mean window lengths of 96 and 36 codons respectively. This difference may reflect the response of the smoothing parameter to the larger number of polymorphic sites in D. simulans, which means there is more information available. The inferred DFE is influenced somewhat by the sliding window length, and this is illustrated in Figure S2. In the extreme cases that p = 1 and p = 0, windows correspond to single codons or whole genes respectively; we refer to these two models as sitewise and genewise. Under the sitewise model, we tend to infer weaker selection in the DFE of non-synonymous mutations and amino acid substitutions. The DFE under the genewise model is rather more similar to the sliding window model, except there is an even greater frequency of effectively inviable mutations (γ = −500). The proportion of substitutions that were beneficial and driven by positive selection (the A+ class) is robust to window length, but under the sitewise model, there is a smaller fraction of neutral and deleterious mutations driven by drift (the D0 and D – classes). As the 95% credible intervals for the smoothing parameters excluded p = 1 and p = 0 for both D. melanogaster and D. simulans, we can conclude that the data support the sliding window model over both the sitewise and genewise models.
While our model does not account for linkage disequilibrium and demographic change, these are known to have shaped patterns of genetic diversity in D. melanogaster and D. simulans (e.g., [33], [37]), and can influence the inference of selection from allele frequency information [8], [38], [39]. Text S6 reports the results of simulations [40] that we performed to investigate the effects of these forces using demographic scenarios and recombination rates estimated for Drosophila [33], [37]. We found that the demographic changes may cause slight underestimation of the frequency of moderately beneficial mutations in D. simulans, but the overall effect was weak, indicating robustness to this model violation. We found that the low levels of linkage disequilibrium observed in D. melanogaster and D. simulans led to no additional bias beyond that induced by the demographic change (Figure S6).
Localizing the Signal of Selection
In addition to estimating the frequency of selection coefficients across all codons (the DFE), our method yields codon-specific posterior probabilities for each selection coefficient, allowing the signal of selection to be localized. At a particular codon, there are a number of ways to summarize the distribution of selection coefficients including the probability of positive selection, the probability of viability, and the mean selection coefficient given that the codon is viable. Whole gene versions of these summary statistics can be calculated by taking the mean across codons. Figure 3 shows the evidence for positive selection across genes and sites, where genes are ordered horizontally according to the rank of the posterior probability of positive selection per gene.

Much of the variability in the evidence for positive selection at the whole gene level can be understood in terms of the entries of the McDonald-Kreitman table (Figure 3A). The ratio of the relative number of non-synonymous to synonymous substitutions (DN/DS), and the corresponding quantity for polymorphisms (PN/PS) are both strongly correlated with the probability of positive selection per gene (Spearman rank correlation coefficients of 0.81 and 0.72 respectively in D. melanogaster, 0.70 and 0.75 respectively in D. simulans). Surprisingly however, the odds ratio underlying the MK test, (DN PS)/(DS PN), was uncorrelated with the probability of positive selection (Spearman rank correlations of 0.06 in D. melanogaster and −0.09 in D. simulans). Of the three statistics summarizing the distribution of selection coefficients per gene, the largest correlation was between the probability of positive selection and the mean selection coefficient conditional on viability (Spearman rank correlations of 0.92 and 0.91 in D. melanogaster and D. simulans respectively), followed by the correlation between the mean selection coefficient conditional on viability and the probability of viability (0.15 and 0.43), and lastly between the probability of positive selection and the probability of viability (0.15 and 0.26). The relationship of these statistics and the odds ratio is shown in Figure 3B.
A comparison of the probability of positive selection at the level of the whole gene versus the individual codon (Figure 3C) suggests that positive selection is not restricted to the few genes with the strongest signal of selection; rather it has affected sites in many genes, particularly in D. simulans, most of which are unexceptional by whole gene metrics. By using site-specific evidence for selection, we can look for unusual signatures of selection outside the usual dichotomy of adaptation versus constraint. For example, we can detect genes with a stark contrast in intragenic selection pressures owing to the occurrence of adaptation against the backdrop of widespread constraint.
On the basis of evidence at the whole gene level, protein-coding gene CG32568, of unknown function but highly expressed in adult male testes, exhibited the greatest degree of adaptation while CG3869, the ubiquitously expressed mitochondrial assembly regulatory factor Marf, exhibited the greatest degree of constraint. Based on evidence at the level of individual codons, CG1824, a ubiquitously expressed gene of unknown function, exhibited the starkest contrast in selection pressures between codons in D. melanogaster. Figure 4 illustrates intragenic variation in the posterior probability of positive selection for these three genes, annotated by the positions of synonymous and non-synonymous substitutions and polymorphisms. The complete absence of non-synonymous polymorphism or substitution in CG3869 (Figure 4A), in conjunction with considerable synonymous diversity, results in strong evidence against positive selection throughout the gene. CG1824 (Figure 4B) is similarly conserved for most of its length with two exceptions. A Val→Ile polymorphism in D. melanogaster results in a small peak in the posterior probability of positive selection at position 13, associated with a slight increase in the probability of positive selection at nearby sites owing to the sliding window model. While there is a 23% probability that this polymorphism, which coincidentally has sample frequency 23%, is positively selected, it may simply be a neutral (Pr = 31%) or deleterious (Pr = 46%) mutation that has reached appreciable frequency by drift. At position 112 there has been a Ser→His substitution in the D. simulans lineage that provides considerably greater evidence for the action of positive selection (Pr = 95%). Again, there is a slight increase in the probability of positive selection at nearby sites as a consequence of the sliding window model, but in the absence of other non-synonymous diversity nearby, the effect decays rapidly.

On balance, the evidence is in favor of positive selection at the non-synonymous substitution in D. simulans but against positive selection at the non-synonymous polymorphism in D. melanogaster because the former has a posterior probability greater than 50% and the latter does not. We use a 50% threshold for concluding that positive selection has acted because the prior probability is specified by the DFE that we explicitly estimated across all sites (rather than making strong prior assumptions about the relative frequency of beneficial, neutral and deleterious mutations). The fact that positively selected sites are estimated to be very rare in the DFE means that our prior probability of positive selection is very low, demanding considerable evidence to the contrary in order to surpass the threshold of 50% posterior probability.
The frequency of non-synonymous polymorphisms influences the evidence for positive selection, as illustrated by Figure S3. While the evidence for positive selection generally increases with the frequency of a derived non-synonymous mutation, in D. melanogaster this alone was barely sufficient to surpass a 50% probability of positive selection even with derived allele frequencies of 75% or more. In D. simulans, however, a non-synonymous derived allele frequency exceeding 75% provided more compelling evidence of positive selection. The reasons for these differences are multifarious and include the observation that the estimated DFE has a tendency towards stronger selection in D. simulans. Non-synonymous substitutions provide altogether stronger evidence for positive selection, and the large number in CG32568 in both D. melanogaster and D. simulans lineages contribute to the strong signal of adaptation (Figure 4C). Their abundance also raises the background probability of positive selection in CG32568 for both species as a result of the sliding window model. Figures S4 and S5 offer an alternative visualization of the codon-by-codon posterior distribution of selection coefficients in D. melanogaster and D. simulans respectively for CG32790, a transcription factor of unknown function that is expressed more or less ubiquitously, CG1824 and CG32568.
Spatial and Temporal Changes in Selection Pressure
The sliding window model is designed to detect local correlation structure in selection coefficients and to infer the scale over which the selection regime varies spatially along the genome. It was found to fit the data better than either the sitewise or genewise models on the basis that the 95% credible intervals exclude p = 1 and p = 0 (Figure S2D). The influence of the sliding window model was visually apparent in the local estimates of selection coefficients within individual genes (Figure 4). Figure 5 shows the spatial correlation in the posterior distribution of selection coefficients aggregated over all genes, up to a maximum distance of 220 codons. With the exception of the inviable sites (γ = −500), which were assumed to occur independently of the sliding window, the posterior probability distribution of selection coefficients is highly correlated for adjacent codons. The magnitude of the spatial correlation is greatest for strongly deleterious mutations, and weakest for strongly beneficial mutations, suggesting that regions of constraint tend to be longer than regions of adaptation. As the distance between codons increases, the correlation decreases initially smoothly, and then more erratically as the number of pairs of codons involved in the calculation decreases. The spatial correlation tails off more rapidly in D. simulans, as expected from its shorter mean window length of 36 versus 96 codons. Even at distances of 220 codons, there is still substantial correlation in the posterior probabilities for each selection class, indicating that distant sites within the same gene are substantially more similar in selection profile than sites in different genes.

The selection coefficients in the different Drosophila lineages were assumed independent of one another, yet an appreciable correlation in the posterior probability distribution of selection coefficients was detectable between sites across D. melanogaster and D. simulans (Table 2). By comparing the correlation in the distribution of selection coefficients between the two species, we can examine how the selection regime has changed over evolutionary time (Figure S7). For selection coefficients γmel and γsim, a positive correlation in the posterior probabilities indicates an excess of sites (purple triangles). A particularly large positive correlation is seen for strongly deleterious mutations, suggesting that sites strongly constrained in one species tend to be strongly constrained in both. There is a corresponding deficit of sites strongly deleterious in one species but not the other, as evidenced by negative correlation coefficients (orange triangles). For concordant selection coefficients (both positive or both negative across species), an excess of sites was observed for which the magnitude of selection was greater in D. simulans, consistent with other evidence for a larger effective population size in that lineage [33]. Among discordant selection coefficients, there was a small excess of sites weakly beneficial in D. melanogaster yet deleterious in D. simulans. The cause of this pattern is unclear, but see [41] for similar observations.

Discussion
Our method has a number of advantages over predominantly population genetics-based approaches [18], [20], [38], [39], [42], [43]. By fitting a complex, multi-parameter mutation model with repeat and back mutation, coding sequences can be directly analyzed without pooling alleles or discarding codons with more than two alleles, and discarding allele frequency information. Ancestral states are inferred probabilistically instead of by parsimony, thereby accounting for uncertainty [44]. In the analysis of polymorphism data, the advantage over phylogenetic methods [29], [30], [45]–[47] is the bottom-up model that accounts for the expected contrast between short-term and long-term evolutionary processes [16]. This is important because top-down applications of phylogenetic models to polymorphism data [31], [35] can give the misleading impression of a relaxation of functional constraint in contemporary diversity [48], [49]. In turn, the advantage of the sliding window model is that it allows inference of fine-scale variation in selection pressures by combining information across adjacent sites for statistical efficiency, but in a way that adapts to the local signal of variation in selection coefficients.
The distribution of fitness effects (DFE) is of direct interest in describing the selection regime experienced by a species. Moreover, it is important to estimate the DFE rather than making prior assumptions about its shape, as it has a strong influence on local inference of selection within genes [50]. Other methods that use allele frequency information to estimate the DFE have assumed parametric forms for the distribution, such as a gamma distribution for deleterious mutations [38], or a reflected gamma distribution [6] or normal distribution for beneficial and deleterious mutations [8]. Initial technical problems in fitting a normal and other standard distributions to the DFE by MCMC led us to switch to a discrete, non-parametric distribution defined by the relative frequency of twelve fitness classes ranging from strongly beneficial to strongly deleterious and effectively inviable. The resulting DFE estimated for the Drosophila coding regions looked quite unlike commonly used parametric forms (Figure 1), which may explain the difficulty in fitting. Application of the method to other datasets will determine whether the form of the DFE is a peculiarity of the Drosophila data or more widespread.
We made a number of simplifying assumptions in our model, amongst them that the population size is constant, that sites are independent, and that synonymous mutations are neutral. Keightley and Eyre-Walker [38], [39] and Boyko et al [6] have made advances in the co-estimation of selection and demographic change from allele frequencies. Key to their approaches is the use of computational techniques to obtain the distribution of allele frequencies when the population size changes. Presently, those techniques rely on the assumption of biallelic loci. Since the development of multiallelic models was one of our goals, a similar approach is currently out of our reach. As no method can hope to encompass all aspects of the evolutionary process, perhaps not even all the important ones, it seems reasonable to use simulations [40] in conjunction with our method to test robustness to departures from modeling assumptions. For the data analyzed in this paper, simulations suggested that demographic changes may cause slight underestimation of the frequency of moderately beneficial mutations in D. simulans.
The assumption of independence between sites is equivalent to assuming that sites, even adjacent sites, are completely unlinked. In fact the assumption is stronger than that since it also implies that there will be no effect of Hill-Robertson interference caused by selection acting at other loci [51]. Although the assumption of independence between sites is common in the analysis of allele frequency information [6], [8], [15], [42], [53], [38], it is of concern because selection at linked sites can skew allele frequencies at synonymous sites and may lead to false inference of selection [42]. By conducting simulations that model linkage disequilibrium [37], we were able to test the robustness of our conclusions to this assumption under recombination rates estimated for Drosophila [37]. Recombination rates are relatively high in the genes analyzed here. Perhaps as a result, simulations suggested that linkage did not have a large effect on our inference of the DFE. This conclusion is consistent with other investigations [8].
The classification of mutations as either non-synonymous or synonymous is a useful proxy for predicting whether mutations are likely to have a functional effect or not. However, in Drosophila it is well known that synonymous mutations are not strictly neutral [52]. In particular, there can be selection between codons encoding the same amino acid, thought to be attributable to differences in the efficiency of translation, mediated by the abundance of different tRNAs. The excess number of synonymous substitutions on the D. melanogaster lineage has been attributed to the relaxation of constraint on codon usage as a result of a reduction in the effective population size [33], implying that the difference in the branch lengths of the D. melanogaster and D. simulans lineages (Table 1) is accounted for primarily by a change in effective population size, but secondarily by the reduction in constraint on synonymous diversity in D. melanogaster. In the future, it may be possible to incorporate differences in the fitness of synonymous mutations into our multiallelic model.
Another simplification made during inference is to measure fitness relative to the ancestral allele. A widespread convenience common to NY98 and PRF [29], [18], measuring fitness relative to the ancestor avoids estimating selection coefficients for every possible allele, most of which go unobserved. However, it has some peculiar consequences that are often overlooked. Under positive selection (γ>0), the ancestral allele is always disfavored, creating a continual drive for innovation. One could characterize such a model as recurrent directional selection because, as in shift models [54], the selection regime switches upon fixation, setting up an arms race-like scenario. Under negative selection (γ<0), when derived alleles are disfavored, the behavior of the model is also peculiar. Were a mildly deleterious allele to fix by drift (in spite of selection), then upon fixation the selection regime would switch and rather than the back mutation restoring fitness as one might expect, it would erode it further. The convenience of models of recurrent selection has made them popular for inference and thus a natural starting point for our work. Nonetheless, it would be interesting to see what effect relaxing this assumption has on inference of selection parameters.
Methods
Combining Population Genetics and Phylogenetics Models
We use three steps to combine a population genetics model of the distribution of allele frequencies in a population or species with a phylogenetic model of the substitution process between species. The first step is to modify the stationary distribution of allele frequencies in the population by conditioning on the identity of the ancestral allele. Let f be a vector of the frequencies of K alleles at a site (typically, K = 4 nucleotides, 20 amino acids or 61 non stop codons), where . To condition the stationary distribution, , on the identity of the ancestral allele, A, we use Bayes' rule(1)where is the probability that allele A is ancestral given f, and is the unconditional probability that A is ancestral.
The second step is to integrate over uncertainty in the population allele frequencies in order to obtain the conditional likelihood for a sample given the identity of the ancestral allele. Let x be a vector of the number of times each allele was observed at a particular site in a sample of size n, so that . Then(2)where is an appropriate sampling distribution; for example the multinomial distribution when alleles are sampled at random from the population with replacement.
The third step is to sum over uncertainty in the identity of the ancestral allele of all modern populations and ancestral populations in order to calculate a joint likelihood for the observed data. On the phylogenetic tree relating our populations of interest, the tips represent modern populations that were sampled directly, and the internal nodes represent ancestral populations that were not. Felsenstein's pruning algorithm [55] makes calculation of the phylogenetic likelihood straightforward, by separating the computation into manageable chunks. The algorithm traverses the tree from tips to root, calculating , defined as the likelihood of the data observed in all populations descended from node k, conditional on ancestral allele sk at node k. For node k whose immediate descendants are nodes i and j,(3a)where vi is the length of the branch separating node i from its ancestor, and is the phylogenetic transition probability from allele sk to si along that branch. The joint likelihood is calculated as(3b)where is the probability that allele s0 is ancestral. In the standard phylogenetic setting, is defined at the tips to equal 1 if the sequence corresponding to that tip has allele sk, and 0 otherwise [55]. In our setting, where multiple sequences may have been sampled from the population represented by a tip, we define(3c)where is the vector of allele sample frequencies in population k and the right hand formula is specified by Equation 2. Our extended pruning algorithm incorporates uncertainty in the ancestral state of modern populations at the tips of the tree. Thus it would differ from Felsenstein's algorithm even when there was a single sequence for each tip because we account for the possibility that the sequence may contain derived as well as ancestral alleles.
Multiallelic PIMS Model
In this section we construct a combined population genetics-phylogenetics model with parent independent mutation and selection (PIMS) as the basis for an approximation to more general mutation in the next section. In parent-independent mutation, any allele can mutate to any other allele and the mutation rate is dependent only on the destination allele. The rate of mutation to allele i is μi per generation.
The Wright-Dirichlet distribution is the solution to the stationary distribution of allele frequencies in a diffusion model with PIMS, assuming that fitness effects and mutation rates are small relative to the effective population size Ne [56], [57]. In our notation,(4)where is the population fitness as a function of f, is its population-scaled counterpart, is the population-scaled rate of mutation to allele i, and P is the ploidy.
For tractability of inference and computation, we concentrate on models with two fitness classes, which we refer to as hot-or-not models. In the hot-or-not model, alleles belonging to the favored (hot) class have selective advantage s over other alleles; in a codon model, the two classes can be defined according to the amino acid encoded. In the hot-or-not model, the Wright-Dirichlet distribution simplifies to(5)where is the population-scaled selection coefficient, Fi is the total frequency of alleles encoding the same amino acid as allele i, and H represents an allele belonging to the hot class.
We use the time-reversibility property to equate the probability that allele A is ancestral to the fixation probability, which for analytic tractability we approximate as the low-mutation limit [58](6)We assume recurrent selection, in which the hot class comprises derived alleles encoding amino acids different to that encoded by the ancestral allele. Consequently, the sign of the population-scaled selection coefficient γ represents the selective advantage of mutations relative to the ancestral allele. From Equation 1,(7)where is the multivariate beta function and is the confluent hypergeometric function. Assuming random sampling according to the multinomial distribution we use Equation 2 to obtain the conditional likelihood(8)where XA and ΘA are the total number of copies and total mutation rate for alleles encoding the same amino acid as the ancestral codon, and Θ is the total mutation rate across all alleles (see Text S1 for a full derivation).
The phylogenetic substitution rate specified by the population genetic model is well approximated by taking the limit that the initial frequency of a derived allele tends to zero [18], [35] so that for ,(9)The diagonal elements of the phylogenetic rate matrix are defined so that the rows sum to zero. Time is measured in units of PNe generations. At equilibrium, the allele frequencies are ; that they are independent of γ is a consequence of the recurrent selection model. The phylogenetic substitution matrix required by the extended pruning algorithm (Equation 3) is obtained by exponentiating the rate matrix using standard numerical techniques, so that .
Multiallelic PDMS Model
In this section we utilize our PIMS model to approximate a general model of parent-dependent mutation with selection (PDMS), in which the mutation rate can differ between every pair of alleles. The approximation to PDMS that we take exploits the observations that (1) the conditional likelihood is dependent on the ancestral allele and (2) the ancestral allele will often be the genetic background upon which new mutations arise. Therefore we can modify the mutation rates in the likelihood formula (Equation 8) to suit the allelic state of the ancestral allele, re-weighting the rates to depend on the ancestral background. In Text S2 we detail the approach. Briefly, we match the rates for a parent-independent and a parent-dependent model by using average mutation probabilities, in which we calculate the expected probability of mutation from the ancestral allele A to every other allele, averaging over the coalescent time between two individuals in a neutral population.
We use our parent-dependent approximation to implement a codon-based analog to the HKY85 model [34]. In a codon-based HKY85 model the alleles are the K = 61 non stop codons, and the population-scaled mutation rate for is(10)where C normalizes the rate matrix so that the expected mutation rate is θ/2 per PNe generations. The diagonal elements of the matrix are defined so that the rows sum to zero. Over phylogenetic timescales, the substitution process for this population genetic model converges to the Nielsen and Yang model [29] commonly used for analyses of selection. The phylogenetic substitution process has stationary distribution π and (following Equation 9) rate matrix(11)where is equal to the DN/DS rate parameter that they call ω.
Owing to the approximations made in the development of likelihood functions for PIMS and PDMS models, we wished to evaluate the performance of this multiallelic selection model in a number of scenarios and over a range of parameter values. In Text S3 and Figure S8 we use simulations to examine the effect of the definition of allelic ancestry in the multiallelic setting on the accuracy of the approximate likelihood. In Text S4 and Figure S9 we test the performance of the approximate likelihood for inference over a range of parameter values: θ = 0.02–0.2, κ = 0.05–20 and γ drawn from a normal distribution centered on zero with a standard deviation of 10.
Sliding Window Model for Variation in Selection Pressure
For the analysis of intragenic variation in selection pressure, we adopted a sliding window model similar to that used by omegaMap [31]. In the sliding window model of omegaMap, it is assumed that there are contiguous blocks or windows within the locus, such that all non-synonymous mutations arising within the window share the same selection coefficient. We modify this approach by allowing, with some probability, the non-synonymous mutations at any site to possess a selection coefficient different to that of the window.
We model the distribution of selection coefficients, also known as the distribution of fitness effects (DFE) [4] using a discrete range of values of γ. We define two classes of selection coefficient, G1 and G2, containing Γ1 and Γ2 levels of γ each. The first class provides values of γ that the window as a whole may take, and the second class provides values of γ that individual codons may take independently of the window within which they are situated. We specified Γ1 = 11, G1 = {−100, −50, −10, −5, −1, 0, 1, 5, 10, 50, 100}, which encompasses the spectrum of fitness effects from strongly deleterious, through moderately and weakly deleterious, neutral, weakly and moderately beneficial to strongly beneficial. We specified Γ2 = 1, G2 = {−500}, a strength of selection that corresponds effectively to inviability. The rationale for this approach was to allow individual sites within a window to be inviable, while maintaining a spatial dependency at viable sites.
The DFE is then given by the vectors λ1 and λ2, which together sum to 1. λ1i is the probability that a codon takes on the selection coefficient of its window, and the window has selection coefficient G1i. λ2i is the probability that a codon takes on a selection coefficient different to its window, and that selection coefficient is G2i. is the total probability that a codon takes on the selection coefficient of its window. is the total probability that a codon takes on a selection coefficient different from its window.
The length of windows is geometrically distributed and controlled by the smoothing parameter p, which is the probability that one window ends and another begins between a pair of adjacent codons. The average length of a window is 1/p. When p is smaller, windows are longer, which leads to greater smoothing in the estimates of variation in selection coefficients along the gene. At one extreme, p = 0, there is a single window per locus. Sites may be viable or inviable; those that are viable share the same selection coefficient. This “genewise” model, is equivalent to that used in the standard PRF [18], [20]. At the other extreme, p = 1, every codon has its own independent γ. This “sitewise” model features frequently in approaches based on the site frequency spectrum (although these tend to be based on nucleotides rather than codons) [e.g. 8], [38], [39]. Both genewise and sitewise models have been implemented in codeml [29], [30].
Analysis of Drosophila X-linked Coding Sequences
We analyzed the 100 X-linked coding sequences of Drosophila melanogaster and Drosophila simulans [33]. We include the Drosophila yakuba reference sequence [36] in the analysis to help attribute substitutions to the melanogaster or simulans branches. Each locus corresponds to a single exon from a single gene. The average length of coding sequence per locus was 630 base pairs.
We parameterized each of the three branches of the unrooted phylogeny separately. Employing the multiallelic model (codon-based HKY85 with selection), we estimated the distribution of fitness effects λ, the sliding window smoothing parameter p, the transition:transversion ratio κ and the branch length T for each. For each locus we also estimated a branch-specific mutation rate θ and branch - and site-specific selection coefficients γ.
Our approach was Bayesian. For the DFE, we employed a symmetric Dirichlet prior with parameter α = 1 for the prior on λ = {λ1, λ2}. This distribution is equivalent to a -dimensional uniform distribution subject to the constraint that the elements of λ sum to 1. In other words, no fitness class is preferred over any other fitness class. In this sense the prior is uninformative. For the sliding window smoothing parameter p, we assumed a uniform distribution on the interval (0, 1). For a locus of length L codons, this prior gives equal probability to the number of windows between 1 and L. We employed improper log-uniform priors on κ and T, which are uninformative regarding the scale of the parameters in the sense that the prior probability is equal for every order of magnitude. For the branch - and locus-specific mutation rate θ we employed a log-normal prior distribution with mean μθ and variance on the logarithmic scale, which allows variability in θ to be modeled while sharing some information across branches and loci. For the hyperparameters, we assumed an improper uniform prior on μ which is uninformative as to the order of magnitude of θ, and a log-normal prior distribution on with mean 0 and variance 4 which imposes some constraint on the variability of θ across branches and loci in the event that the data are weakly or not informative.
We obtained a sample from the joint posterior distribution of all the parameters using Markov chain Monte Carlo (MCMC), the details of which are described in Text S5. Briefly, we ran two chains for 2,000,000 iterations each, recording the parameters at intervals of 40 iterations. After removing a burn-in of 20,000 iterations, the chains were visually compared for convergence and merged. Point estimates were calculated using the posterior mean, and 95% credible intervals were calculated as the (2.5%, 97.5%) quantiles of the posterior distribution.
The Proportion of Amino Acid Substitutions Driven by Positive Selection
The rate of substitution, relative to neutrality, of mutations with population-scaled selection coefficient γ is . Therefore in the distribution of fitness effects of amino acid substitutions, the frequency of selection coefficient Gi, where is(12)
For γ>0, ω is greater than 1, so there is an excess of amino acid substitution relative to neutrality [10]. Hence for beneficial mutations we attribute a proportion to the action of positive selection (class A+), and the remaining proportion , which we would have expected under neutrality, we attribute to drift (class D+). The fixation of neutral mutations is attributable to drift (class D0). Likewise, the fixation of deleterious mutations, which occurs at a lower rate than expected under neutrality, is attributable to drift acting in spite of purifying selection (class D–).
Software
Source code and executables for the software, gammaMap, are available online at www.danielwilson.me.uk.
Supporting Information
Zdroje
1. TinbergenN 1963 On aims and methods of ethology. Zeitschrift für Tierpsychologie 20 410 433
2. GouldSJLewontinRC 1979 The spandrels of San Marco and the Panglossian paradigm. Proc Roy Soc Lond B 205 581 598
3. KimuraM 1983 The Neutral Theory of Molecular Evolution. Cambridge University Press, Cambridge
4. Eyre-WalkerAKeightleyPD 2007 The distribution of fitness effects of new mutations. Nat Rev Genet 8 610 618
5. SellaGPetrovDPrzeworskiMAndolfattoP 2009 Pervasive natural selection in the Drosophila genome? PLoS Genet 5 e1000495 doi:10.1371/journal.pgen.1000495
6. PiganeauGEyre-WalkerA 2003 Estimating the distribution of fitness effects from DNA sequence data: implications for the molecular clock. Proc Natl Acad Sci USA 100 10335 10340
7. YampolskyLYKondrashovFAKondrashovAS 2005 Distribution of the strength of selection against amino acid replacements in human proteins. Hum Mol Genet 14 3191 3201
8. BoykoARWilliamsonSHIndapARDegenhardtJDHernandezRD 2008 Assessing the evolutionary impact of amino acid mutations in the human genome. PLoS Genet 4 e1000083 doi:10.1371/journal.pgen.1000083
9. FayJCWuCI 2000 Hitchhiking under positive Darwinian selection. Genetics 155 1405 1413
10. SmithNGCEyre-WalkerA 2002 Adaptive protein evolution in Drosophila. Nature 415 1022 1024
11. AndolfattoP 2007 Hitchhiking effects of recurrent beneficial amino acid substitutions in Drosophila melanogaster. 17 1755 1762
12. MacphersonJMSellaGDavisJCPetrovDA 2007 Genomewide spatial correspondence between nonsynonymous divergence and neutral polymorphism reveals extensive adaptation in Drosophila. Genetics 177 2083 2099
13. GiladYBustamanteCDLancetDPääboS 2003 Natural selection on the olfactory receptor gene family in humans and chimpanzees. Am J Hum Genet 73 489 501
14. SabetiPCSchaffnerSFFryBLohumuellerJVarillyP 2006 Positive natural selection in the human lineage. Science 312 1614 1620
15. WilliamsonSHHubiszMJClarkAGPayseurBABustamanteCD 2007 Localizing recent adaptive evolution in the human genome. PLoS Genet 6 e90 doi:10.1371/journal.pgen.0030090
16. McDonaldJHKreitmanM 1991 Adaptive protein evolution at the Adh locus in Drosophila. Nature 351 652 654
17. KimuraM 1977 Preponderance of synonymous changes as evidence for the neutral theory of molecular evolution. Nature 267 275 276
18. SawyerSAHartlDL 1992 Population genetics of polymorphism and divergence. Genetics 132 1161 1176
19. CharlesworthB 1994 The effect of background selection against deleterious mutations on weakly selected, linked variants. Genet Res 63 213 227
20. BustamanteCDNielsenRSawyerSAOlsenKAPuruggananMD 2002 The cost of inbreeding in Arabidopsis. Nature 416 531 534
21. BustamanteCDFledel-AlonAWilliamsonSNielsenRHubiszMT 2005 Natural selection on protein-coding genes in the human genome. Nature 437 1153 1157
22. SawyerSAKulathinalRJBustamanteCDHartlDL 2003 Bayesian analysis suggests that most amino acid replacements in Drosophila are driven by positive selection. J Mol Evol 57 S154 S164
23. SawyerSAParschJZhangZHartlDL 2007 Prevalence of positive selection among nearly neutral amino acid replacements in Drosophila. Proc Natl Acad Sci USA 104 6504 6510
24. BainesJFSawyerSAHartlDLParschJ 2008 Effects of X-linkage and sex-biased gene expression on the rate of adaptive protein evolution in Drosophila. Mol Biol Evol 25 1639 1650
25. FayJWycoffGJWuC-I 2001 Positive and negative selection on the human genome. Genetics 158 1227 1234
26. CharlesworthJEyre-WalkerA 2008 The McDonald-Kreitman test and slightly deleterious mutations. Mol Biol Evol 25 1007 1015
27. NielsenRBustamanteCDClarkAGGlanowskiSSacktonTB 2005 A scan for positively selected genes in the genomes of humans and chimpanzees. PLoS Biol 3 e170 doi:10.1371/journal.pbio.0030170
28. DoningerSWKimHSSwainDCorcueraDWilliamsM 2008 A catalog of neutral and deleterious polymorphism in yeast. PLoS Genet 4 e1000183 doi:10.1371/journal.pgen.1000183
29. NielsenRYangZ 1998 Likelihood models for detecting positively selected amino acid sites and applications to the HIV-1 envelope gene. Genetics 148 929 936
30. YangZ 2007 PAML 4: phylogenetic analysis by maximum likelihood. Mol Biol Evol 24 1586 1591
31. WilsonDJMcVeanG 2006 Estimating diversifying selection and functional constraint in the presence of recombination. Genetics 172 1411 1425
32. KernADHausslerD 2010 A population genetic hidden Markov model for detecting genomic regions under selection. Mol Biol Evol 27 1673 1685
33. AndolfattoPWongKMBachtrogD 2011 Effective population size and the efficacy of selection on the X chromosomes of two closely related Drosophila species. Genome Biol Evol 3 114 128
34. HasegawaMKishinoHYanoT 1985 Dating of the human-ape splitting by a molecular clock of mitochondrial DNA. J Mol Evol 22 160 174
35. NielsenRYangZ 2003 Estimating the distribution of selection coefficients from phylogenetic data with applications to mitochondrial and viral DNA. Mol Biol Evol 20 1231 1239
36. Drosophila 12 Genomes Consortium 2007 Evolution of genes and genomes on the Drosophila phylogeny. Nature 450 203 218
37. HaddrillPRThorntonKRCharlesworthBAndolfattoP 2005 Multilocus patterns on nucleotide variability and the demographic and selection history of Drosophila melanogaster populations. Genome Res 15 790 799
38. KeightleyPDEyre-WalkerA 2007 Joint inference of the distribution of fitness effects of deleterious mutations and population demography based on nucleotide polymorphism frequencies. Genetics 177 2251 2261
39. Eyre-WalkerAKeightleyPD 2009 Estimating the rate of adaptive molecular evolution in the presence of slightly deleterious mutations and population size change. Mol Biol Evol 26 2097 2108
40. HernandezRD 2008 A flexible forward simulator for populations subject to selection and demography. Bioinformatics 24 2786 2787
41. CallahanBNeherRABachtrogDAndolfattoPShraimanBI 2011 Correlated evolution of nearby residues in Drosophilid proteins. PLoS Genet 7 e1001315 doi:10.1371/journal.pgen.1001315
42. BustamanteCDWakeleyJSawyerSHartlDL 2001 Directional selection and the site-frequency spectrum. Genetics 159 1779 1788
43. DonnellyPNordborgMJoyceP 2001 Likelihoods and simulation methods for a class of nonneutral population genetics models. Genetics 159 853 867
44. HernandezRDWilliamsonSHBustamanteCD 2007 Context dependence, ancestral misidentification, and spurious signatures of natural selection. Mol Biol Evol 24 1792 1800
45. YangZNielsenR 2002 Codon-substitution models for detecting molecular adaptation at individual sites along specific lineages. Mol Biol Evol 19 908 917
46. ZhangJNielsenRYangZ 2005 An improved branch-site likelihood method for detecting positive selection at the molecular level. Mol Biol Evol 22 2472 2479
47. RonquistFHuelsenbeckJP 2003 MRBAYES 3: Bayesian phylogenetic inference under mixed models. Bioinformatics 19 1572 1574
48. HoSYShapiroBPhillipsMJCooperADrummondAJ 2007 Evidence for time dependency of molecular rate estimates. Syst Biol 56 515 522
49. KryazhimskiySPlotkinJ 2008 The population genetics of dN/dS. PLoS Genet 4 e1000304 doi:10.1371/journal.pgen.1000304
50. LiYFCostelloJCHollowayAKHahnMW 2008 “Reverse ecology” and the power of population genomics. Evolution 62 2984 2994
51. HillWGRobertsonA 1966 The effect of linkage on limits to artificial selection. Genet Res 8 269 294
52. PlotkinJBKudlaG 2011 Synonymous but not the same: the causes and consequences of codon bias. Nat Rev Genet 12 32 42
53. DesaiMMPlotkinJB 2008 The polymorphism frequency spectrum of finitely many sites under selection. Genetics 180 2175 2191
54. OhtaTGillespieJH 1996 Development of neutral and nearly-neutral theories. Theor Popul Biol 49 128 142
55. FelsensteinJ 1973 Maximum likelihood and minimum-steps methods for estimating evolutionary trees from data on discrete characters. Syst Zool 22 240 249
56. WrightS 1949 Adaptation and selection. JepsonGLSimpsonGGMayrE Genetics, Paleontology and Evolution Princeton University Press 365 389
57. WattersonGA 1977 Heterosis or neutrality? Genetics 85 789 814
58. KimuraM 1955 Stochastic processes and distribution of gene frequencies under natural selection. Cold Spring Harbor Symp Quant Biol 20 33 55
Štítky
Genetika Reprodukční medicínaČlánek vyšel v časopise
PLOS Genetics
2011 Číslo 12
Nejčtenější v tomto čísle
- Targeted Proteolysis of Plectin Isoform 1a Accounts for Hemidesmosome Dysfunction in Mice Mimicking the Dominant Skin Blistering Disease EBS-Ogna
- The RNA Silencing Enzyme RNA Polymerase V Is Required for Plant Immunity
- The FGFR4-G388R Polymorphism Promotes Mitochondrial STAT3 Serine Phosphorylation to Facilitate Pituitary Growth Hormone Cell Tumorigenesis
- Target Site Recognition by a Diversity-Generating Retroelement