
MAPK/ERK Signaling Regulates Insulin Sensitivity to Control Glucose Metabolism in
The insulin/IGF-activated AKT signaling pathway plays a crucial role in regulating tissue growth and metabolism in multicellular animals. Although core components of the pathway are well defined, less is known about mechanisms that adjust the sensitivity of the pathway to extracellular stimuli. In humans, disturbance in insulin sensitivity leads to impaired clearance of glucose from the blood stream, which is a hallmark of diabetes. Here we present the results of a genetic screen in Drosophila designed to identify regulators of insulin sensitivity in vivo. Components of the MAPK/ERK pathway were identified as modifiers of cellular insulin responsiveness. Insulin resistance was due to downregulation of insulin-like receptor gene expression following persistent MAPK/ERK inhibition. The MAPK/ERK pathway acts via the ETS-1 transcription factor Pointed. This mechanism permits physiological adjustment of insulin sensitivity and subsequent maintenance of circulating glucose at appropriate levels.
Published in the journal:
. PLoS Genet 7(12): e32767. doi:10.1371/journal.pgen.1002429
Category:
Research Article
doi:
https://doi.org/10.1371/journal.pgen.1002429
Summary
The insulin/IGF-activated AKT signaling pathway plays a crucial role in regulating tissue growth and metabolism in multicellular animals. Although core components of the pathway are well defined, less is known about mechanisms that adjust the sensitivity of the pathway to extracellular stimuli. In humans, disturbance in insulin sensitivity leads to impaired clearance of glucose from the blood stream, which is a hallmark of diabetes. Here we present the results of a genetic screen in Drosophila designed to identify regulators of insulin sensitivity in vivo. Components of the MAPK/ERK pathway were identified as modifiers of cellular insulin responsiveness. Insulin resistance was due to downregulation of insulin-like receptor gene expression following persistent MAPK/ERK inhibition. The MAPK/ERK pathway acts via the ETS-1 transcription factor Pointed. This mechanism permits physiological adjustment of insulin sensitivity and subsequent maintenance of circulating glucose at appropriate levels.
Introduction
The insulin signaling pathway is a highly conserved regulatory network coordinating animal metabolism and growth with nutritional status. In mammals, energy metabolism is regulated by insulin, and tissue growth by insulin-like growth factors (IGFs), through their respective receptors (for review see [1]). Drosophila has a single insulin-like receptor protein (InR), which is activated by a family of insulin-like peptides (ILPs) and mediates physiological responses related to both metabolism and growth (for review see [2]). InR stimulation leads to activation of the phosphatidylinositol 3-kinase (PI3K)/AKT pathway. AKT is recruited to the plasma membrane through phosphatidylinositol-3,4,5-triphosphate (PIP3), which is generated by phosphorylation of PI-4,5-P2 by PI3K (for review see [3]). Membrane-recruited AKT is activated through phosphorylation by PDK1 and by TOR complex 2 [4]–[6]. AKT has several downstream effectors, including FOXO, a Forkhead transcription factor. AKT-mediated phosphorylation promotes retention of FOXO in the cytoplasm, thereby limiting FOXO activity [7]. AKT also promotes the activity of TOR complex 1 by phosphorylating two of its upstream regulators, TSC2 and PRAS40 [8]–[11].
Insulin signaling is involved in homeostatic regulation, gradually adjusting physiological processes in response to variable nutritional conditions. This tuning mode of regulation differs from many developmental signaling pathways, which produce a limited range of outputs (e.g. cell fate). Therefore, it is perhaps not surprising that cellular insulin sensitivity is modulated by input from other signaling pathways. For example, TORC1-regulated S6 kinase (S6K) inhibits expression of the IRS scaffold proteins, which are recruited to activated insulin/IGF receptors, thereby making cells more insulin resistant [12], [13]. Inflammatory signals, on the other hand, are known to cause insulin resistance by c-Jun N-terminal kinase-mediated phosphorylation of the IRS proteins (for review see [14]). This is likely to contribute to the pathogenesis of type 2 diabetes.
While regulation of insulin sensitivity is clearly of physiological importance, identifying novel regulatory mechanisms through genetic screens has been challenging due to the need for a sensitive readout that is also amenable to large-scale screening. The Drosophila eye provides such a system. Because insulin signaling limits FOXO activity, overexpression of FOXO can challenge the regulatory capacity of the insulin pathway, creating a sensitized genetic background [6], [15]. Using this strategy to identify in vivo modulators of insulin pathway activity, we have uncovered a novel regulatory mechanism influencing insulin sensitivity. We show that the extracellular signal-regulated kinase (ERK)/MAP kinase signaling pathway (for review see [16]) influences cellular insulin responsiveness controlling the expression of the insulin-like receptor (inr) gene. This transcriptional regulation is mediated through the Ets-1 orthologue, Pointed, a transcription factor regulated by the MAPK/ERK pathway [17]. This mechanism provides a means for integration of signaling input via the Epidermal growth factor receptor (EGFR)-regulated MAPK/ERK with insulin-like signaling to control systemic glucose homeostasis.
Results/Discussion
MAPK/ERK pathway modulates insulin-induced cellular responses
To identify novel modulators of insulin-like signaling we screened for modifiers of FOXO overexpression, which produces small rough eyes. This phenotype has earlier been shown to respond to changes in insulin-like signaling in a highly sensitive manner [6], [15]. As insulin-like signaling is a known regulator of growth, we focused on screening RNAi lines that had earlier shown tissue undergrowth in a wing-based screen ([18], Figure S1). Our screen identified the PI3K gene, which serves as a positive control. The screen also identified kinase suppressor of ras (ksr) as an enhancer of the FOXO gain-of-function phenotype. Downregulation of ksr by RNAi enhanced the FOXO phenotype, but on its own, did not reduce eye size (Figure 1A, quantified in Figure 1B). The lack of an obvious eye phenotype resulting from ksr depletion alone presumably reflects the magnitude of KSR downregulation generated with the GMR-GAL4 driver during the phase of eye imaginal disc growth. Enhancement of the FOXO overexpression phenotype was also observed when one copy of the ksr gene was removed (Figure S2). Removing one copy of the ksr gene on its own did not reduce eye size, indicating the utility of the sensitized background to identify subtle modulators of pathway activity.

FOXO is regulated at multiple levels, including nuclear localization [7]. FOXO is nuclear in cells devoid of growth factors, but upon insulin stimulation FOXO accumulates in the cytoplasm through AKT-mediated phosphorylation ([7]; Figure 1C) As expected, RNAi-mediated depletion of PI3K limited the insulin-induced shift toward cytoplasmic FOXO. Depletion of KSR by RNAi produced a similar effect (Figure 1C; representative images in Figure S3).
Does KSR act via AKT or does a parallel pathway override AKT-mediated FOXO regulation? To address this, we monitored insulin-induced activation of AKT. Depletion of KSR suppressed insulin-induced phosphorylation of the activating ‘hydrophobic motif’ site S505 on AKT (Figure 2A). The known functions of KSR are related to MAPK/ERK activation [19], [20]. To ask if changes in the canonical MAPK/ERK pathway would explain the KSR effect on insulin signaling, we depleted D-MEK (MAP kinase kinase). This produced an effect comparable to that of KSR (Figure 2B). Insulin-induced AKT activation involves increase in the level of plasma membrane phosphoinositide PIP3 through the activity of PI3K [3]. To assess PIP3 levels, we used a GFP-linked pleckstrin homology (PH) domain from GRP1 [21]. Insulin treatment induced prominent membrane accumulation of the GRP1-PH domain, which was prevented by depletion of PI3K (Figure 2C). Similarly, RNAi-mediated depletion of KSR reduced membrane localization of GRP1-PH in response to insulin.

To test whether other downstream targets of AKT besides FOXO were affected by MAPK/ERK inhibition, we analyzed phosphorylation of S6K, a target of TORC1 [22]. Insulin-induced phosphorylation shifts some of the S6K protein into a ladder of slower migrating forms [e.g. [23]], which was reduced by depletion of KSR or D-MEK (Figure 2D). In both experiments the effects were comparable to depletion of PI3K. To test, whether MAPK/ERK signaling affected PI3K activity independent of insulin, we overexpressed activated PI3K in the absence of insulin stimulation and monitored AKT phosphorylation. In this setting, knockdown of KSR had no influence on pathway activity (Figure S4). In sum, these data suggest that reduced MAPK/ERK activity lowers sensitivity to insulin stimulation, but does not hamper PI3K from activating AKT.
MAPK/ERK regulates inr gene expression via the ETS-1 transcription factor Pointed
The data above suggested that MAPK signaling regulates the insulin-like pathway above the level of PI3K. We therefore sought to monitor InR expression level as well as activation making use of a shift in its electrophoretic mobility caused by phosphorylation (Figure 3A, lanes 1 and 4). Surprisingly, we found that depletion of KSR led to a reduction in the total level of InR protein. This was observed in both insulin-treated and untreated cells. Depletion of PI3K did not produce a comparable effect. To confirm that InR expression is regulated by the canonical MAPK/ERK pathway, we silenced the expression of Raf and D-MEK, which also showed reduced InR expression (Figure 3B). Increasing MAPK/ERK pathway activity acts in the opposite direction: depletion of Gap1, the GTPase activator of RAS, led to activation of MAPK/ERK signaling visualized by phospho-specific antibody against the active form of ERK (Figure 3C) as well as elevated InR expression (Figure 3B). Thus, regulation of InR appears to be a specific MAPK/ERK pathway effect and InR levels are sensitive to both positive and negative changes in the MAPK/ERK activity.

How does MAPK/ERK signaling affect InR expression? Using quantitative RT-PCR we observed a significant reduction in the levels of the mature inr mRNA and the unspliced inr primary transcript upon KSR depletion in S2 cells (Figure 3D). The reduction in inr primary transcript levels upon KSR depletion suggests that MAPK/ERK activity is likely to regulate inr transcription. If so, we would expect transgene-directed expression of inr to be refractory to the effects of MAPK pathway modulation. This proved to be the case. A transfected version of inr under control of a heterologous promoter was insensitive to KSR depletion (Figure 4A). As an in vivo test we used GMR-Gal4 as a heterologous promoter to direct expression of a UAS-InR transgene in the eye. Under these conditions, KSR depletion did not enhance the FOXO overexpression phenotype (Figure 4B, 4C). The insensitivity of transgene-directed InR to the effects of KSR depletion is consistent with the hypothesis of a mechanism involving control of endogenous inr transcription.

pointed (pnt) encodes an ETS-1 transcription factor that is activated by MAPK/ERK through phosphorylation of a conserved threonine residue, T151 [24], [25]. We tested its involvement in the regulation of inr expression by depletion of Pointed from S2 cells by RNAi. This caused a prominent reduction of inr mRNA (Figure 5A). To narrow down the regulatory region of the inr gene we systematically analyzed >20 kb upstream of the inr coding region by preparing a series of luciferase reporter constructs (Figure S5), which lead to identification of a minimal cis-regulatory region of 0.8 kB (Figure 5B). Overexpression of Pointed-P2 in S2 cells increased reporter activity directed by this 0.8 kB region (Figure 5C). This fragment contained one site perfectly matching the consensus Pointed binding site (5′-(C/G)(A/C/G)GGA(A/T)(A/G)-3′; [26]). Mutating the consensus site reduced the ability of Pointed to induce reporter expression (Figure 5C), suggesting binding to this site contributes to Pointed-mediated regulation of inr gene expression. Reciprocally, Pointed depletion in S2 cells led to a decrease in the level of InR protein (Figure 5D), and to a reduction of insulin-induced AKT S505 phosphorylation (Figure 5E).
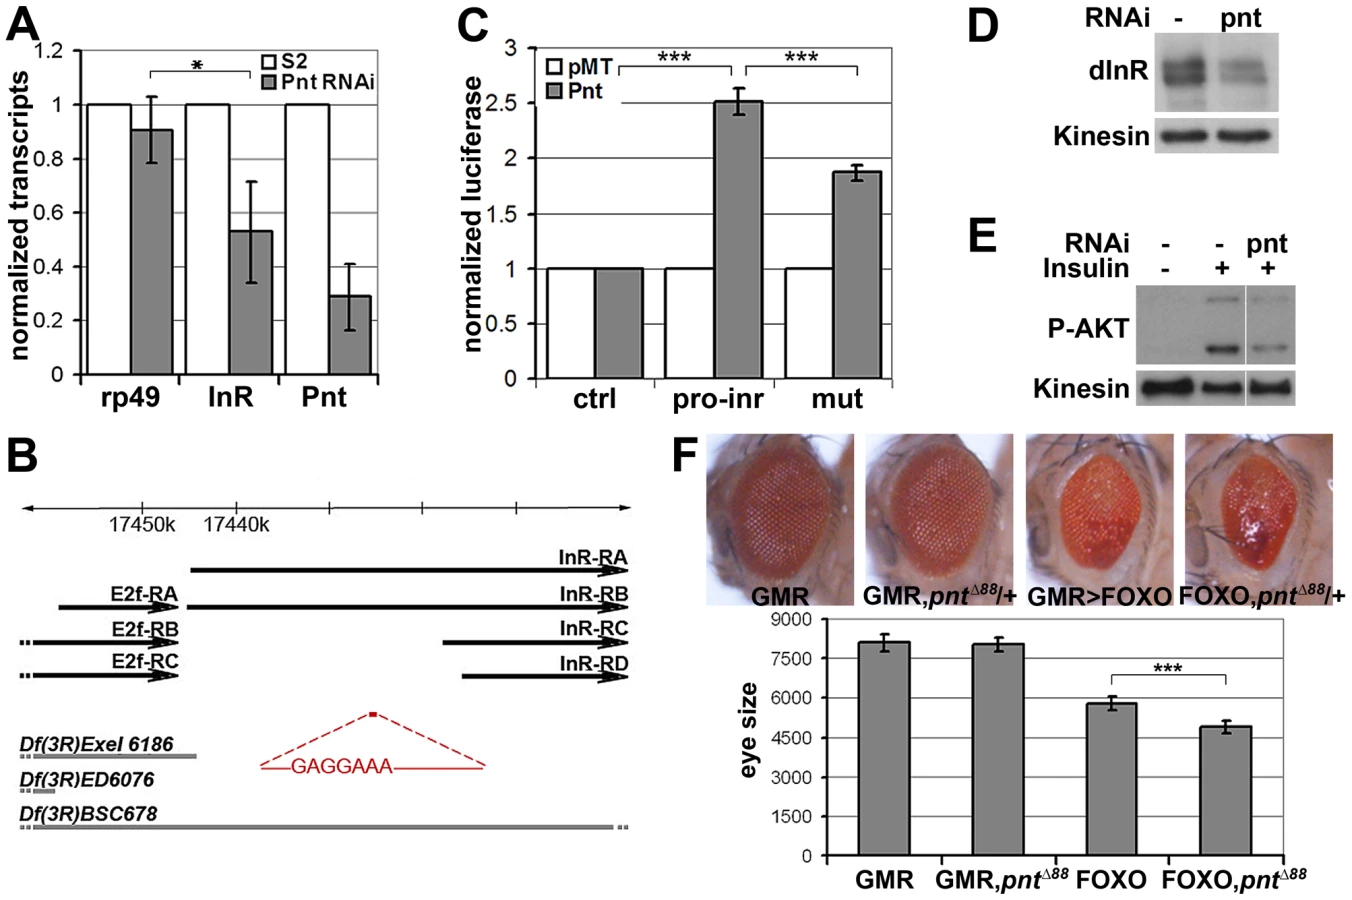
To further test this relationship in vivo, we asked whether reducing pointed levels would influence the severity of the FOXO overexpression phenotype. Removing one copy of the pointed gene using three independent alleles modestly but significantly enhanced the FOXO overexpression phenotype in the eye (Figure 5F, Figure S6). These findings suggest that the MAPK/ERK pathway acts via the Ets-1 transcription factor Pointed to control cellular insulin sensitivity.
MAPK/ERK regulates inr gene expression to control glucose metabolism
To begin to explore the physiological role of regulation of InR levels by the MAPK/ERK pathway in vivo, we performed a survey of larval tissues and found that KSR depletion led to significant reduction of inr transcript levels in imaginal discs and larval fat body, Drosophila equivalent of liver and adipose tissue (Figure 6A). KSR depletion also led to a reduction of InR protein levels (Figure 6B) as well as nuclear FOXO accumulation in the larval fat body (Figure 6C). MAPK/ERK signaling can be regulated by a variety of receptor tyrosine kinases (RTKs). We next made use of pumpless-GAL4 to manipulate RTK activity. Pumpless is active mainly in the fat body, but also other tissues, such as parts of larval gut. Inhibition of Epidermal growth factor (EGF) signaling by expression of a dominant negative form of EGFR (dnEGFR) led to downregulation of inr mRNA (Figure 6D) and protein levels (Figure 6E) in the isolated fat body. This suggests that EGFR is a physiologically relevant upstream regulator of MAPK/ERK-mediated control in Inr expression in vivo.

Systemic regulation of InR activity has been shown to influence metabolic homeostasis [reviewed in [27]]. In this context, the effects of KSR depletion on inr expression and FOXO localization in fat body were suggestive of a link to energy metabolism. To ask whether reduction of inr to half of normal levels was sufficient to cause a metabolic disturbance, we made use of larvae carrying one copy of the deletion Df(3R)BSC678, which fully removes the inr gene (Figure 5B). Quantitative RT-PCR was used to confirm that inr mRNA levels were reduced to ∼50% in these animals (Figure 7A). Notably, this result indicates that there is little or no feedback from InR signaling on inr expression, and suggests that there is limited output from InR via the MAPK pathway in Drosophila. In addition, we observed that flies with modestly reduced inr levels showed impaired capacity to limit FOXO activity in the eye (Figure S7).

Larvae lacking one copy of the inr gene showed no significant change in levels of stored glycogen and triglycerides or trehalose (Figure S8), a circulating disaccharide synthesized by the fat body through glycogenolysis ([28]). However, levels of circulating glucose in the hemolymph were substantially increased (Figure 7B), suggesting compromised clearance of dietary glucose from the circulation. To ask whether this phenotype could be achieved by independent genetic means, we used pumpless-GAL4 to drive expression of a UAS-inrRNAi transgene to deplete InR (Figure 7C). These animals showed elevated glucose in their hemolymph, verifying that regulation of InR levels is physiologically important in vivo in maintaining levels of circulating glucose. This conclusion was further supported by the finding that InR overexpression modestly, but significantly, decreased levels of circulating glucose (Figure S9). These findings are consistent with what has been reported in flies in which the ability to produce insulin-like peptides was compromised by genetic ablation of the insulin-producing neurosecretory cells [29]. These flies showed a prominent metabolic change at the level of circulating glucose levels [29]. Similarly, insulin signaling in mammals regulates glucose uptake and reduced insulin sensitivity is linked to hyperglycemia, metabolic syndrome and type-2 diabetes [30], [31].
To test whether MAPK/ERK-regulation of InR expression is involved in maintaining systemic glucose homeostasis, we assessed the effects of KSR RNAi. Depletion of KSR led to elevated levels of circulating glucose (Figure 7D). If the effect of KSR depletion is due to reduced InR levels, we would expect restoring inr expression under Gal4 control to lower glucose levels toward normal. This proved to be the case (Figure 7D). As expected, expression of a dnEGFR using pumpless-GAL4 driver also resulted in elevated circulating glucose (Figure 7E). The glucose levels were restored by simultaneous overexpression of Pointed, which is in agreement with the view that Pointed acts as a downstream effector of the pathway (Figure 7F). These observations suggest a physiological role for EGFR-MAPK/ERK-Pointed activity in control of glucose homeostasis via regulation of InR levels.
The insulin signal transduction pathway is regulated by cross-talk from several other signaling pathways. This includes input from the amino-acid sensing TOR pathway into regulation of insulin pathway activity by way of S6 kinase regulating IRS [12]–[14]. Signaling downstream of growth factor receptors has also been linked to regulation of insulin signaling [32], [33]. The active form of the small GTPase Ras can bind to the catalytic subunit of PI3K and promote its activity. Expression of a form of PI3K that cannot bind Ras allows insulin signaling, but at reduced levels [33]. The work reported here provides evidence for a second mechanism through which growth factor receptor signaling through the MAPK/ERK pathway modulates insulin pathway activity. Transcriptional control of inr gene expression by EGFR signaling may provide a means to link developmental signaling to regulation of metabolism. In this context, we noted a statistically significant correlation between EGFR target gene sprouty and inr gene expression at different stages during Drosophila development (Figure S10).
Several steps of the insulin pathway can be regulated by phosphorylation. Given that the MAPK/ERK pathway is a kinase cascade, a priori, the possibility of phosphorylation-based interaction between these pathways would seem likely. However, this appears not to be the case. Acute pharmacological inhibition of the MAPK/ERK pathway proved to have no impact on insulin pathway activity (Figure S11). Thus short-term changes in MAPK/ERK pathway activity do not seem to be used for transient modulation of insulin pathway activity. Instead, the MAPK/ERK pathway acts through the ETS-1 type transcription factor Pointed to control expression of the inr gene. Transcriptional control of inr suggests a slower, less labile influence of the MAPK pathway. Taken together with the earlier studies [32], [33], our findings suggest that growth factor signaling can regulate insulin sensitivity by both transient and long-lasting mechanisms.
Why use both short-term and long-term mechanisms to modulate insulin responsiveness to growth factor signaling? The use of direct and indirect mechanisms that elicit a similar outcome is reminiscent of feed-forward network motifs [34]. Although these motifs are often thought of in the context of transcriptional networks, the properties that they confer are also relevant in the context of more complex systems involving signal transduction pathways. In multicellular organisms, feed-forward motifs are often used to make cell fate decisions robust to environmental noise [35]. Our findings suggest a scenario in which a feed-forward motif is used in the context of metabolic control, linking growth factor signaling to insulin responsiveness. In this scenario, growth factor signaling acts directly via RAS to control PI3K activity and indirectly via transcription of the inr gene to elicit a common outcome – sensitization of the cell to insulin. This arrangement allows for a rapid onset of enhanced insulin sensitization, followed by a more stable long-lasting change in responsiveness. Thus a transient signal can both allow for an immediate as well as a sustained response. The transcriptional response also makes the system stable to transient decreases in steady-state growth factor activity. We speculate that this combination of sensitivity and stability allows responsiveness while mitigating the effects of noise resulting from the intrinsically labile nature of RTK signaling. As illustrated by our data, failure of this regulation in the fat body leads to elevated circulating glucose levels, likely reflecting impaired clearance of dietary glucose from the circulation by the fat body. Maintaining circulating free glucose levels low is likely to be important due to the toxic effects of glucose [28]. In contrast, circulating trehalose, glycogen or triglyceride levels showed no significant change in animals with reduced InR expression, suggesting that these aspects of energy metabolism can be maintained through compensatory mechanisms in conditions of moderately impaired insulin signaling.
Earlier studies by Puig and coworkers have shown that the transcription of the inr gene is under dynamic control [36], [37]. Activation of FOXO in the context of low insulin signaling leads to upregulation of inr transcription, thus constituting a feedback regulatory loop. Thus, InR expression appears to be under control of two receptor-activated cues, which have opposing activities: inr expression is positively regulated by the EGFR-MAPK/ERK module, but negatively regulated by its own activity on FOXO. In the setting of this study, the cross-regulatory input from the MAPK/ERK pathway was found to dominate over the autoregulatory FOXO-dependent mechanism. If conditions exist in which the FOXO-dependent mechanism was dominant, we would expect to observe a limited potential for crossregulation by the MAPK/ERK pathway. Whether Pointed and FOXO display regulatory cooperativity at the inr promoter is an intriguing question for future study.
Materials and Methods
Fly strains
UAS-InR, pntΔ88, pnt07825, UAS-Pnt-P2, ksrS-627, Df(3R)Exel6186, Df(3R)ED6076 and Df(3R)BSC678 flies were obtained from the Bloomington Stock Center. UAS-RNAi-PI3K, UAS-RNAi-KSR and UAS-RNAi-InR lines were from the Vienna Drosophila RNAi center. pUAST-FOXO-GFP flies were provided by Aurelio Teleman. pUAST-dnEGFR flies were provided by Pernille Rørth. pntT5 flies were provided by Christian Klämbt.
Cell culture and treatments
S2 cells were grown at 25°C in SFM (Gibco) supplemented with L-glutamine. dsRNA was prepared using MegascriptT7 (Ambion) with the following templates: PI3K, nucleotides 358–857 of Pi3K92E coding sequence (FBpp0083348); ksr, nt 2224–2710 (FBpp0078413); D-MEK, nt 961–1191 of the ORF plus the first 83 nt of the 3′UTR (FBtr0071313); Raf, nt 522–912 (FBpp0110324);GAP1, nt 153–646 (FBpp0076096); pnt, nt 1541–1957 (718AA isoform, FBpp0088658); GFP, nt 17–633 of EGFP2, was used as control. S2 cells were treated with 37 nM dsRNA. Cells were transfected using effectene reagent (QIAGEN) with pMT-GAL4, pUAST-FOXO-GFP or pUAST-Myc-Dp110CAAX, or pMT-GFP-PH or pMT-InR-Flag or pMT-Pnt-P2. 0.7 mM CuSO4 was used to induce FOXO, Dp110, GFP-PH, InR or Pnt expression after transfection. The following primers were used to clone InR-Flag into pMT vector with EcoRI, NotI and XhoI sites by fusion: 5′-GGTACCTACTAGTCCAGTGTGGTGGAATTCATGTTCAATATGCCACGGGGAGTGAC-3′; 5′ - TTCGAAGGGCCCTCTAGACTCGAGCGGCCGCTTACTTGTCATCGTCGTCCTTGTAGTCCGCCTCCCTTCCGATGAATCCA-3′; 5′ - ACGTTGCGCTCGAGCCAGAGCTCGA-3′ and 5′ - TCGAGCTCTGGCTCGAGCGCAACGT-3′. The primers used to clone pntp2 into pMT-Myc by SLIC at EcoRI site were: forward, 5′-AGTGCAACTAAAGGGGAATTCATGGAATTGGCGATTTGTAAAACAG-3′; reverse, 5′ - GATAAGCTTCTGCTCGAATTCATCCACATCTTTTTTCTCAATCTTAAG-3′. The primers used to clone the inr gene regulatory region into pGL3-Basic at HindIII and XhoI sites were: forward, 5′ - GCGTGCTAGCCCGGGCTCGAGTGAGAGTTTCATGTGTCAGA -3′; reverse, 5′ - AAGCTTACTTAGATCGCAGATGTTAATTGCACAGCAAGCTC-3′. The primers used to mutate the predicted Pnt consensus site with QuickChange II XL kit were: forward, 5′-GAGAATGCCGGAGATGAAGACGCGAACGAAGATGAAGTCGATG-3′; reverse, 5′ - CATCGACTTCATCTTCGTTCGCGTCTTCATCTCCGGCATTCTC-3′.
Cell imaging
For FOXO-GFP localization, live S2 cells were imaged using a Leica SP5 confocal microscope. Images were taken of random fields within 15 min after 10 µg/ml insulin boost for 30 min and scored for GFP localization (scoring was done ‘blind’). For GFP-PH images were taken within 10 min after 10 µg/ml insulin boost for 5 min. The ratio of membrane to cytoplasmic GFP levels was measured as pixel intensity along the white line as indicated in Figure 2C (left panel). For fat body FOXO immunofluorescent staining, newly hatched 1st instar larvae were seeded at 50/vial and reared at 25°C. Wandering 3rd instar larvae were dissected. Tissues were fixed in PBS with 4% paraformaldehyde at room temperature for 20 min. Anti-FOXO antibody [36] was used at 1∶1000 dilution. Fat body connected with salivary gland was imaged using a Zeiss LSM700 confocal microscope.
Immunoblotting
Cells were homogenized in SDS sample buffer, boiled and resolved by SDS-PAGE before transfer to nitrocellulose membranes for antibody labeling. Antibodies to phospho-S505-AKT, AKT, P-InR and Myc were from Cell Signaling Technology. Anti-Kinesin was from Cytoskeleton. Phospho-ERK antibody was from Sigma. Anti-S6K is described in [38]. Anti-dInR is described in [37].
Quantitative RT–PCR
Total RNA was extracted from S2 cells using QIAGEN RNeasy Mini Kit and treated with On-Column DNase (QIAGEN RNase-Free DNase Set) at room temperature for 15 min to eliminate genomic DNA contamination. Reverse transcription to synthesize the first strand used oligo-dT primers and Superscript RT-III (Invitrogen). PCR was performed using POWER SYBR GREEN Master Mix (Applied Biosystems) and analyzed on Applied Biosystems 7500 fast real-time PCR system. Results were normalized to Kinesin mRNA, and rp49 was used as a control. The following primers were used: Kinesin-f, 5′-GCTGGACTTCGGTCGTAGAG-3′; Kinesin-r, 5′ - CTTTTCATAGCGTCGCTTCC-3′; rp49-f, 5′ - GCTAAGCTGTCGCACAAA-3′; rp49-r, 5′ - TCCGGTGGGCAGCATGTG-3′; InR-f, 5′ - CTGGTGGTGCTGACAGAGAA-3′; InR-r, 5′ - GCAGCTGACAACTGGCATTA-3′; pri-InR-f, 5′ - CAAGAGACAGCAACAAAAGG-3′; pri-InR-r, 5′ - GCTTGCATGTGTTGGTGAGC-3′; KSR-f, 5′ - AGCCGAGCGAAGATTGTAAA-3′; KSR-r, 5′ - TCCCGATACATGCCTACACA-3′; pnt-f, 5′ - CGATGCGAATGCCTACTACACG-3′; pnt-r, 5′ - TGCTGGTGTTGTAGCCTGAAC-3′.
Metabolic analysis
Newly hatched 1st instar larvae were seeded at 50/vial and reared at 25°C. Hemolymph was extracted from wandering stage 3rd instar larvae. 2 µl of pooled hemolymph was diluted with 8 µl Tris buffered saline (pH 6.6) and incubated at 70°C for 5 min before clarification by centrifugation at 20 000×g for 1 min. Glucose was measured in 6 µl supernatant using the GAGO-20 kit (Sigma) and normalized to the same amount of TBS as blank control. For trehalose measurement, supernatant was incubated with 7.5 µg trehalase (Sigma) overnight at 37°C and measured using GAGO-20 kit as well. For glycogen and triglyceride measurements, 3rd instar larvae were homogenized using Sartorius Potter-S tissue homogenizer in water with 0.05% Tween. Supernatant was collected after 5 min of heat inactivation at 70°C and centrifugation at 13000 rpm for 3 min. Glycogen and protein levels were measured using Glycogen assay kit (Bio Vision) and Bio-Rad protein assay reagent, respectively. Triglyceride was measured using Sigma Triglyceride kit. Data were normalized to total protein.
Supporting Information
Zdroje
1. ManningBDCantleyLC 2007 AKT/PKB signaling: navigating downstream. Cell 129 1261 1274
2. HietakangasVCohenSM 2009 Regulation of tissue growth through nutrient sensing. Annu Rev Genet 43 389 410
3. EngelmanJALuoJCantleyLC 2006 The evolution of phosphatidylinositol 3-kinases as regulators of growth and metabolism. Nat Rev Genet 7 606 619
4. SarbassovDDGuertinDAAliSMSabatiniDM 2005 Phosphorylation and regulation of Akt/PKB by the rictor-mTOR complex. Science 307 1098 1101
5. HreskoRCMuecklerM 2005 mTOR.RICTOR is the Ser473 kinase for Akt/protein kinase B in 3T3-L1 adipocytes. J Biol Chem 280 40406 40416
6. HietakangasVCohenSM 2007 Re-evaluating AKT regulation: role of TOR complex 2 in tissue growth. Genes Dev 21 632 637
7. HuangHTindallDJ 2007 Dynamic FoxO transcription factors. J Cell Sci 120 2479 2487
8. InokiKLiYZhuTWuJGuanKL 2002 TSC2 is phosphorylated and inhibited by Akt and suppresses mTOR signalling. Nat Cell Biol 4 648 657
9. PotterCJPedrazaLGXuT 2002 Akt regulates growth by directly phosphorylating Tsc2. Nat Cell Biol 4 658 665
10. SancakYThoreenCCPetersonTRLindquistRAKangSA 2007 PRAS40 is an insulin-regulated inhibitor of the mTORC1 protein kinase. Mol Cell 25 903 915
11. Vander HaarELeeSIBandhakaviSGriffinTJKimDH 2007 Insulin signalling to mTOR mediated by the Akt/PKB substrate PRAS40. Nat Cell Biol 9 316 323
12. HarringtonLSFindlayGMGrayATolkachevaTWigfieldS 2004 The TSC1-2 tumor suppressor controls insulin-PI3K signaling via regulation of IRS proteins. J Cell Biol 166 213 223
13. ShahOJWangZHunterT 2004 Inappropriate activation of the TSC/Rheb/mTOR/S6K cassette induces IRS1/2 depletion, insulin resistance, and cell survival deficiencies. Curr Biol 14 1650 1656
14. YangRTrevillyanJM 2008 c-Jun N-terminal kinase pathways in diabetes. Int J Biochem Cell Biol 40 2702 2706
15. JungerMARintelenFStockerHWassermanJDVeghM 2003 The Drosophila forkhead transcription factor FOXO mediates the reduction in cell number associated with reduced insulin signaling. J Biol 2 20
16. ShaulYDSegerR 2007 The MEK/ERK cascade: from signaling specificity to diverse functions. Biochim Biophys Acta 1773 1213 1226
17. O'NeillEMRebayITjianRRubinGM 1994 The activities of two Ets-related transcription factors required for Drosophila eye development are modulated by the Ras/MAPK pathway. Cell 78 137 147
18. GenevetAWehrMCBrainRThompsonBJTaponN 2010 Kibra is a regulator of the Salvador/Warts/Hippo signaling network. Dev Cell 18 300 308
19. RoyFLabergeGDouziechMFerland-McColloughDTherrienM 2002 KSR is a scaffold required for activation of the ERK/MAPK module. Genes Dev 16 427 438
20. AnselmoANBumeisterRThomasJMWhiteMA 2002 Critical contribution of linker proteins to Raf kinase activation. J Biol Chem 277 5940 5943
21. BrittonJSLockwoodWKLiLCohenSMEdgarBA 2002 Drosophila's Insulin/PI3-Kinase Pathway Coordinates Cellular Metabolism with Nutritional Conditions. Dev Cell 2 239 249
22. WullschlegerSLoewithRHallMN 2006 TOR signaling in growth and metabolism. Cell 124 471 484
23. GaoXZhangYArrazolaPHinoOKobayashiT 2002 Tsc tumour suppressor proteins antagonize amino-acid-TOR signalling. Nat Cell Biol 4 699 704
24. O'NeillEMRebayITjianRRubinGM 1994 The activities of two Ets-related transcription factors required for Drosophila eye development are modulated by the Ras/MAPK pathway. Cell 78 137 147
25. BrunnerDDuckerKOellersNHafenEScholzH 1994 The ETS domain protein pointed-P2 is a target of MAP kinase in the sevenless signal transduction pathway. Nature 370 386 389
26. RogersEMBrennanCAMortimerNTCookSMorrisAR 2005 Pointed regulates an eye-specific transcriptional enhancer in the Drosophila hedgehog gene, which is required for the movement of the morphogenetic furrow. Development 132 4833 4843
27. TelemanAA 2010 Molecular mechanisms of metabolic regulation by insulin in Drosophila. Biochem J 425 13 26
28. BeckerASchloderPSteeleJEWegenerG 1996 The regulation of trehalose metabolism in insects. Experientia 52 433 439
29. BroughtonSJPiperMDIkeyaTBassTMJacobsonJ 2005 Longer lifespan, altered metabolism, and stress resistance in Drosophila from ablation of cells making insulin-like ligands. Proc Natl Acad Sci U S A 102 3105 3110
30. WelshGIHersIBerwickDCDellGWherlockM 2005 Role of protein kinase B in insulin-regulated glucose uptake. Biochem Soc Trans 33 346 349
31. EckelRHAlbertiKGGrundySMZimmetPZ 2010 The metabolic syndrome. Lancet 375 181 183
32. Rodriguez-VicianaPWarnePHDhandRVanhaesebroeckBGoutI 1994 Phosphatidylinositol-3-OH kinase as a direct target of Ras. Nature 370 527 532
33. OrmeMHAlrubaieSBradleyGLWalkerCDLeeversSJ 2006 Input from Ras is required for maximal PI(3)K signalling in Drosophila. Nat Cell Biol 8 1298 1302
34. AlonU 2007 Network motifs: theory and experimental approaches. Nat Rev Genet 8 450 461
35. LiXCassidyJJReinkeCAFischboeckSCarthewRW 2009 A microRNA imparts robustness against environmental fluctuation during development. Cell 137 273 282
36. PuigOMarrMTRuhfMLTjianR 2003 Control of cell number by Drosophila FOXO: downstream and feedback regulation of the insulin receptor pathway. Genes Dev 17 2006 2020
37. PuigOTjianR 2005 Transcriptional feedback control of insulin receptor by dFOXO/FOXO1. Genes Dev 19 2435 2446
38. StewartMJBerryCOZilbermanFThomasGKozmaSC 1996 The Drosophila p70s6k homolog exhibits conserved regulatory elements and rapamycin sensitivity. Proc Natl Acad Sci U S A 93 10791 10796
Štítky
Genetika Reprodukční medicínaČlánek vyšel v časopise
PLOS Genetics
2011 Číslo 12
Nejčtenější v tomto čísle
- Targeted Proteolysis of Plectin Isoform 1a Accounts for Hemidesmosome Dysfunction in Mice Mimicking the Dominant Skin Blistering Disease EBS-Ogna
- The RNA Silencing Enzyme RNA Polymerase V Is Required for Plant Immunity
- The FGFR4-G388R Polymorphism Promotes Mitochondrial STAT3 Serine Phosphorylation to Facilitate Pituitary Growth Hormone Cell Tumorigenesis
- Target Site Recognition by a Diversity-Generating Retroelement