
Genome-Wide Association of Bipolar Disorder Suggests an Enrichment of Replicable Associations in Regions near Genes
Although a highly heritable and disabling disease, bipolar disorder's (BD) genetic variants have been challenging to identify. We present new genotype data for 1,190 cases and 401 controls and perform a genome-wide association study including additional samples for a total of 2,191 cases and 1,434 controls. We do not detect genome-wide significant associations for individual loci; however, across all SNPs, we show an association between the power to detect effects calculated from a previous genome-wide association study and evidence for replication (P = 1.5×10⁻⁷). To demonstrate that this result is not likely to be a false positive, we analyze replication rates in a large meta-analysis of height and show that, in a large enough study, associations replicate as a function of power, approaching a linear relationship. Within BD, SNPs near exons exhibit a greater probability of replication, supporting an enrichment of reproducible associations near functional regions of genes. These results indicate that there is likely common genetic variation associated with BD near exons (±10 kb) that could be identified in larger studies and, further, provide a framework for assessing the potential for replication when combining results from multiple studies.
Published in the journal:
. PLoS Genet 7(6): e32767. doi:10.1371/journal.pgen.1002134
Category:
Research Article
doi:
https://doi.org/10.1371/journal.pgen.1002134
Summary
Although a highly heritable and disabling disease, bipolar disorder's (BD) genetic variants have been challenging to identify. We present new genotype data for 1,190 cases and 401 controls and perform a genome-wide association study including additional samples for a total of 2,191 cases and 1,434 controls. We do not detect genome-wide significant associations for individual loci; however, across all SNPs, we show an association between the power to detect effects calculated from a previous genome-wide association study and evidence for replication (P = 1.5×10⁻⁷). To demonstrate that this result is not likely to be a false positive, we analyze replication rates in a large meta-analysis of height and show that, in a large enough study, associations replicate as a function of power, approaching a linear relationship. Within BD, SNPs near exons exhibit a greater probability of replication, supporting an enrichment of reproducible associations near functional regions of genes. These results indicate that there is likely common genetic variation associated with BD near exons (±10 kb) that could be identified in larger studies and, further, provide a framework for assessing the potential for replication when combining results from multiple studies.
Introduction
Genome-wide association studies (GWAS) have been responsible for the elucidation of hundreds of loci associated with common human diseases, in some cases aiding in the prediction of individual disease susceptibility, but primarily allowing for a better biological understanding of disease [1], [2]. Although effect sizes of associated variants identified in these studies have been small to modest, it has been suggested that many more loci of even smaller effect may be detected with larger datasets [3] based on the distribution of associated variant frequencies and effect sizes and, in the case of height, these non-significant effects can add up to a large proportion of the variance explained [4]. This has been borne out with recent GWAS using hundreds of thousands of individuals [5]–[7]. A challenge is determining whether additional samples are worth genotyping for common variation when initial results with modest sample sizes do not result in genome-wide significant effects. Here, we analyze effects across multiple GWAS with sub-significant P-values to determine whether there is a true underlying genetic signal tagged by common variation present across studies. Since true effects will tend to replicate across studies as a function of power, we can test the hypothesis that there is an underlying genetic signal for a trait by testing whether replication of an association with a variant across studies is a function of the power to detect that variant based on that variant's frequency and effect size as determined from a single study. It has been suggested as an alternative to a Bonferroni-based approach to genome-wide significance that P-values be interpreted in the context of power [8]. We assume that the association statistics in a previous study provide prior information about the potential for replicability of associations, by estimating the power to detect SNP effects from the frequency and effect sizes determined in an initial data set on a SNP-by-SNP basis and then testing associations with those SNPs in a test data set, and can thereby focus on the variation that is most likely to be truly associated.
Bipolar disorder (BD) is a major psychiatric disorder affecting approximately 1% of the population. Patients with BD suffer extreme mood swings between mania and depression, and 17% suicide. BD is highly heritable, but has not easily yielded genetic loci from family and population based mapping strategies [9], [10]. Multiple genome-wide association studies [11]–[14] have highlighted compelling candidates for BD without reaching genome-wide significance. ANK3 and CACNAC1 were identified at genome-wide significance through the combination of multiple GWAS [15], and a meta-analysis identified a region at 3p21.1 associated with a combined sample of individuals with BD or major depressive disorder [16]. Intriguing, however, are results that suggest a shared polygenic basis with schizophrenia, with effects over many loci, each contributing a small effect [17]. By considering the development and application of a multilocus schizophrenia-based genetic risk ‘score’ across many SNPs – many that were not significant in a single locus analysis – Purcell et al. [17] were able to predict BD case-control status with a non-zero probability, indicating a probable polygenic basis for Schizophrenia. In this work, we assess the relationship between the power to detect a SNP based on association statistics observed in one study and replication in another study. We assess this relationship in a way that allows for the assessment of collections of SNPs in defined genomic regions in order to test hypotheses about the nature of genetic variation mediating BD susceptibility.
We apply this strategy to new BD GWAS data to show that it is possible to identify replicable genetic signals in circumscribed regions of the genome that would not be captured by single locus analyses in a single GWAS data set at genome-wide significance levels. Essentially, we assess the consistency of effects at different loci across studies by calculating the power to detect an effect in a “discovery” study and comparing the results to observed associations in a “test” study. Power encompasses both allele frequency and penetrance or effect size, and therefore is a single measure of the likelihood of replication. If there is a true underlying signal common to the two datasets that is tagged by common variation interrogated in the genotyping chips used in the studies, then one would expect to see greater evidence for replication at loci for which there is greater power to detect an effect. If there were no true underlying signal, one would expect to see no association between power calculated from an initial study's findings and replication in an independent data set. Because we characterize trends across many SNPs without identifying individually significant effects, this approach has similarities to the false discovery rate [18] approach, but uses an unrelated study to prioritize markers.
Results
We first considered the results of an association study involving 1,190 newly genotyped BD cases from the Bipolar Genome Study (BiGS) and 401 controls, referred to as the ‘TGEN’ sample (Table S1). These samples were collected through the same mechanisms as 1,001 cases and 1,033 controls of European Ancestry genotyped through the GAIN initiative [12]. However, while most of the samples in GAIN were collected as part of extended families or sib-pairs, the TGEN samples were primarily selected without regard to family history. We combined the GAIN and TGEN samples, for a total of 2,191 BD cases and 1,434 controls. We performed GWAS (Figure S1) and report the top regions at P<10−5 (Table S2 and Figure S2). Although none of the associations reached genome-wide significance of 5×10⁻⁸, we note that 1 SNP in the region near the voltage-dependent calcium channel gene CACNA2D1 was associated at P = 5.9×10⁻⁶ (rs2367911). A related gene, CACNA1C, reached genome-wide significance in a large meta-analysis [15], but was not significant in this study (Table S3). We assessed replication of loci implicated in other GWAS and show consistent support with the imputed SNP rs10994336 at ANK3 (P = 0.02), as well as the genotyped SNP rs9804190 (P = 0.02) that has been suggested to signal an alternate allele [14] (Table S3). We performed a fixed effects meta-analysis with SNPs that overlapped in the Wellcome Trust Case Control Consortium (WTCCC) [8] BD dataset (Figure S1 and Table S4). There were no genome-wide significant associations, with the strongest association at chromosome 2 (peak SNP rs12618769, P = 1.0×10⁻⁶). Although many of the top associations changed, there was an overall high correlation (r = 0.42) between −log P-values across the GAIN-TGEN and GAIN-TGEN-WTCCC meta-analyses. We scored individuals in the GAIN+TGEN study based on the observed odds ratios in WTCCC across all markers to test for polygenic effects [17]. We saw a significant association when all SNPs, SNPs pruned for linkage equilibrium (r2<0.5), or SNPs pruned for independent associations using PLINK's “clump” procedure were used (All: P = 2.3×10⁻²⁰, LE: P = 1.7×10⁻¹⁷, clumped: P = 5.9×10⁻¹⁸), with all SNPs explaining 3.3% of the variation in diagnosis (Figure S3).
Because the multilocus scoring method suggested an underlying polygenic influence on BD, that did not include SNPs that were individually significantly associated with BD at genome-wide significance levels, we hypothesized that we were underpowered to detect single locus effects given our sample size. If, however, effect sizes for the SNPs have been well estimated in the GWAS considered, then we would expect that we would observe associations in one data set as a function of power to detect effects based on information obtained in a different data set; i.e., variants that we have 80% power to detect based on one data set will be observed to be associated 80% of the time in other data sets. We thus assessed the power to detect SNP effects obtained in one GWAS data set and applied this information to others (Figure S4). To do this, we estimated effect sizes based on a discovery GWAS data set, calculated power to detect those effects, and tested whether SNPs with the greatest power exhibited replicable associations in a second GWAS dataset.
As a proof of principle of this strategy, we considered data from a recently published meta-analysis on height [19]. Up to 53,394 individuals were genotyped on a cardiovascular disease-focused array [20], which contains 49,320 SNPs. These results were followed up in 37,052 additional samples genotyped on the same array. For each SNP, we calculated power to detect the effect in the test sample based on the effect, allele frequency, and standard deviation of height in the discovery sample. We show a strong association with almost a linear relationship between power and replication (Figure 1). If the discovery data set is restricted to fewer people, worsening the estimate of the effect size, the association decays (Figure 1). These results suggest that if the discovery sample is large enough to give a good estimate of the effect size, then we should expect replication to show a linear relationship with power. We verified this by simulating hypothetical data based on the effect sizes observed a sample of SNPs chosen from the BD and height data sets and show that if the observed effects were real, that we would expect to see replication rates linearly associated with power approximating a slope of 1 (Figure S5).

We applied this test to our BD samples. Of the SNPs that were shared between the WTCCC and GAIN-TGEN, we had 60% or higher power at an alpha of 0.05 to detect associations of the same or larger effect at only 7,277/364,259 (2.0%) SNPs, if the WTCCC effect sizes were true. We tested the hypothesis that the probability of association at P<0.05 in GAIN+TGEN was associated with the power to detect them based on the WTCCC data using logistic regression. We found that we were more likely to replicate associations at P<0.05 when we had more power to detect them (Figure 2, blue line; logistic P = 1.5×10⁻⁷). This P-value does not require multiple-testing correction since we are not analyzing SNPs individually, but are rather testing a single hypothesis: the correlation between power based on one study and association strength in another. This trend was not observed when case/control status was permuted in the GAIN+TGEN combined sample (Figure 2, green line; P = 0.32). When we restricted our analysis to a subset of SNPs that are in linkage equilibrium (r2<0.5), we still see a significant association (P = 0.01). These results are consistent with the notion that multiple variants, each likely of small effect, contribute to BD. It might also be the case that the genotyped loci are tagging multiple rare variants that contribute to a polygenic effect [21]. Excluding regions covering ANK3, CACNA1C, and 15q14 (+/−1 Mb) that have been highlighted in a meta-analysis of BD GWAS [15] did not attenuate the association (logistic P = 1.4×10⁻⁷). This indicates that there is an underlying genetic signal for BD shared between the WTCCC and GAIN+TGEN studies within yet-to-be-described regions that are tagged by common variation.

We estimated the number of SNPs driving this effect by counting the excess SNPs in the highest power deciles (Figure S6). Among SNPs for which we have 60% power or higher, we observe 503/7,277 (6.9%) associated at P<0.05. This is an excess of 89 SNPs more than the 414 that we would expect from the average rate of replication across all SNPs, 5.69%. Since the majority (414/503, 82%) of the SNPs are likely to be false, however, we cannot specifically identify which SNPs are contributing to the excess association. Additionally, since some of these SNPs are not independent, we cannot say how many loci might be causally associated with BD.
Recent advances in sequencing and exon targeting have made exon sequencing more feasible. We tested whether there was an excess of replicating SNPs near coding regions. We stratified the SNPs by their location relative to exons (within 2 kb; this amounted to 15% of all SNPs). We then tested whether SNPs near exons showed stronger associations between discovery set-based power to replicate and test set replication (Figure 2, black line). At the higher levels of discovery-based power, a higher proportion of SNPs near exons yielded P<0.05 than did SNPs that are further away from exons (Figure 2, red line). We quantified this difference using logistic regression, testing the interaction between power and whether a SNP was close to an exon (logistic regression SNP location×power interaction, P = 7.8×10⁻⁶). Extending the distance between SNP and exon to 25 kb attenuated the enrichment at higher power levels (Figure 2, purple line), but the interaction term remained significant (P = 8.4×10⁻⁵). When we investigated a range of distances, the enrichment was strongest up to 10 kb, but SNPs within exons were not enriched for replication (Figure S7). This is consistent with variation in nearby sequences, possibly regulatory in nature, being associated with the disease. This suggests that the regions near exons are likely to be enriched for variants associated with BD. This does not imply that disease-associated variation is exonic, but that the portion of the genome that is near genes also contains proportionally more variation likely to be associated with disease.
As a negative control, we used power derived from phenotypes in the WTCCC other than BD and performed the same tests (Table 1). These other phenotypes did not show the same level of reproducibility as BD, although some P-values were observed at P<0.05/7, these were weak compared to the BD-derived values. This suggests that the enrichment of associated SNPs is specific to BD. SNPs were more likely replicate at P<0.05 if the effects seen in GAIN+TGEN were in the same direction as those seen in WTCCC (P = 1.3×10⁻²¹, Table S5). This effect was also dependent on power, consistent with true associations having the same direction of effect (P = 1.9×10⁻⁶). Using other WTCCC phenotypes as input, we usually saw no association between the consistency of direction of effect and replication in GAIN+TGEN (Table S5). We did see an association with Crohn's Disease (P = 3.0×10⁻⁸), but this effect was independent of power (interaction P = 0.65). These less strongly associated relationships could be explained by subtle underlying shared genetics, but may also be artifactual as they were not consistent with patterns observed with overall genotype correlations showing similarity between BD, CAD, and T2D [22].
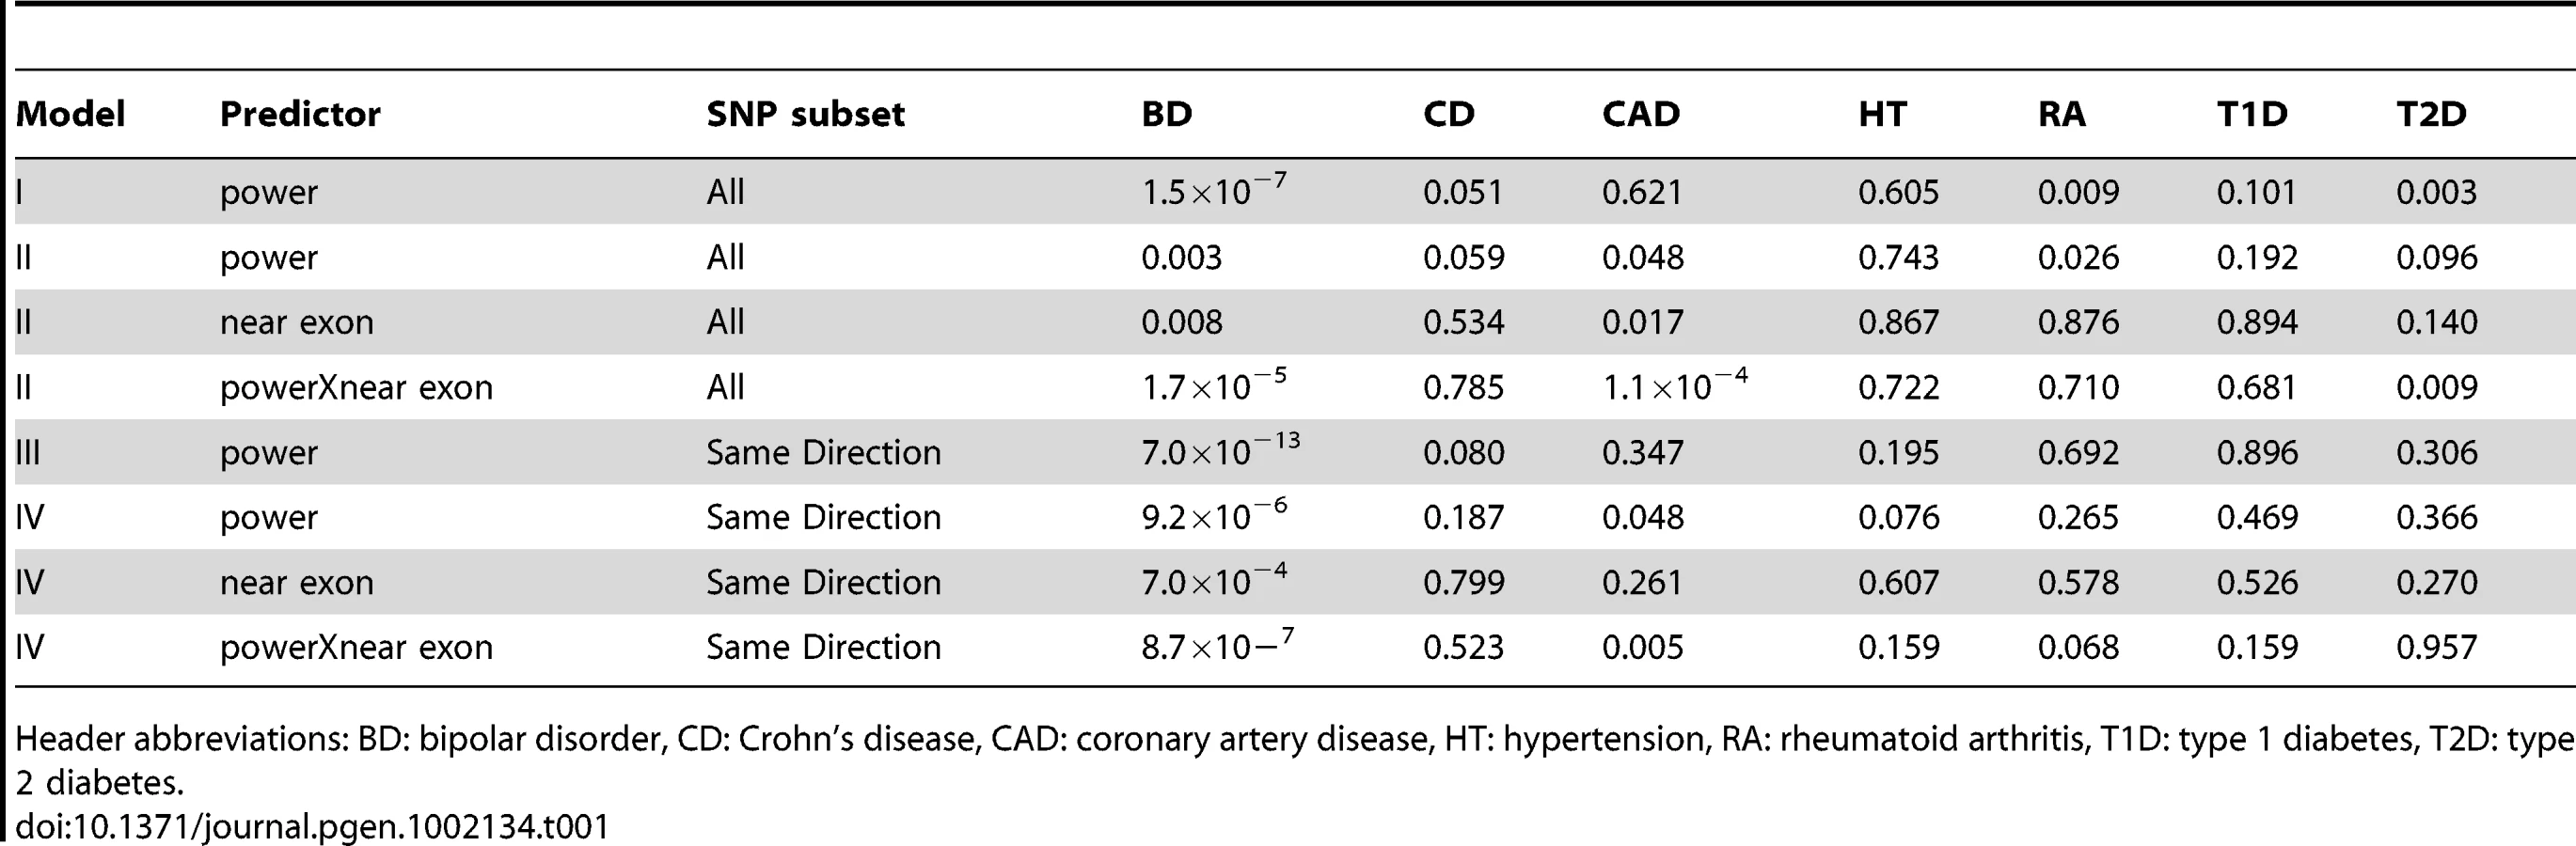
While the use of P-value<0.05 represents a moderately stringent cutoff, showing effects in the same direction is a less stringent criterion. If we restrict our analyses to only those SNPs where effects were in the same direction in both studies, we see even stronger associations with BD and no association with the other phenotypes (Table 1). The association with power is similarly enriched (Figure 2). This adds support for the observation that these effects are consistent across studies that are likely to reflect underlying true variation associated with BD.
SNPs with very high power (>90%) based on WTCCC BD effects were less likely to replicate than SNPs at powers between 80–90%. In addition to noise due to smaller numbers of SNPs at the higher level, there may be artifactual associations in the strongest associations of the WTCCC: many of the top associated SNPs in the original study required filtering, but cluster plots were not inspected for those associations that were not at P<10−7 [8]. We switched the sample used to calculate power, using GAIN+TGEN as the basis for the OR and MAF, and calculated association in the WTCCC sample, and did not see this effect (Figure S8). The overall association is significant, albeit weaker (Ppower = 0.002, Plocation×power interaction = 2.0×10⁻⁷).
Discussion
We report a complementary approach to standard meta-analysis when there is an existing, unrelated study that can be leveraged to assess the consistency of effects across studies. This analysis does not specify which SNPs are associated, but investigates trends among the SNPs and their association strengths. By analyzing results in the context of what one study suggests is the power to detect effects in another study, association signals likely to be of functional significance can be better partitioned.
Using an analysis of height GWAS data as a proof-of-principle, we showed that with enough samples in the discovery data set there was an almost linear relationship between replication P-values and power based on variant and effect size information obtained in a separate sample with a slope of 1. However, we did not see as strong of an effect with BD. This could be due to the small sample size in WTCCC-BD, relative to the height data we had at our disposal; the association may increase with sample size.
In this analysis, we assume that the same variation that is likely to be causal in one study is likely to be causal in the other, and that both studies have similar linkage disequilibrium structure. Population-specific variation or variation that has population-dependent effects would not be expected to replicate to the same extent. Phenotypic heterogeneity across populations, which may be more of a challenge for psychiatric diseases than it is for height, will also contribute to low levels of replication. In the case of heterogeneity, one would expect that the relationship between replication and power would not approach a slope of 1 as sample size increases.
Although we use common variation to tag these associations, the underlying functional variation may be rare or common, as collections of rare variants of stronger effect can produce an association signal consistent with observed effect sizes [21]. Further studies that include deep sequencing would be required to identify these variants. As applied to BD, this analysis supports the presence of replicable and potential functional variation associated with BD that is enriched in regions near genes. However, the enrichment signal was not present within exons but rather was observed only when regions up to 10 kb around exons were included in the analysis. This suggests that sequencing of individuals with BD should include noncoding regions near genes.
The model of polygenic inheritance suggests that there are many loci throughout the genome, each with small effect, that influence phenotypic expression. Our result for BD does not rule out the model of many loci, but suggests that for this disease, truly associated variation may be enriched near genes. Thus, the genetic architecture of BD that is tagged by common variation does not appear to be evenly distributed throughout the genome, but may reside in circumscribed regions.
Many recent studies have been pursued to better understand if non-genome-wide significant variation can still be considered to harbor phenotypically-relevant information. For example, Yang et al. [4] quantified variation explained by all SNPs by fitting a single regression model that included thousands of variants in order to assess the collective effect of these variants on height and estimated the variation in height explained by these variants. Park et al. [3] took a different approach and used the distribution of effect sizes at genome-wide significant loci in conjunction with the power to detect those effects to extrapolate the distribution of undetected genetic loci. Our approach differs from these methods in a number of ways. First, we do not require individual level data and only require summary level results, which can obviate the need for individual data use restrictions. Second, we do not require genome-wide significant results to estimate a true effect size distribution, which is helpful when there are few to no significant associations. Third, because the replication vs. power relationship approaches a slope of 1 when the effect sizes are real and reproducible, this approach provides and alternative framework for understanding the extent of the reliability of signals even when they are not genome-wide significant.
Given the number of inconclusive GWAS with marginal results in need of interpretation, we feel that the approach described in this paper provides an important tool for assessing whether there is an underlying genetic basis for a phenotype and/or whether additional samples might be needed to detect genetic associations. Studies that are too underpowered to detect any replication signal, however, may require additional samples before applying this approach. Additionally, in the context of sequence data, specific groups of variants can be tested for stronger associations between power and replication. The method is easy to apply in the context of a meta-analysis where association results are present for large numbers of SNPs.
Materials and Methods
Ethics Statement
All eleven collection sites in the BiGS Consortium received IRB approval for subject ascertainment, assessment, and collection of DNA for genetic studies. All participating subjects signed a statement of informed consent.
Study Subjects
The subjects used in the GAIN [12] and WTCCC [8] samples have been previously described. The TGEN cases consisted of unrelated individuals from the “Wave 5” collection of the Bipolar Consortium, which included 1,310 unrelated DNA samples from families ascertained through probands with DSM IV-defined BPI disorder [12], 1,190 of which ultimately passed QC measures. While GAIN samples were primarily from larger families with multiple BD cases or sib-pairs, TGEN samples were primarily population-based and were not required to have a family history. Controls were collected by NorthShore University HealthSystem, Evanston, IL, R01 MH59571, Pablo V. Gejman, M.D. (Collaboration Coordinator; PI) as part of a collaborative R01 application comprised of ten sites (see Acknowledgements).
Genome-Wide SNP Genotyping
Genomic DNA samples were analyzed on the Genome-Wide Human SNP 6.0 Array (Affymetrix, Inc. Santa Clara, CA) according to the manufacturer's protocols (Affymetrix Genome-Wide Human SNP Nsp/Sty 6.0 User Guide;Rev. 1 2007). Before the initiation of the assay, 50 ng of genomic DNA from each sample was examined qualitatively on a 1% Tris-acetate-EDTA agarose gel for visual signs of degradation. Any degraded DNA samples were excluded from further analysis (∼3%). Samples were quantitated by Spectrometry and diluted to 50 ng/µl in reduced EDTA TE buffer (10 mM Tris HCL, 0.1 mM EDTA, pH 8.0). 250 ng of DNA was then aliquotted into two 96-well reaction plates and digested with either Sty or Nsp restriction enzymes (New England Biolabs, Inc. Ipswich, MA) for 2 hours at 37°C followed by 65°C for 20 min. Sty and Nsp digested samples were then ligated to either the Sty 1 or the Nsp 1 adaptor (Affymetrix), respectively, with T4 DNA Ligase (New England Biolabs) for 3 hours at 16°C then 20 min at 70°C. The ligated samples were then diluted in molecular-grade water and subaliquotted into 3 (Sty) or 4 (Nsp) 96 well PCR plates. PCR was performed using PCR Primer 002 (Affymetrix) and Titanium Taq DNA Polymerase (Clontech, Mountain View, CA) with the following thermal cycling parameters: 1. 94°C for 3 min., 2. 30 cycles of 94°C for 30 sec., 60°C for 30 sec., and 68°C for 15 sec., and 3. 68°C for 7 min. Like samples for all Sty and Nsp reactions were pooled into a single deep well plate, the DNA was bound to Agencourt AMPure beads (Beckman Coulter, Inc. Berea, CA), placed into MultiScreen filter plates (Millipore, Billerica, MA), washed with 75% ethanol and eluted with Buffer EB (QIAGEN, Valencia, CA). Purified samples were then fragmented using Fragmentation Reagent (Affymetrix) and incubated at 37°C for 35 min. then at 95°C for 15 min. Fragmented samples were labeled with DNA Labeling Reagent (Affymetrix) and TdT Enzyme (New England Biolabs) at 37°C for 4 hours followed by 95°C for 15 min. The samples were denatured at 95°C for 10 min. and held at 49°C until they were loaded on to the arrays. The arrays were placed into the hybridization oven at 50°C and 60 rpm for 16 to 18 hours. Arrays were then washed, stained and immediately imaged on the GeneChip Scanner 3000 (Affymetrix). Birdsuite was used to call SNP genotypes from CEL files. Initial quality control measures consisted of gender-checks and a custom SNP fingerprinting approach to identify potentially duplicated or related individuals.
Genotyping Quality Control
1,858 samples [1,310 Bipolar cases, 408 controls,140 technical controls (42 case replicates, 43 control replicates, 19 HapMap individuals, and 36 parents from 19 case families)] passed a call rate threshold of 97%, QC contrast of 0.40, and gender consistency. We further removed samples that did not have a diagnosis of Bipolar Disorder I or Schizoaffective Bipolar Disorder (78 cases filtered), that were outliers on the first 2 coordinates of an MDS plot including HapMap 3 individuals (N = 6 controls and 35 cases), that showed poor concordance between duplicates (3 individuals out of 85 pairs), that appeared to be more similar to another individual in the GAIN study than expected (PI_HAT>0.15) (6 cases that were related to someone in GAIN or appeared to be the same person that had entered the study twice), or that had high heterozygosity (>0.285 averaged across all markers, N = 1 case). A total of 1,190 cases and 401 controls remained and are included in the analysis.
SNPs were filtered for a lack of positional information from Affymetrix (N = 1,233), low minor allele frequency (<1%, N = 145,345), significant deviation from Hardy-Weinberg equilibrium in controls (P<10−6, 592), low call rate (<95%, N = 34,930), poor duplicate concordance (>2 heterozygote or homozygote errors, 16,541), or >1 Mendelian error within families (N = 1,348). A total of 178,413 SNPs were removed, leaving a final count of 728,187 SNPs. Of these, 703,019 also passed QC in GAIN and were included in the merged analysis. Genotypes are reported in genome forward orientation based on NCBI build 36 via the Affymetrix annotation file GenomeWideSNP_6.na27.annot.csv.
Imputation
Genotype data was further filtered (MAF> = 5% and Hardy-Weinberg P<10−6 using all samples) and imputed to the CEU HapMap 2 (CEU_r22_b36_fwd) genotypes using MACH [23] (http://www.sph.umich.edu/csg/abecasis/MACH/index.html). Imputation results were filtered such that r2> = 0.30.
Association
Association analysis was performed on the genotype data in PLINK [24] using logistic regression, adjusting for study in the GAIN+TGEN sample, and using the –dosage command with the predictor being the maximum likelihood estimate of the number of alleles at the locus (format = 1). Adjusting for up to 10 MDS components did not alter the genomic inflation factor, so they were not included as covariates.
WTCCC Data
WTCCC genotype data was downloaded in TPED format and filtered as described in the accompanying documentation. Genotype calls were filtered based on CHIAMO quality scores (>0.90); SNPs were filtered according to SNP lists provided by the WTCCC, including SNPs that were excluded based on poor genotype clustering; and individuals were filtered according to individual lists provided by the WTCCC for a total of 459,075 SNPs, 1,868 bipolar disorder (BD) cases, 1,926 coronary artery disease (CAD) cases, 1,748 Crohn's disease (CD) cases, 1,952 hypertension (HT) cases, 1,860 rheumatoid arthritis (RA) cases, 1,963 type 1 diabetes (T1D) cases, 1,924 type 2 diabetes (T2D) cases, 1,458 United Kingdom Blood Services (NBS) controls, and 1,480 1958 British Birth Cohort (58C) controls.
Meta-Analysis
Association for WTCCC samples was performed in PLINK using logistic regression without any covariates. For each phenotype, cases were analyzed against both (NBS and 58C) control sets. Meta-analysis was performed in PLINK using the –meta-analysis command. Fixed effects P-values are reported.
Polygenic Scoring
SNPs that were genotyped in both WTCCC-BD and GAIN+TGEN were used to generate scores for each individual in GAIN+TGEN. Odds ratios from WTCCC-BD were natural log transformed and used as a score in the SNP scoring routine of PLINK. Subsets of SNPs achieving different P-value cutoffs were used such that weakly associated SNPs were progressively added to strongly associated SNPs. SNPs were pruned to linkage equilibrium (r2<0.5) using the “—indep-pairwise” command in PLINK with a sliding window of 50 SNPs and a 5 SNP step. SNPs were clumped to independent associations using the “—clump” command in PLINK. Index SNPs were selected at P<0.1, with a secondary threshold of P<0.1, r2<0.5, and a 250 kb window. Logistic regression was used to test for association between score and case-control status in R [25] (glm command). The lrm command was used to calculate a pseudo-R2 statistic.
Height Meta-Analysis and Power Calculations
Summary-level data was obtained from a meta-analysis of height using a genotyping chip targeting genes related to cardiovascular disease, covering 49,320 SNPs and about 2,000 genes. We used the natural division of the Phase I cohort consisting of 53,394 individuals of European Ancestry as our discovery set and the collection of Phase II cohorts consisting of 37,052 individuals of European Ancestry as our test dataset. We performed meta-analysis on the Phase I and Phase II samples using METAL as described [19].
Power was calculated using the pwr.f2.test function from the pwr package in R with 1 degree of freedom in the numerator; N−2 degrees of freedom in the denominator, where N is the number of individuals with genotype data for the SNP in the test dataset; alpha of 0.05; and effect size f2. The effect size f2 was calculated as:R2 was calculated as:where beta is the effect size from the meta-analysis and s is standard deviation. In the study, height was expressed in cm and was not standardized to a z-score. The standard deviation of height was calculated as the sample size-weighted standard deviation across all discovery data sets (9.2 cm), and the standard deviation of the SNP was calculated from the allele frequencies assuming Hardy-Weinberg equilibrium. Because a proportion of SNPs were only tested in a small number of samples, we filtered the 20% of SNPs with the lowest sample sizes. To test the role of sample size on initial effect estimates, studies were progressively added to the discovery data and the meta-analysis was repeated on each subset of the data.
BD Power Calculation
Power was calculated based on association results from WTCCC Bipolar cases and controls (NBS+58C) [26]. SNPs were additionally filtered for MAF (>1%). In order to calculate power, the non-centrality parameter was calculated given the odds ratio (OR) from WTCCC, minor allele frequency in WTCCC controls, and the number of case and control samples in the TGEN+GAIN combined sample [27]. OR and MAF were rounded to 2 decimals. Power was calculated using G*Power 3 [28] given the non-centrality parameter and an alpha of 0.05.
Associations between power and replication at P<0.05 or consistency of effect size were performed using logistic regression in R using the glm command (family = binomial(“logit”)). For plots, smoothing was performed using the smooth.spline function in R.
Power Simulations
For both height and BD samples, we performed simulations in R to show that given the observed effect size, we would expect to see replication rates associated with power linearly with a slope of 1. We sampled 361 SNPs from each study across power levels, with 19 SNPs from each 5% power bracket. We simulated a population of 1,000,000 individuals with genotypes based on the allele frequency given Hardy-Weinberg expectations. For the BD case-control study, an individual's risk of disease was 1% multiplied by the odds ratio raised to the power of the number of risk alleles they carried. If this risk was greater than a random number between 0 and 1, then they were considered affected. For each SNP, we performed 100 permutations, sampling cases and controls in numbers to match the GAIN-TGEN sample and performed logistic regression. The observed replication rate is the proportion of tests that reached P<0.05. For the quantitative height example, a individual's baseline height in standard deviations was modeled using a random number as a quantile of the normal distribution using the command qnorm in R. The observed effect of the SNP was then multiplied by the number of risk alleles and added to the baseline height. For 100 permutations per SNP, a random sample of individuals corresponding to the number of individuals tested for that SNP in the Phase II study was taken and association was tested using linear regression.
Enrichment near Exons
Exon location in the RefSeq genes was determined from refGene table (http://genome.ucsc.edu/cgi-bin/hgTables). For each SNP, the closest exon within 1 Mb was determined and the distance to that exon calculated. If a SNP was within an exon, a distance of 0 was used. An indicator variable of whether the SNP was within 2 kb or 25 kb of an exon was used in logistic regression.
Supporting Information
Zdroje
1. ManolioTA 2010 Genomewide association studies and assessment of the risk of disease. N Engl J Med 363 166 176
2. HindorffLASethupathyPJunkinsHARamosEMMehtaJP 2009 Potential etiologic and functional implications of genome-wide association loci for human diseases and traits. Proc Natl Acad Sci U S A 106 9362 9367
3. ParkJHWacholderSGailMHPetersUJacobsKB 2010 Estimation of effect size distribution from genome-wide association studies and implications for future discoveries. Nat Genet 42 570 575
4. YangJBenyaminBMcEvoyBPGordonSHendersAK 2010 Common SNPs explain a large proportion of the heritability for human height. Nature genetics 42 565 569
5. Lango AllenHEstradaKLettreGBerndtSIWeedonMN 2010 Hundreds of variants clustered in genomic loci and biological pathways affect human height. Nature
6. SpeliotesEKWillerCJBerndtSIMondaKLThorleifssonG 2010 Association analyses of 249,796 individuals reveal 18 new loci associated with body mass index. Nat Genet
7. HeidIMJacksonAURandallJCWinklerTWQiL 2010 Meta-analysis identifies 13 new loci associated with waist-hip ratio and reveals sexual dimorphism in the genetic basis of fat distribution. Nat Genet
8. WTCCC 2007 Genome-wide association study of 14,000 cases of seven common diseases and 3,000 shared controls. Nature 447 661 678
9. RischNBotsteinD 1996 A manic depressive history. Nat Genet 12 351 353
10. BarnettJHSmollerJW 2009 The genetics of bipolar disorder. Neuroscience 164 331 343
11. BaumAEAkulaNCabaneroMCardonaICoronaW 2008 A genome-wide association study implicates diacylglycerol kinase eta (DGKH) and several other genes in the etiology of bipolar disorder. Mol Psychiatry 13 197 207
12. SmithENBlossCSBadnerJABarrettTBelmontePL 2009 Genome-wide association study of bipolar disorder in European American and African American individuals. Mol Psychiatry 14 755 763
13. ScottLJMugliaPKongXQGuanWFlickingerM 2009 Genome-wide association and meta-analysis of bipolar disorder in individuals of European ancestry. Proc Natl Acad Sci U S A 106 7501 7506
14. SchulzeTGDetera-WadleighSDAkulaNGuptaAKassemL 2009 Two variants in Ankyrin 3 (ANK3) are independent genetic risk factors for bipolar disorder. Mol Psychiatry 14 487 491
15. FerreiraMAO'DonovanMCMengYAJonesIRRuderferDM 2008 Collaborative genome-wide association analysis supports a role for ANK3 and CACNA1C in bipolar disorder. Nat Genet 40 1056 1058
16. McMahonFJAkulaNSchulzeTGMugliaPTozziF 2010 Meta-analysis of genome-wide association data identifies a risk locus for major mood disorders on 3p21.1. Nat Genet 42 128 131
17. PurcellSMWrayNRStoneJLVisscherPMO'DonovanMC 2009 Common polygenic variation contributes to risk of schizophrenia and bipolar disorder. Nature 460 748 752
18. StoreyJDTibshiraniR 2003 Statistical significance for genomewide studies. Proc Natl Acad Sci U S A 100 9440 9445
19. LanktreeMBGuoYMurtazaMGlessnerJTBaileySD 2011 Meta-analysis of Dense Genecentric Association Studies Reveals Common and Uncommon Variants Associated with Height. Am J Hum Genet 88 6 18
20. KeatingBJTischfieldSMurraySSBhangaleTPriceTS 2008 Concept, design and implementation of a cardiovascular gene-centric 50 k SNP array for large-scale genomic association studies. PLoS ONE 3 e3583 doi:10.1371/journal.pone.0003583
21. DicksonSPWangKKrantzIHakonarsonHGoldsteinDB 2010 Rare variants create synthetic genome-wide associations. PLoS Biol 8 e1000294 doi:10.1371/journal.pbio.1000294
22. TorkamaniATopolEJSchorkNJ 2008 Pathway analysis of seven common diseases assessed by genome-wide association. Genomics 92 265 272
23. LiYWillerCSannaSAbecasisG 2009 Genotype imputation. Annu Rev Genomics Hum Genet 10 387 406
24. PurcellSNealeBTodd-BrownKThomasLFerreiraMA 2007 PLINK: a tool set for whole-genome association and population-based linkage analyses. Am J Hum Genet 81 559 575
25. R Development Core Team 2008 R: A language and environment for statistical computing. R Foundation for Statistical Computing, Vienna, Austria. ISBN 3-900051-07-0, URL http://www.R-project.org
26. 2007 Genome-wide association study of 14,000 cases of seven common diseases and 3,000 shared controls. Nature 447 661 678
27. KleinRJ 2007 Power analysis for genome-wide association studies. BMC Genet 8 58
28. FaulFErdfelderELangAGBuchnerA 2007 G*Power 3: a flexible statistical power analysis program for the social, behavioral, and biomedical sciences. Behav Res Methods 39 175 191
Štítky
Genetika Reprodukční medicínaČlánek vyšel v časopise
PLOS Genetics
2011 Číslo 6
Nejčtenější v tomto čísle
- Recurrent Chromosome 16p13.1 Duplications Are a Risk Factor for Aortic Dissections
- Statistical Inference on the Mechanisms of Genome Evolution
- Genome-Wide Association Study of White Blood Cell Count in 16,388 African Americans: the Continental Origins and Genetic Epidemiology Network (COGENT)
- Chromosomal Macrodomains and Associated Proteins: Implications for DNA Organization and Replication in Gram Negative Bacteria